
By InvestMacro
Here are the latest charts and statistics for the Commitment of Traders (COT) reports data published by the Commodities Futures Trading Commission (CFTC).
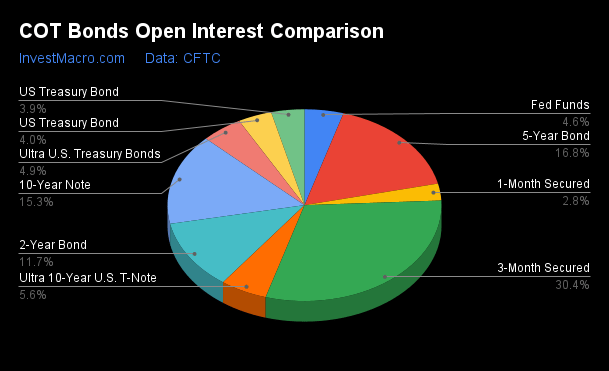
The latest COT data is updated through Tuesday July 11th and shows a quick view of how large traders (for-profit speculators and commercial hedgers) were positioned in the futures markets.
Weekly Speculator Changes led by 10-Year Treasury Bonds
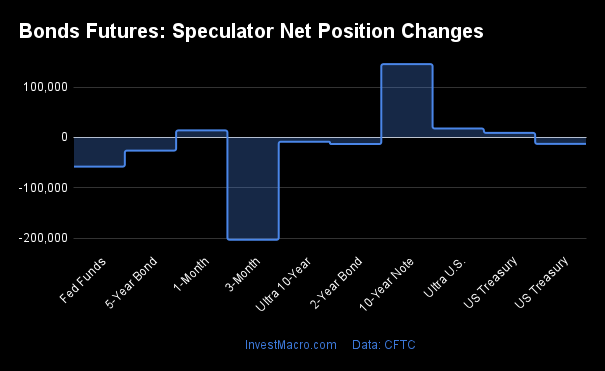
The COT bond market speculator bets were lower this week as three out of the eight bond markets we cover had higher positioning while the other five markets had lower speculator contracts.
Leading the gains for the bond markets was the 10-Year Bonds (145,541 contracts) with the Ultra Treasury Bonds (17,660 contracts), the US Treasury Bonds (8,945 contracts) , and also showing positive weeks.
The bond markets with declines in speculator bets for the week were the SOFR 3-Months (-203,437 contracts), the Fed Funds (-58,101 contracts), the 5-Year Bonds (-26,270 contracts), the 2-Year Bonds (-13,274 contracts) and the Ultra 10-Year Bonds (-8,572 contracts)also registering lower bets on the week.
| Jul-11-2023 | OI | OI-Index | Spec-Net | Spec-Index | Com-Net | COM-Index | Smalls-Net | Smalls-Index |
|---|---|---|---|---|---|---|---|---|
| SOFR-3-Months | 9,506,863 | 91 | 36,402 | 83 | -14,936 | 17 | -21,466 | 76 |
| FedFunds | 1,440,370 | 41 | -164,859 | 24 | 184,514 | 77 | -19,655 | 52 |
| 2-Year | 3,678,629 | 100 | -1,071,700 | 0 | 983,341 | 100 | 88,359 | 97 |
| Long T-Bond | 1,251,592 | 63 | -130,984 | 42 | 101,678 | 47 | 29,306 | 70 |
| 10-Year | 4,800,091 | 94 | -635,137 | 21 | 636,943 | 87 | -1,806 | 73 |
| 5-Year | 5,257,885 | 100 | -1,056,084 | 0 | 997,944 | 97 | 58,140 | 97 |
Strength Scores led by SOFR 3-Months & US Treasury Bonds
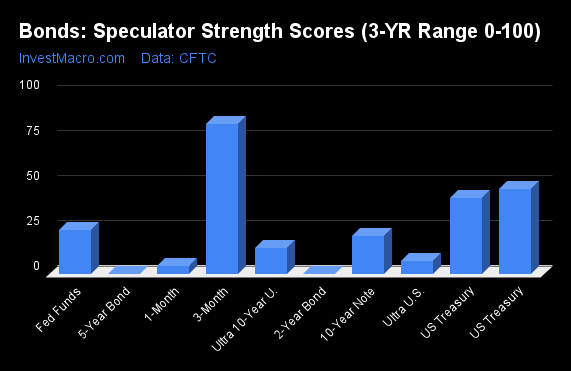
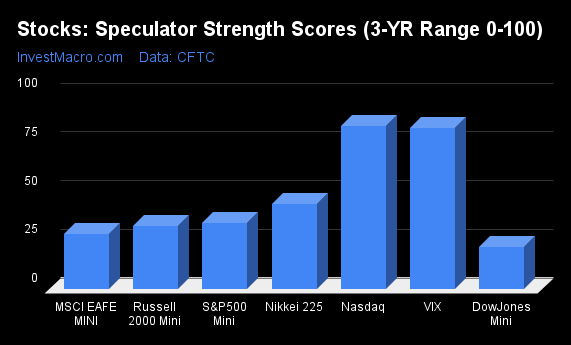
COT Strength Scores (a normalized measure of Speculator positions over a 3-Year range, from 0 to 100 where above 80 is Extreme-Bullish and below 20 is Extreme-Bearish) showed that the SOFR 3-Months (83 percent) and the US Treasury Bonds (42 percent) lead the bond markets this week.
On the downside, the 5-Year Bonds (0 percent), the 2-Year Bonds (0 percent), the Ultra Treasury Bonds (7 percent) and the Ultra 10-Year Bonds (14 percent) come in at the lowest strength level currently and are in Extreme-Bearish territory (below 20 percent).
Strength Statistics:
Fed Funds (24.4 percent) vs Fed Funds previous week (33.5 percent)
2-Year Bond (0.0 percent) vs 2-Year Bond previous week (1.1 percent)
5-Year Bond (0.0 percent) vs 5-Year Bond previous week (2.3 percent)
10-Year Bond (20.9 percent) vs 10-Year Bond previous week (6.8 percent)
Ultra 10-Year Bond (14.2 percent) vs Ultra 10-Year Bond previous week (15.9 percent)
US Treasury Bond (42.0 percent) vs US Treasury Bond previous week (39.1 percent)
Ultra US Treasury Bond (7.3 percent) vs Ultra US Treasury Bond previous week (0.0 percent)
SOFR 3-Months (82.9 percent) vs SOFR 3-Months previous week (97.0 percent)
10-Year Bonds & Fed Funds top the 6-Week Strength Trends
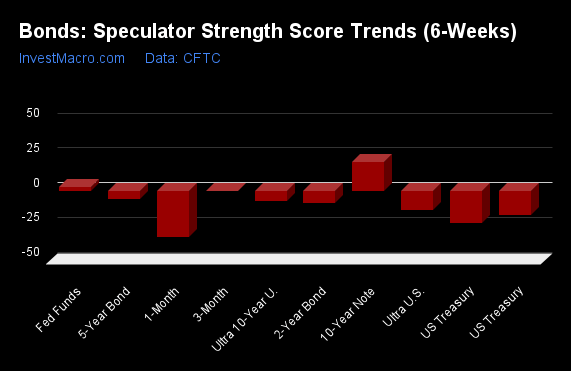
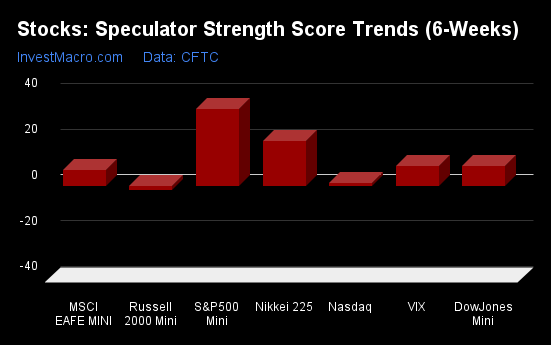
COT Strength Score Trends (or move index, calculates the 6-week changes in strength scores) showed that the 10-Year Bonds (21 percent) and the Fed Funds (2 percent) lead the past six weeks trends for bonds.
The US Treasury Bonds (-23 percent) and the Ultra Treasury Bonds (-14 percent) lead the downside trend scores currently with the 2-Year Bonds (-9 percent) and the Ultra 10-Year Bonds (-8 percent) following next with lower trend scores.
Strength Trend Statistics:
Fed Funds (2.4 percent) vs Fed Funds previous week (-2.9 percent)
2-Year Bond (-8.8 percent) vs 2-Year Bond previous week (-14.5 percent)
5-Year Bond (-6.3 percent) vs 5-Year Bond previous week (-8.3 percent)
10-Year Bond (20.9 percent) vs 10-Year Bond previous week (-0.9 percent)
Ultra 10-Year Bond (-7.7 percent) vs Ultra 10-Year Bond previous week (3.7 percent)
US Treasury Bond (-23.1 percent) vs US Treasury Bond previous week (-31.5 percent)
Ultra US Treasury Bond (-13.7 percent) vs Ultra US Treasury Bond previous week (-17.2 percent)
SOFR 3-Months (-0.5 percent) vs SOFR 3-Months previous week (23.5 percent)
Secured Overnight Financing Rate (3-Month) Futures:
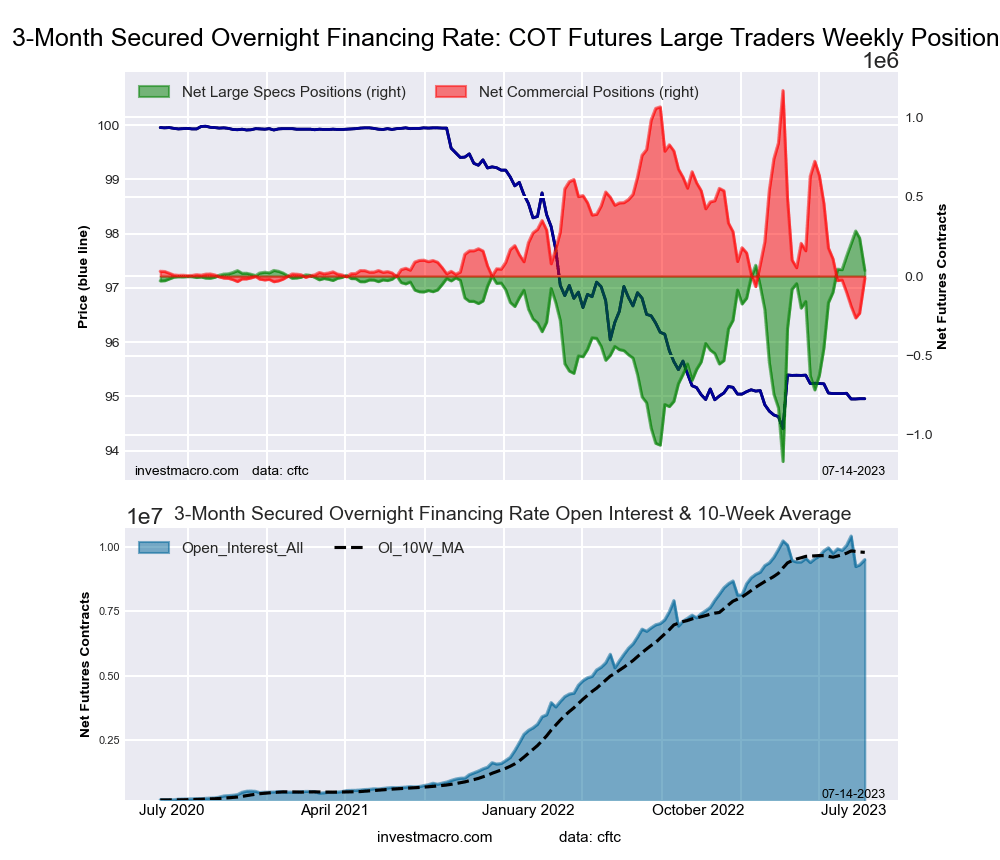 The Secured Overnight Financing Rate (3-Month) large speculator standing this week came in at a net position of 36,402 contracts in the data reported through Tuesday. This was a weekly lowering of -203,437 contracts from the previous week which had a total of 239,839 net contracts.
This week’s current strength score (the trader positioning range over the past three years, measured from 0 to 100) shows the speculators are currently Bullish-Extreme with a score of 82.9 percent. The commercials are Bearish-Extreme with a score of 17.4 percent and the small traders (not shown in chart) are Bullish with a score of 76.1 percent.
Price Trend-Following Model: Weak Uptrend
Our weekly trend-following model classifies the current market price position as: Weak Uptrend. The current action for the model is considered to be: Hold – Maintain Long Position.
| SOFR 3-Months Statistics | SPECULATORS | COMMERCIALS | SMALL TRADERS |
| – Percent of Open Interest Longs: | 19.7 | 59.2 | 0.3 |
| – Percent of Open Interest Shorts: | 19.3 | 59.4 | 0.5 |
| – Net Position: | 36,402 | -14,936 | -21,466 |
| – Gross Longs: | 1,871,733 | 5,629,349 | 28,673 |
| – Gross Shorts: | 1,835,331 | 5,644,285 | 50,139 |
| – Long to Short Ratio: | 1.0 to 1 | 1.0 to 1 | 0.6 to 1 |
| NET POSITION TREND: | |||
| – Strength Index Score (3 Year Range Pct): | 82.9 | 17.4 | 76.1 |
| – Strength Index Reading (3 Year Range): | Bullish-Extreme | Bearish-Extreme | Bullish |
| NET POSITION MOVEMENT INDEX: | |||
| – 6-Week Change in Strength Index: | -0.5 | 0.9 | -3.6 |
30-Day Federal Funds Futures:
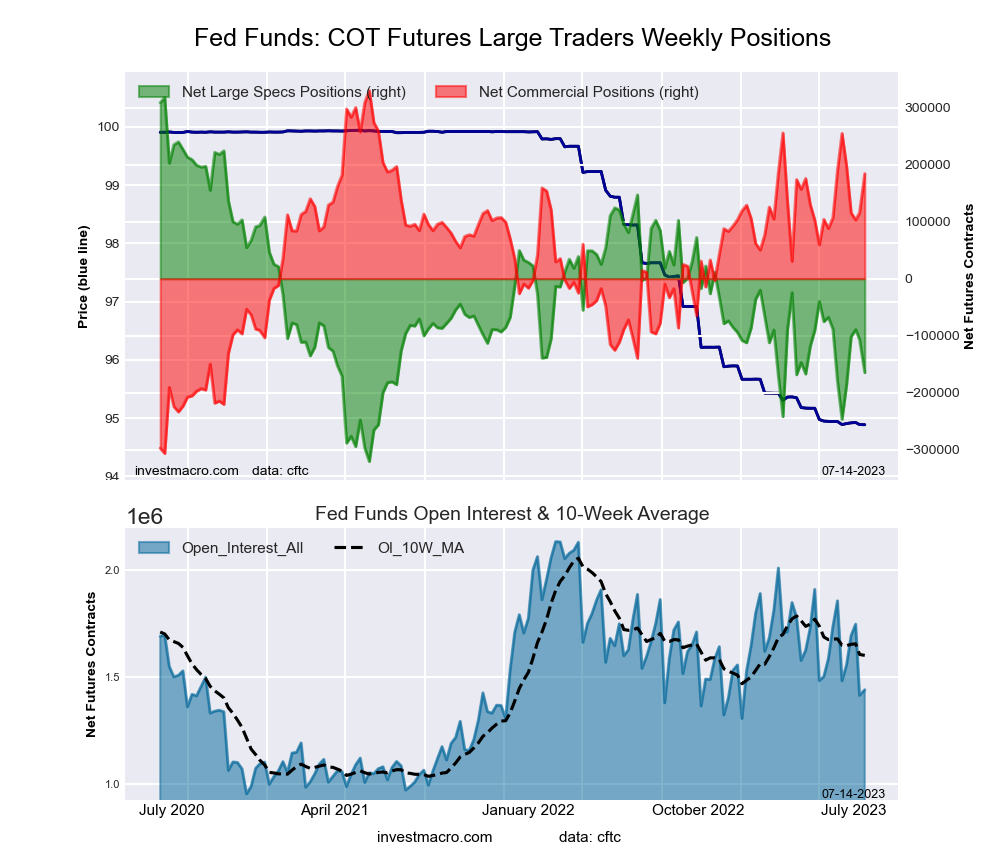 The 30-Day Federal Funds large speculator standing this week came in at a net position of -164,859 contracts in the data reported through Tuesday. This was a weekly fall of -58,101 contracts from the previous week which had a total of -106,758 net contracts.
This week’s current strength score (the trader positioning range over the past three years, measured from 0 to 100) shows the speculators are currently Bearish with a score of 24.4 percent. The commercials are Bullish with a score of 77.1 percent and the small traders (not shown in chart) are Bullish with a score of 52.4 percent.
Price Trend-Following Model: Downtrend
Our weekly trend-following model classifies the current market price position as: Downtrend. The current action for the model is considered to be: Hold – Maintain Short Position.
| 30-Day Federal Funds Statistics | SPECULATORS | COMMERCIALS | SMALL TRADERS |
| – Percent of Open Interest Longs: | 4.0 | 73.7 | 2.1 |
| – Percent of Open Interest Shorts: | 15.5 | 60.9 | 3.5 |
| – Net Position: | -164,859 | 184,514 | -19,655 |
| – Gross Longs: | 57,905 | 1,060,998 | 30,921 |
| – Gross Shorts: | 222,764 | 876,484 | 50,576 |
| – Long to Short Ratio: | 0.3 to 1 | 1.2 to 1 | 0.6 to 1 |
| NET POSITION TREND: | |||
| – Strength Index Score (3 Year Range Pct): | 24.4 | 77.1 | 52.4 |
| – Strength Index Reading (3 Year Range): | Bearish | Bullish | Bullish |
| NET POSITION MOVEMENT INDEX: | |||
| – 6-Week Change in Strength Index: | 2.4 | -0.9 | -19.3 |
2-Year Treasury Note Futures:
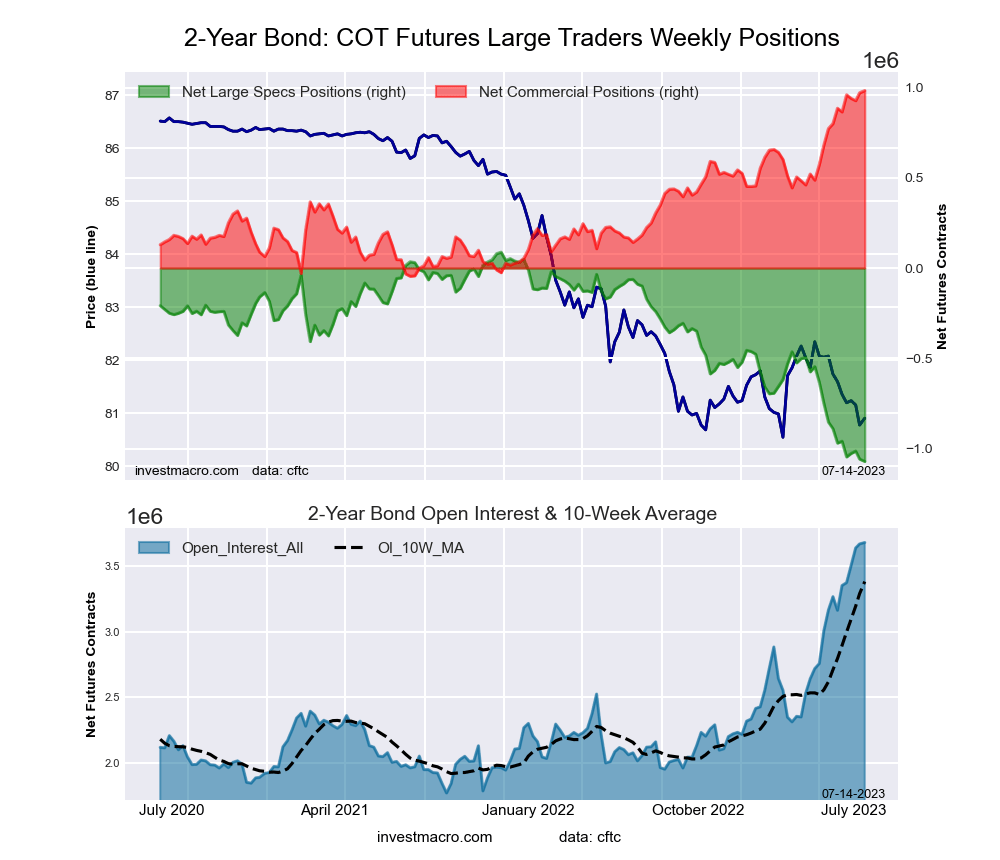 The 2-Year Treasury Note large speculator standing this week came in at a net position of -1,071,700 contracts in the data reported through Tuesday. This was a weekly decrease of -13,274 contracts from the previous week which had a total of -1,058,426 net contracts.
This week’s current strength score (the trader positioning range over the past three years, measured from 0 to 100) shows the speculators are currently Bearish-Extreme with a score of 0.0 percent. The commercials are Bullish-Extreme with a score of 100.0 percent and the small traders (not shown in chart) are Bullish-Extreme with a score of 96.8 percent.
Price Trend-Following Model: Downtrend
Our weekly trend-following model classifies the current market price position as: Downtrend. The current action for the model is considered to be: Hold – Maintain Short Position.
| 2-Year Treasury Note Statistics | SPECULATORS | COMMERCIALS | SMALL TRADERS |
| – Percent of Open Interest Longs: | 10.6 | 81.6 | 6.7 |
| – Percent of Open Interest Shorts: | 39.7 | 54.9 | 4.3 |
| – Net Position: | -1,071,700 | 983,341 | 88,359 |
| – Gross Longs: | 390,469 | 3,003,415 | 246,614 |
| – Gross Shorts: | 1,462,169 | 2,020,074 | 158,255 |
| – Long to Short Ratio: | 0.3 to 1 | 1.5 to 1 | 1.6 to 1 |
| NET POSITION TREND: | |||
| – Strength Index Score (3 Year Range Pct): | 0.0 | 100.0 | 96.8 |
| – Strength Index Reading (3 Year Range): | Bearish-Extreme | Bullish-Extreme | Bullish-Extreme |
| NET POSITION MOVEMENT INDEX: | |||
| – 6-Week Change in Strength Index: | -8.8 | 9.5 | 1.7 |
5-Year Treasury Note Futures:
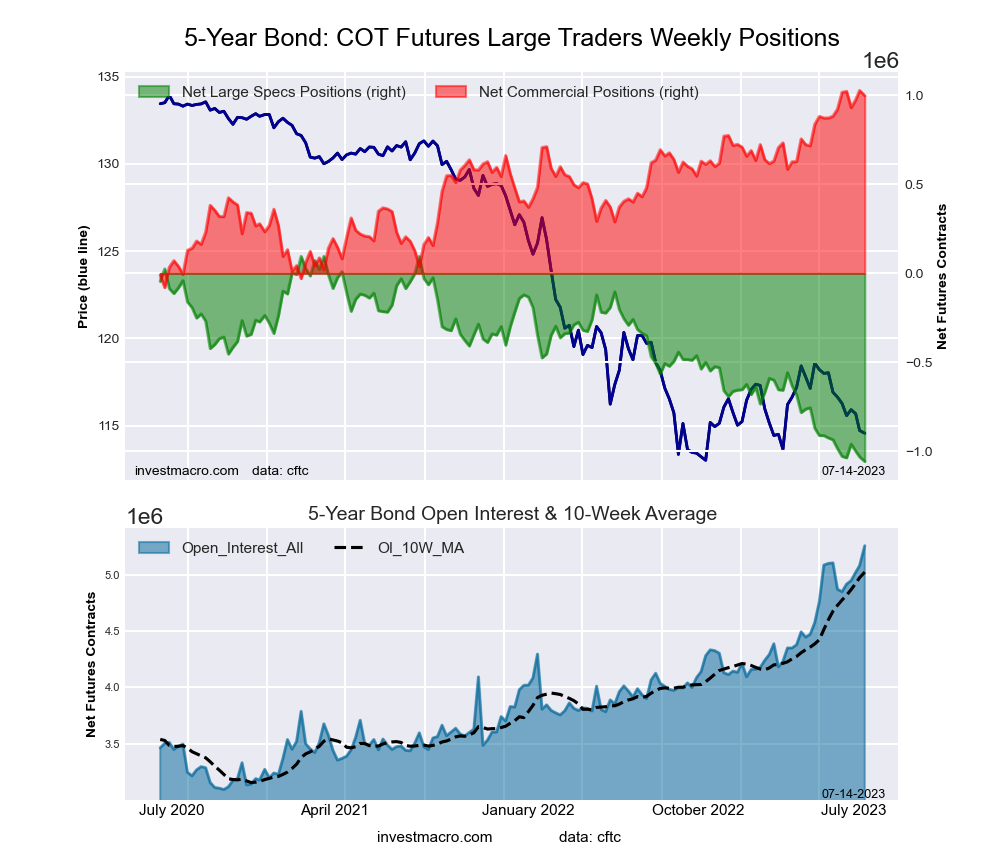 The 5-Year Treasury Note large speculator standing this week came in at a net position of -1,056,084 contracts in the data reported through Tuesday. This was a weekly reduction of -26,270 contracts from the previous week which had a total of -1,029,814 net contracts.
This week’s current strength score (the trader positioning range over the past three years, measured from 0 to 100) shows the speculators are currently Bearish-Extreme with a score of 0.0 percent. The commercials are Bullish-Extreme with a score of 97.4 percent and the small traders (not shown in chart) are Bullish-Extreme with a score of 97.0 percent.
Price Trend-Following Model: Downtrend
Our weekly trend-following model classifies the current market price position as: Downtrend. The current action for the model is considered to be: Hold – Maintain Short Position.
| 5-Year Treasury Note Statistics | SPECULATORS | COMMERCIALS | SMALL TRADERS |
| – Percent of Open Interest Longs: | 8.1 | 83.9 | 7.2 |
| – Percent of Open Interest Shorts: | 28.2 | 64.9 | 6.1 |
| – Net Position: | -1,056,084 | 997,944 | 58,140 |
| – Gross Longs: | 425,779 | 4,410,220 | 377,047 |
| – Gross Shorts: | 1,481,863 | 3,412,276 | 318,907 |
| – Long to Short Ratio: | 0.3 to 1 | 1.3 to 1 | 1.2 to 1 |
| NET POSITION TREND: | |||
| – Strength Index Score (3 Year Range Pct): | 0.0 | 97.4 | 97.0 |
| – Strength Index Reading (3 Year Range): | Bearish-Extreme | Bullish-Extreme | Bullish-Extreme |
| NET POSITION MOVEMENT INDEX: | |||
| – 6-Week Change in Strength Index: | -6.3 | 6.8 | -0.9 |
10-Year Treasury Note Futures:
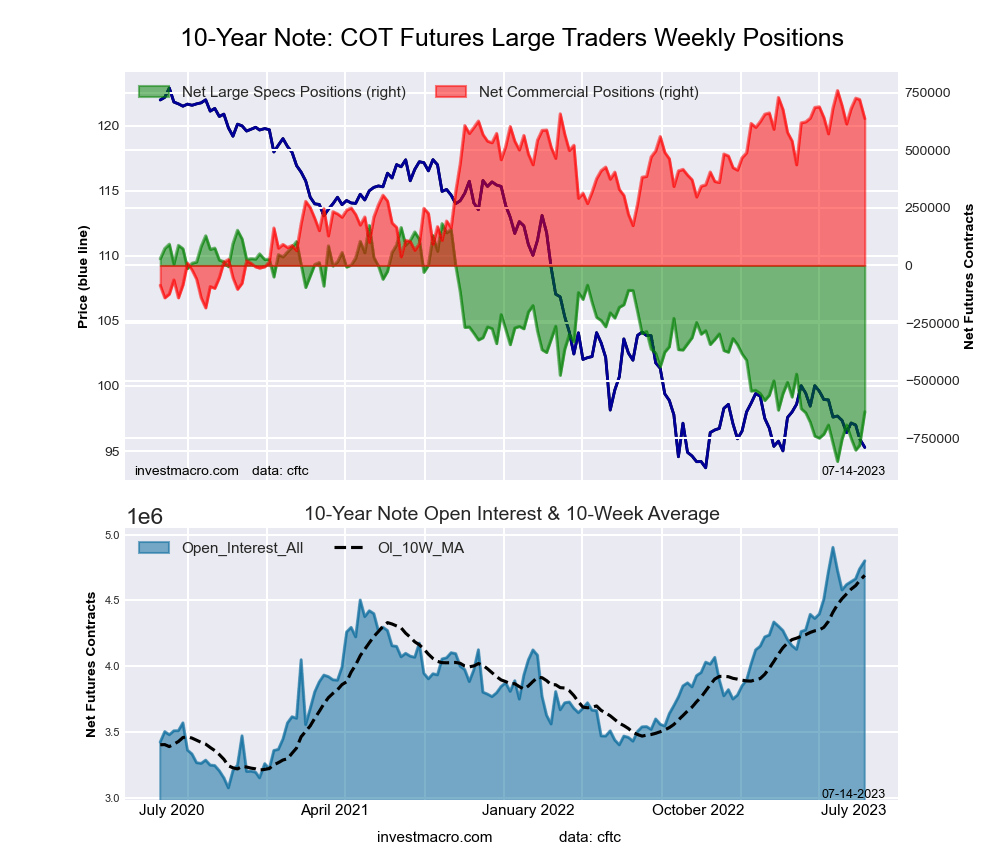 The 10-Year Treasury Note large speculator standing this week came in at a net position of -635,137 contracts in the data reported through Tuesday. This was a weekly gain of 145,541 contracts from the previous week which had a total of -780,678 net contracts.
This week’s current strength score (the trader positioning range over the past three years, measured from 0 to 100) shows the speculators are currently Bearish with a score of 20.9 percent. The commercials are Bullish-Extreme with a score of 87.1 percent and the small traders (not shown in chart) are Bullish with a score of 73.1 percent.
Price Trend-Following Model: Strong Downtrend
Our weekly trend-following model classifies the current market price position as: Strong Downtrend. The current action for the model is considered to be: Hold – Maintain Short Position.
| 10-Year Treasury Note Statistics | SPECULATORS | COMMERCIALS | SMALL TRADERS |
| – Percent of Open Interest Longs: | 10.8 | 79.1 | 8.1 |
| – Percent of Open Interest Shorts: | 24.0 | 65.8 | 8.2 |
| – Net Position: | -635,137 | 636,943 | -1,806 |
| – Gross Longs: | 518,205 | 3,797,358 | 389,650 |
| – Gross Shorts: | 1,153,342 | 3,160,415 | 391,456 |
| – Long to Short Ratio: | 0.4 to 1 | 1.2 to 1 | 1.0 to 1 |
| NET POSITION TREND: | |||
| – Strength Index Score (3 Year Range Pct): | 20.9 | 87.1 | 73.1 |
| – Strength Index Reading (3 Year Range): | Bearish | Bullish-Extreme | Bullish |
| NET POSITION MOVEMENT INDEX: | |||
| – 6-Week Change in Strength Index: | 20.9 | -12.9 | -20.4 |
Ultra 10-Year Notes Futures:
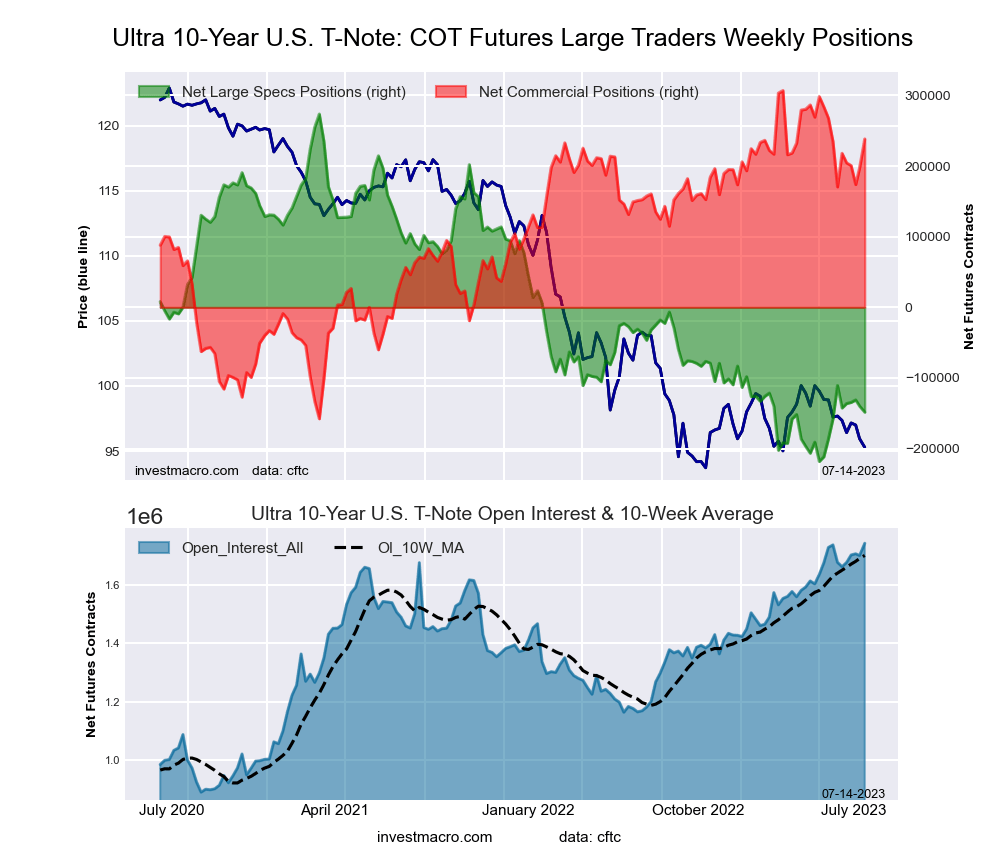 The Ultra 10-Year Notes large speculator standing this week came in at a net position of -148,473 contracts in the data reported through Tuesday. This was a weekly decline of -8,572 contracts from the previous week which had a total of -139,901 net contracts.
This week’s current strength score (the trader positioning range over the past three years, measured from 0 to 100) shows the speculators are currently Bearish-Extreme with a score of 14.2 percent. The commercials are Bullish-Extreme with a score of 85.2 percent and the small traders (not shown in chart) are Bullish with a score of 60.6 percent.
Price Trend-Following Model: Weak Uptrend
Our weekly trend-following model classifies the current market price position as: Weak Uptrend. The current action for the model is considered to be: Hold – Maintain Long Position.
| Ultra 10-Year Notes Statistics | SPECULATORS | COMMERCIALS | SMALL TRADERS |
| – Percent of Open Interest Longs: | 9.5 | 78.8 | 10.0 |
| – Percent of Open Interest Shorts: | 18.0 | 65.1 | 15.2 |
| – Net Position: | -148,473 | 238,401 | -89,928 |
| – Gross Longs: | 165,436 | 1,371,281 | 174,306 |
| – Gross Shorts: | 313,909 | 1,132,880 | 264,234 |
| – Long to Short Ratio: | 0.5 to 1 | 1.2 to 1 | 0.7 to 1 |
| NET POSITION TREND: | |||
| – Strength Index Score (3 Year Range Pct): | 14.2 | 85.2 | 60.6 |
| – Strength Index Reading (3 Year Range): | Bearish-Extreme | Bullish-Extreme | Bullish |
| NET POSITION MOVEMENT INDEX: | |||
| – 6-Week Change in Strength Index: | -7.7 | 14.6 | -17.9 |
US Treasury Bonds Futures:
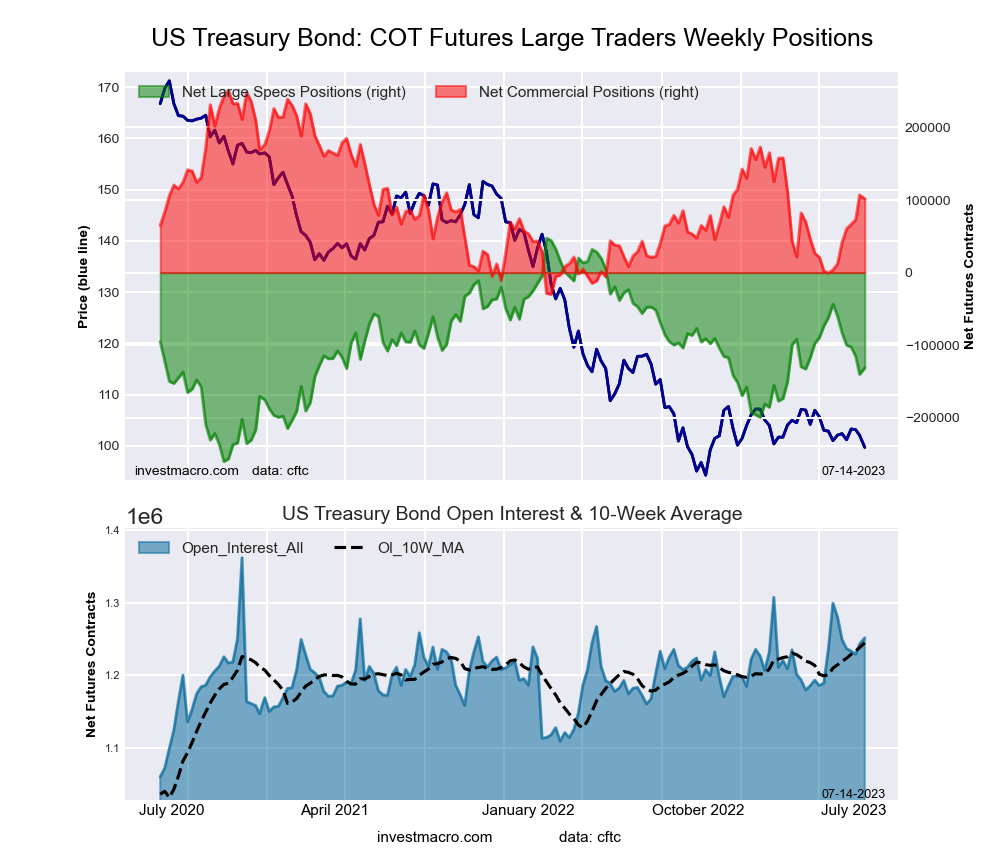 The US Treasury Bonds large speculator standing this week came in at a net position of -130,984 contracts in the data reported through Tuesday. This was a weekly boost of 8,945 contracts from the previous week which had a total of -139,929 net contracts.
This week’s current strength score (the trader positioning range over the past three years, measured from 0 to 100) shows the speculators are currently Bearish with a score of 42.0 percent. The commercials are Bearish with a score of 46.9 percent and the small traders (not shown in chart) are Bullish with a score of 69.7 percent.
Price Trend-Following Model: Downtrend
Our weekly trend-following model classifies the current market price position as: Downtrend. The current action for the model is considered to be: Hold – Maintain Short Position.
| US Treasury Bonds Statistics | SPECULATORS | COMMERCIALS | SMALL TRADERS |
| – Percent of Open Interest Longs: | 6.2 | 78.4 | 14.4 |
| – Percent of Open Interest Shorts: | 16.7 | 70.3 | 12.1 |
| – Net Position: | -130,984 | 101,678 | 29,306 |
| – Gross Longs: | 78,154 | 981,658 | 180,701 |
| – Gross Shorts: | 209,138 | 879,980 | 151,395 |
| – Long to Short Ratio: | 0.4 to 1 | 1.1 to 1 | 1.2 to 1 |
| NET POSITION TREND: | |||
| – Strength Index Score (3 Year Range Pct): | 42.0 | 46.9 | 69.7 |
| – Strength Index Reading (3 Year Range): | Bearish | Bearish | Bullish |
| NET POSITION MOVEMENT INDEX: | |||
| – 6-Week Change in Strength Index: | -23.1 | 31.9 | -13.4 |
Ultra US Treasury Bonds Futures:
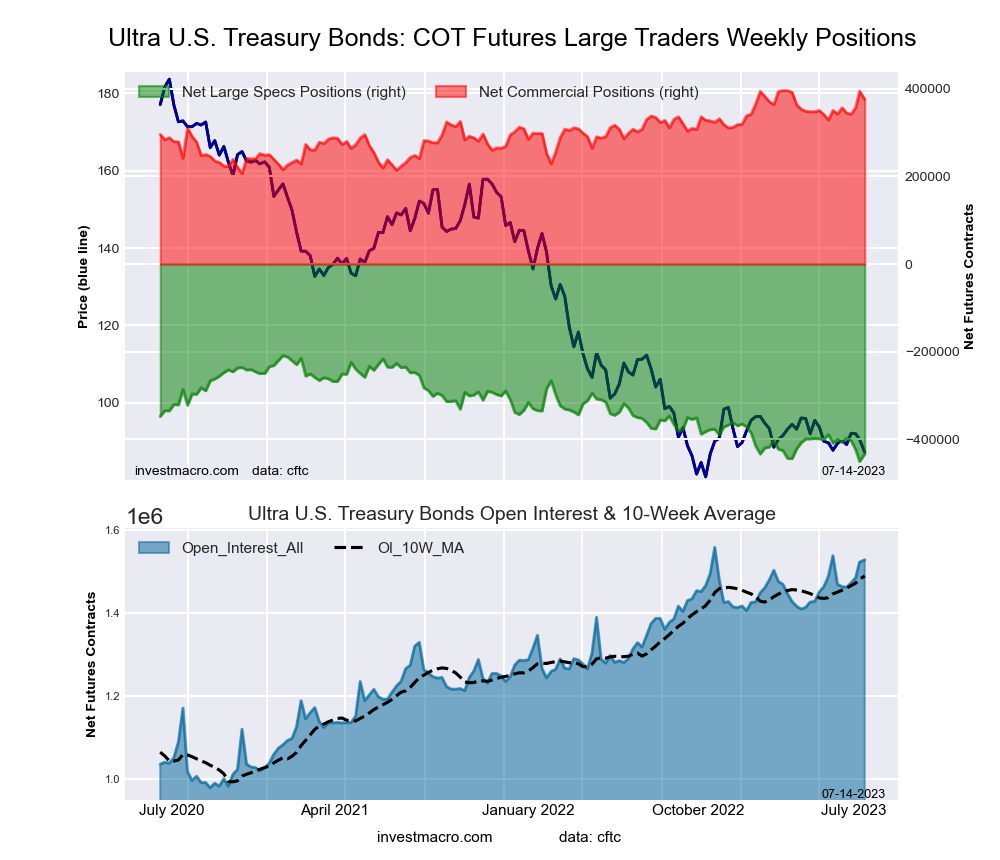 The Ultra US Treasury Bonds large speculator standing this week came in at a net position of -432,912 contracts in the data reported through Tuesday. This was a weekly advance of 17,660 contracts from the previous week which had a total of -450,572 net contracts.
This week’s current strength score (the trader positioning range over the past three years, measured from 0 to 100) shows the speculators are currently Bearish-Extreme with a score of 7.3 percent. The commercials are Bullish-Extreme with a score of 89.4 percent and the small traders (not shown in chart) are Bullish-Extreme with a score of 91.1 percent.
Price Trend-Following Model: Downtrend
Our weekly trend-following model classifies the current market price position as: Downtrend. The current action for the model is considered to be: Hold – Maintain Short Position.
| Ultra US Treasury Bonds Statistics | SPECULATORS | COMMERCIALS | SMALL TRADERS |
| – Percent of Open Interest Longs: | 5.4 | 82.8 | 11.4 |
| – Percent of Open Interest Shorts: | 33.7 | 58.2 | 7.7 |
| – Net Position: | -432,912 | 375,828 | 57,084 |
| – Gross Longs: | 82,032 | 1,264,189 | 174,380 |
| – Gross Shorts: | 514,944 | 888,361 | 117,296 |
| – Long to Short Ratio: | 0.2 to 1 | 1.4 to 1 | 1.5 to 1 |
| NET POSITION TREND: | |||
| – Strength Index Score (3 Year Range Pct): | 7.3 | 89.4 | 91.1 |
| – Strength Index Reading (3 Year Range): | Bearish-Extreme | Bullish-Extreme | Bullish-Extreme |
| NET POSITION MOVEMENT INDEX: | |||
| – 6-Week Change in Strength Index: | -13.7 | 17.7 | -0.5 |
Article By InvestMacro – Receive our weekly COT Newsletter
*COT Report: The COT data, released weekly to the public each Friday, is updated through the most recent Tuesday (data is 3 days old) and shows a quick view of how large speculators or non-commercials (for-profit traders) were positioned in the futures markets.
The CFTC categorizes trader positions according to commercial hedgers (traders who use futures contracts for hedging as part of the business), non-commercials (large traders who speculate to realize trading profits) and nonreportable traders (usually small traders/speculators) as well as their open interest (contracts open in the market at time of reporting). See CFTC criteria here.


