By InvestMacro
Here are the latest charts and statistics for the Commitment of Traders (COT) data published by the Commodities Futures Trading Commission (CFTC).
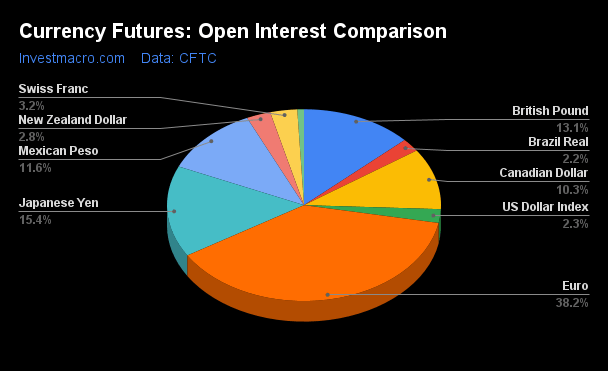
The latest COT data is updated through Tuesday October 3rd and shows a quick view of how large market participants (for-profit speculators and commercial traders) were positioned in the futures markets. All currency positions are in direct relation to the US dollar where, for example, a bet for the euro is a bet that the euro will rise versus the dollar while a bet against the euro will be a bet that the euro will decline versus the dollar.
Weekly Speculator Changes led by New Zealand Dollar & Australian Dollar
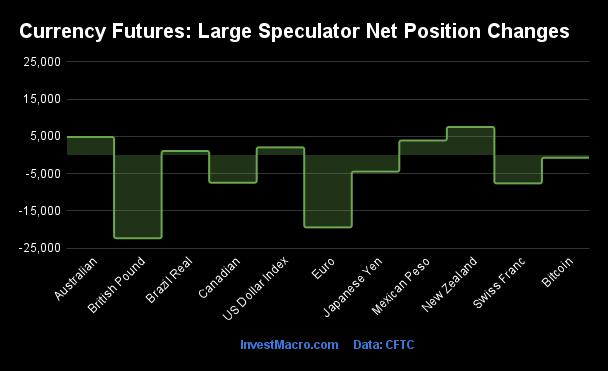
The COT currency market speculator bets were lower this week as five out of the eleven currency markets we cover had higher positioning while the other six markets had lower speculator contracts.
Leading the gains for the currency markets was the New Zealand Dollar (7,531 contracts) with the Australian Dollar (4,828 contracts), Mexican Peso (3,881 contracts), US Dollar Index (2,057 contracts) and the Brazilian Real (1,079 contracts) also showing positive weeks.
The currencies seeing declines in speculator bets on the week were the British Pound (-22,349 contracts) with the EuroFX (-19,456 contracts), the Swiss Franc (-7,627 contracts), the Canadian Dollar (-7,455 contracts), the Japanese Yen (-4,476 contracts) and Bitcoin (-738 contracts) also registering lower bets on the week.
Spotlight: Large Currency Traders continue to pare Euro Bullish Bets to 49-Week Low
Highlighting the COT currency’s data this week is the continued weakness in the Euro Currency speculator positioning. Large speculative Euro positions fell sharply this week by over -19,000 contracts and dropped for a seventh consecutive week. Euro weekly positions have now declined in ten out of the past eleven weeks with a total decline of -99,889 contracts over these past eleven weeks.
This rapid cooling of the speculator bets has now taken the net position from a total of +178,832 contracts on July 18th to a total of +78,943 contracts through Tuesday. This brings the current level to the lowest standing in the past 49-weeks, dating back to October 25th of 2022.
Helping put a dampener on the Euro speculative position has been the likely end of the European Central Bank’s (ECB) rate hiking activity. The ECB recently raised their interest rate in September for a 10th straight meeting to 4 percent. However, the market expectation is that the rate hiking campaign is over for now which combined with subdued growth in the Eurozone puts a limited expectation for strength in the currency.
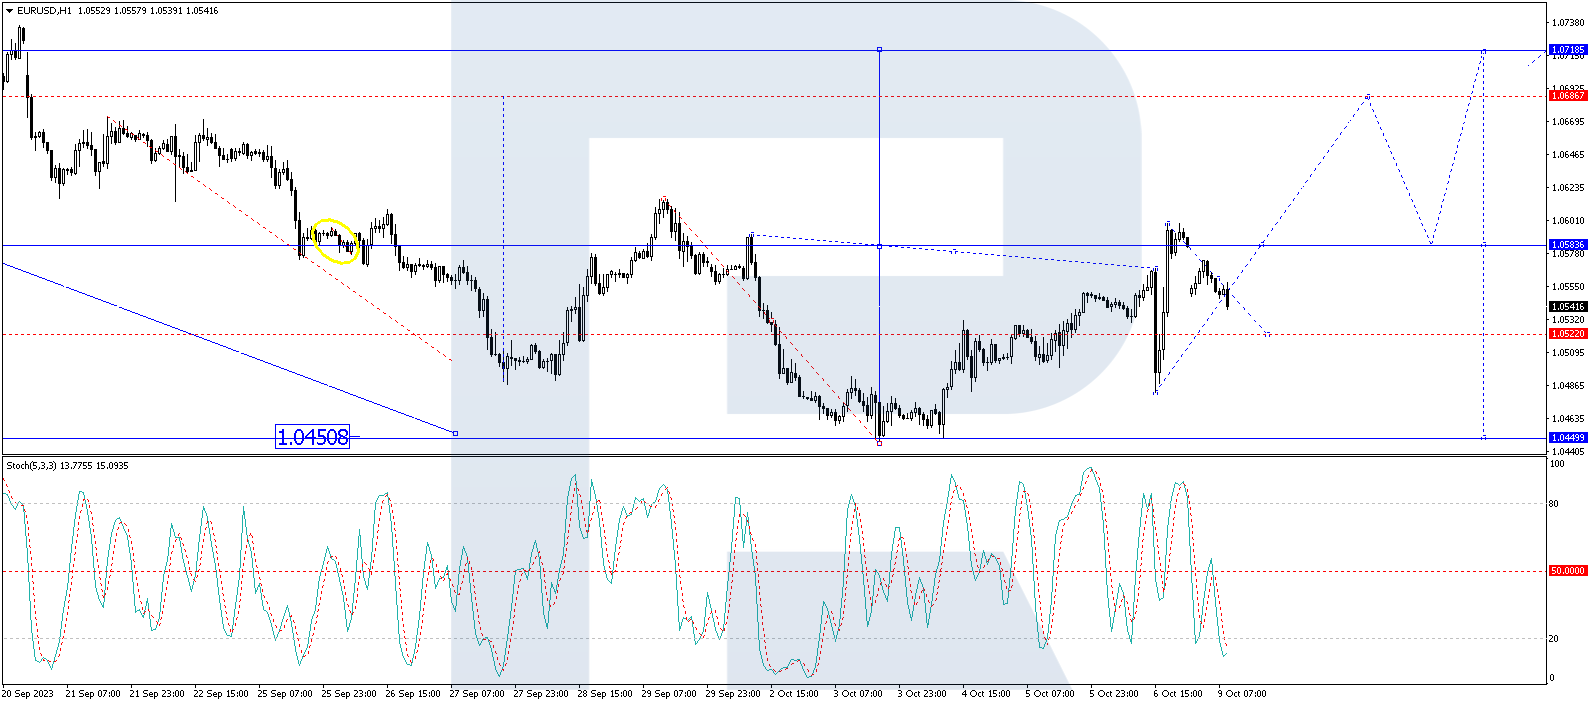
The Euro currency (EURUSD) spot price (vesus the US Dollar), however, did manage to eke out a small gain this week after falling for eleven straight weeks and touching the lowest level of the year under 1.0500. The EURUSD rebounded off the psychological level of 1.0500 this week and saw gains on Wednesday, Thursday and Friday to close the week right near the 1.0625 exchange rate.
| Oct-03-2023 | OI | OI-Index | Spec-Net | Spec-Index | Com-Net | COM-Index | Smalls-Net | Smalls-Index |
|---|
| USD Index | 42,340 | 41 | 18,815 | 56 | -20,166 | 44 | 1,351 | 22 |
| EUR | 702,433 | 39 | 78,943 | 54 | -104,752 | 50 | 25,809 | 20 |
| GBP | 241,045 | 62 | -6,680 | 51 | 17,545 | 56 | -10,865 | 37 |
| JPY | 282,682 | 98 | -113,988 | 2 | 117,869 | 93 | -3,881 | 46 |
| CHF | 58,673 | 100 | -16,742 | 11 | 27,368 | 89 | -10,626 | 23 |
| CAD | 189,443 | 53 | -40,151 | 17 | 38,581 | 82 | 1,570 | 26 |
| AUD | 207,782 | 64 | -81,987 | 14 | 97,266 | 90 | -15,279 | 15 |
| NZD | 52,291 | 62 | -7,650 | 35 | 10,717 | 69 | -3,067 | 13 |
| MXN | 212,539 | 42 | 64,514 | 79 | -67,248 | 21 | 2,734 | 29 |
| RUB | 20,930 | 4 | 7,543 | 31 | -7,150 | 69 | -393 | 24 |
| BRL | 41,033 | 27 | 16,637 | 57 | -17,643 | 43 | 1,006 | 44 |
| Bitcoin | 14,447 | 65 | 1,056 | 82 | -1,475 | 0 | 419 | 22 |
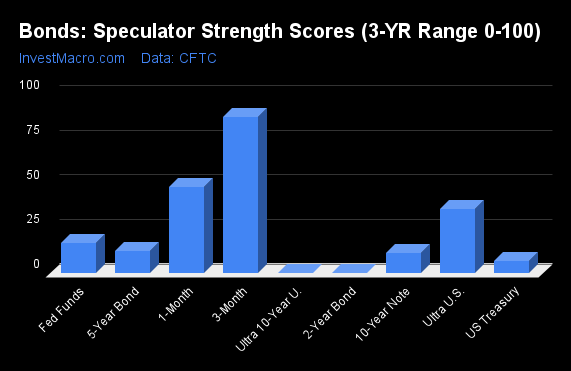
Strength Scores led by Bitcoin & Mexican Peso
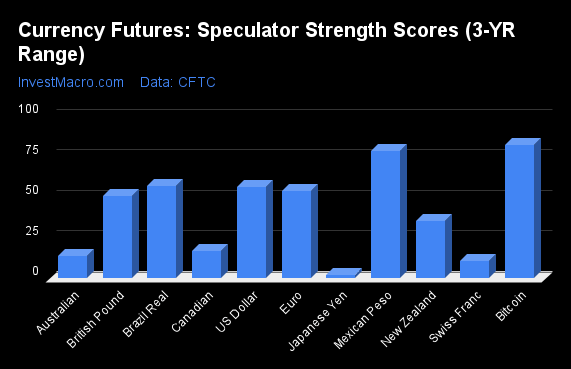
COT Strength Scores (a normalized measure of Speculator positions over a 3-Year range, from 0 to 100 where above 80 is Extreme-Bullish and below 20 is Extreme-Bearish) showed that the Bitcoin (82 percent) and the Mexican Peso (79 percent) currently lead the currency markets this week. The Brazilian Real (57 percent), the US Dollar Index (56 percent) and the EuroFX (54 percent) come in as the next highest in the weekly strength scores.
On the downside, the Japanese Yen (2 percent), the Swiss Franc (11 percent), the Australian Dollar (14 percent) and the Canadian Dollar (17 percent) come in at the lowest strength levels and are in Extreme-Bearish territory (below 20 percent).
Strength Statistics:
US Dollar Index (56.3 percent) vs US Dollar Index previous week (52.9 percent)
EuroFX (53.9 percent) vs EuroFX previous week (62.2 percent)
British Pound Sterling (51.1 percent) vs British Pound Sterling previous week (66.6 percent)
Japanese Yen (2.3 percent) vs Japanese Yen previous week (5.0 percent)
Swiss Franc (10.7 percent) vs Swiss Franc previous week (31.6 percent)
Canadian Dollar (17.1 percent) vs Canadian Dollar previous week (24.1 percent)
Australian Dollar (13.7 percent) vs Australian Dollar previous week (9.3 percent)
New Zealand Dollar (35.5 percent) vs New Zealand Dollar previous week (15.9 percent)
Mexican Peso (78.5 percent) vs Mexican Peso previous week (76.1 percent)
Brazilian Real (57.0 percent) vs Brazilian Real previous week (55.6 percent)
Bitcoin (82.3 percent) vs Bitcoin previous week (93.4 percent)
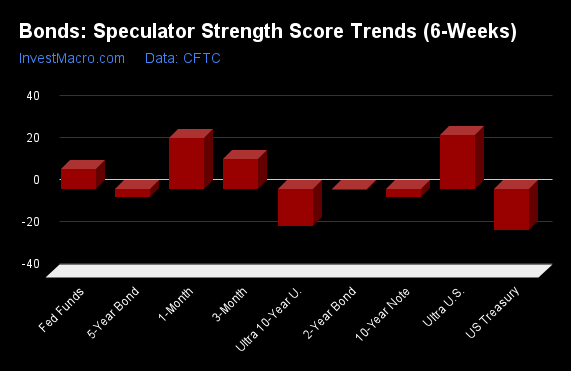
US Dollar Index & Brazilian Real top the 6-Week Strength Trends
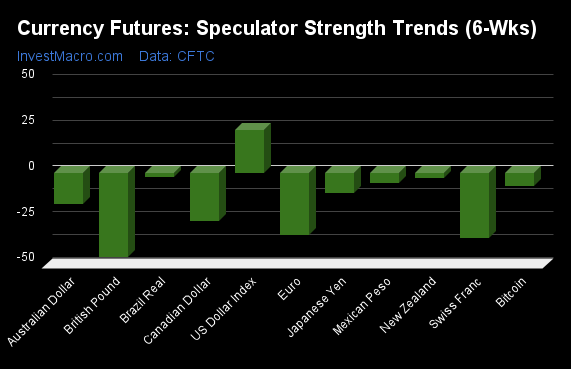
COT Strength Score Trends (or move index, calculates the 6-week changes in strength scores) showed that the US Dollar Index (24 percent) leads the past six weeks trends for the currencies and is the only currency with a positive 6-week trend.
The British Pound (-46 percent) leads the downside trend scores with the Swiss Franc (-35 percent), EuroFX (-34 percent) and the Canadian Dollar (-26 percent) following.
Strength Trend Statistics:
US Dollar Index (23.7 percent) vs US Dollar Index previous week (19.6 percent)
EuroFX (-34.0 percent) vs EuroFX previous week (-26.2 percent)
British Pound Sterling (-45.7 percent) vs British Pound Sterling previous week (-24.5 percent)
Japanese Yen (-11.1 percent) vs Japanese Yen previous week (-17.0 percent)
Swiss Franc (-35.3 percent) vs Swiss Franc previous week (-14.0 percent)
Canadian Dollar (-26.2 percent) vs Canadian Dollar previous week (-19.8 percent)
Australian Dollar (-16.7 percent) vs Australian Dollar previous week (-30.6 percent)
New Zealand Dollar (-3.0 percent) vs New Zealand Dollar previous week (-33.2 percent)
Mexican Peso (-5.6 percent) vs Mexican Peso previous week (-13.1 percent)
Brazilian Real (-2.0 percent) vs Brazilian Real previous week (-10.1 percent)
Bitcoin (-6.9 percent) vs Bitcoin previous week (37.7 percent)
Individual COT Forex Markets:
US Dollar Index Futures:
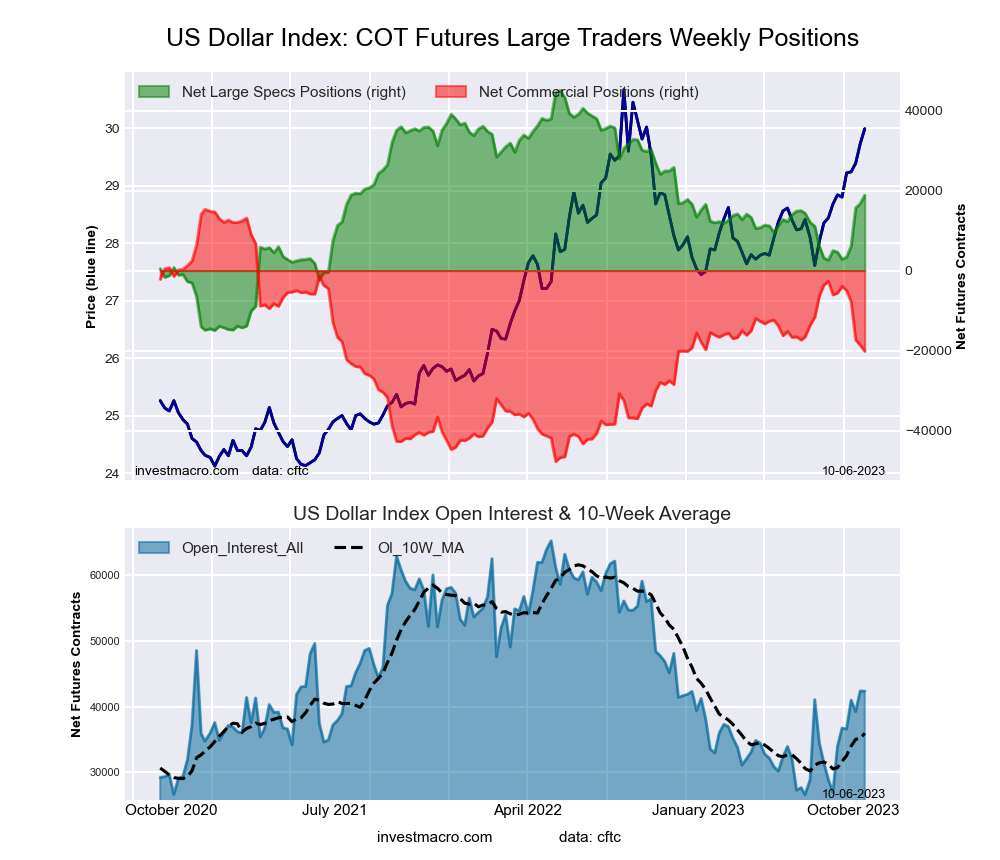 The US Dollar Index large speculator standing this week recorded a net position of 18,815 contracts in the data reported through Tuesday. This was a weekly advance of 2,057 contracts from the previous week which had a total of 16,758 net contracts.
This week’s current strength score (the trader positioning range over the past three years, measured from 0 to 100) shows the speculators are currently Bullish with a score of 56.3 percent. The commercials are Bearish with a score of 43.7 percent and the small traders (not shown in chart) are Bearish with a score of 22.0 percent.
Price Trend-Following Model: Strong Uptrend
Our weekly trend-following model classifies the current market price position as: Strong Uptrend. The current action for the model is considered to be: Hold – Maintain Long Position.
| US DOLLAR INDEX Statistics | SPECULATORS | COMMERCIALS | SMALL TRADERS |
| – Percent of Open Interest Longs: | 66.3 | 19.6 | 10.7 |
| – Percent of Open Interest Shorts: | 21.8 | 67.3 | 7.5 |
| – Net Position: | 18,815 | -20,166 | 1,351 |
| – Gross Longs: | 28,057 | 8,313 | 4,530 |
| – Gross Shorts: | 9,242 | 28,479 | 3,179 |
| – Long to Short Ratio: | 3.0 to 1 | 0.3 to 1 | 1.4 to 1 |
| NET POSITION TREND: | | | |
| – Strength Index Score (3 Year Range Pct): | 56.3 | 43.7 | 22.0 |
| – Strength Index Reading (3 Year Range): | Bullish | Bearish | Bearish |
| NET POSITION MOVEMENT INDEX: | | | |
| – 6-Week Change in Strength Index: | 23.7 | -23.1 | 4.0 |
Euro Currency Futures:
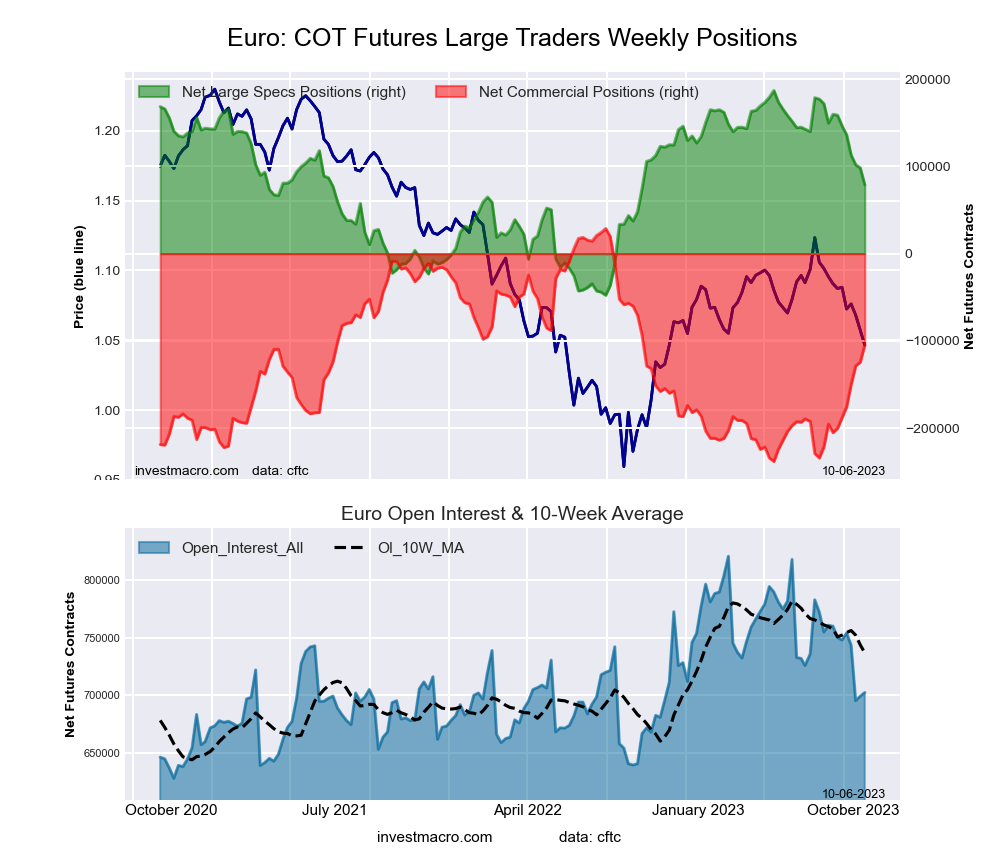 The Euro Currency large speculator standing this week recorded a net position of 78,943 contracts in the data reported through Tuesday. This was a weekly fall of -19,456 contracts from the previous week which had a total of 98,399 net contracts.
This week’s current strength score (the trader positioning range over the past three years, measured from 0 to 100) shows the speculators are currently Bullish with a score of 53.9 percent. The commercials are Bearish with a score of 50.0 percent and the small traders (not shown in chart) are Bearish with a score of 20.2 percent.
Price Trend-Following Model: Strong Downtrend
Our weekly trend-following model classifies the current market price position as: Strong Downtrend. The current action for the model is considered to be: Hold – Maintain Short Position.
| EURO Currency Statistics | SPECULATORS | COMMERCIALS | SMALL TRADERS |
| – Percent of Open Interest Longs: | 30.1 | 55.3 | 11.7 |
| – Percent of Open Interest Shorts: | 18.9 | 70.2 | 8.1 |
| – Net Position: | 78,943 | -104,752 | 25,809 |
| – Gross Longs: | 211,783 | 388,473 | 82,432 |
| – Gross Shorts: | 132,840 | 493,225 | 56,623 |
| – Long to Short Ratio: | 1.6 to 1 | 0.8 to 1 | 1.5 to 1 |
| NET POSITION TREND: | | | |
| – Strength Index Score (3 Year Range Pct): | 53.9 | 50.0 | 20.2 |
| – Strength Index Reading (3 Year Range): | Bullish | Bearish | Bearish |
| NET POSITION MOVEMENT INDEX: | | | |
| – 6-Week Change in Strength Index: | -34.0 | 35.8 | -25.2 |
British Pound Sterling Futures:
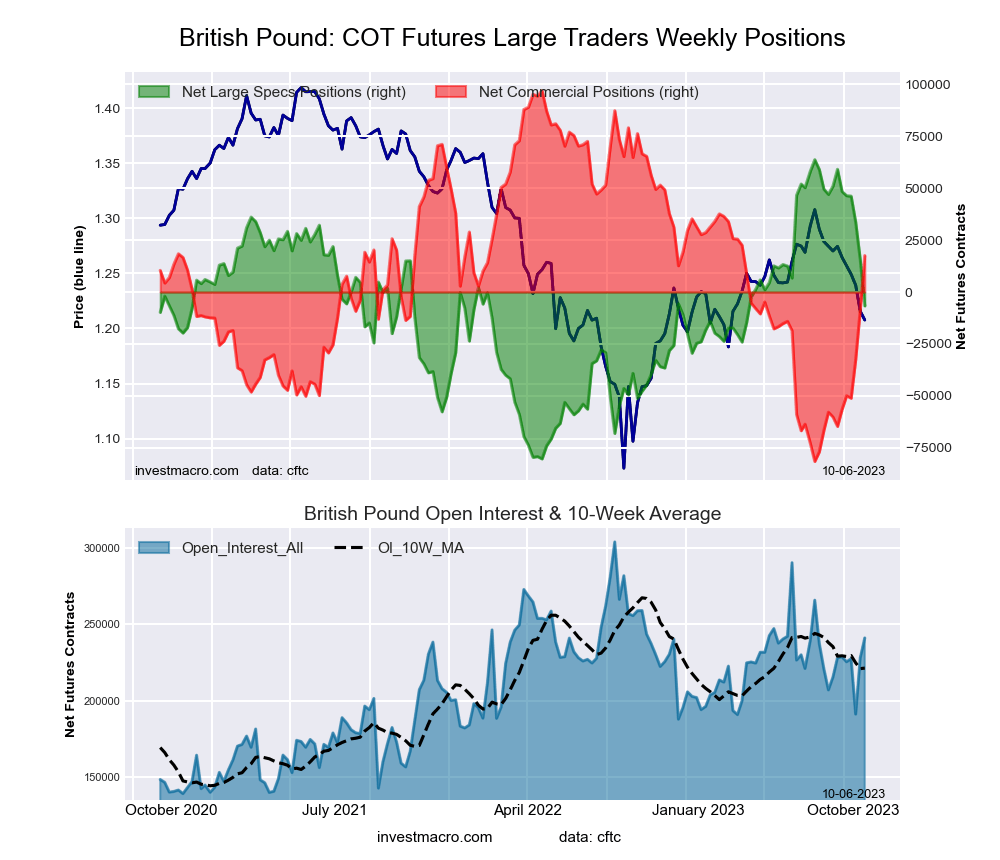 The British Pound Sterling large speculator standing this week recorded a net position of -6,680 contracts in the data reported through Tuesday. This was a weekly reduction of -22,349 contracts from the previous week which had a total of 15,669 net contracts.
This week’s current strength score (the trader positioning range over the past three years, measured from 0 to 100) shows the speculators are currently Bullish with a score of 51.1 percent. The commercials are Bullish with a score of 55.5 percent and the small traders (not shown in chart) are Bearish with a score of 36.7 percent.
Price Trend-Following Model: Strong Downtrend
Our weekly trend-following model classifies the current market price position as: Strong Downtrend. The current action for the model is considered to be: Hold – Maintain Short Position.
| BRITISH POUND Statistics | SPECULATORS | COMMERCIALS | SMALL TRADERS |
| – Percent of Open Interest Longs: | 30.7 | 56.3 | 10.2 |
| – Percent of Open Interest Shorts: | 33.4 | 49.0 | 14.7 |
| – Net Position: | -6,680 | 17,545 | -10,865 |
| – Gross Longs: | 73,911 | 135,637 | 24,678 |
| – Gross Shorts: | 80,591 | 118,092 | 35,543 |
| – Long to Short Ratio: | 0.9 to 1 | 1.1 to 1 | 0.7 to 1 |
| NET POSITION TREND: | | | |
| – Strength Index Score (3 Year Range Pct): | 51.1 | 55.5 | 36.7 |
| – Strength Index Reading (3 Year Range): | Bullish | Bullish | Bearish |
| NET POSITION MOVEMENT INDEX: | | | |
| – 6-Week Change in Strength Index: | -45.7 | 46.1 | -32.3 |
Japanese Yen Futures:
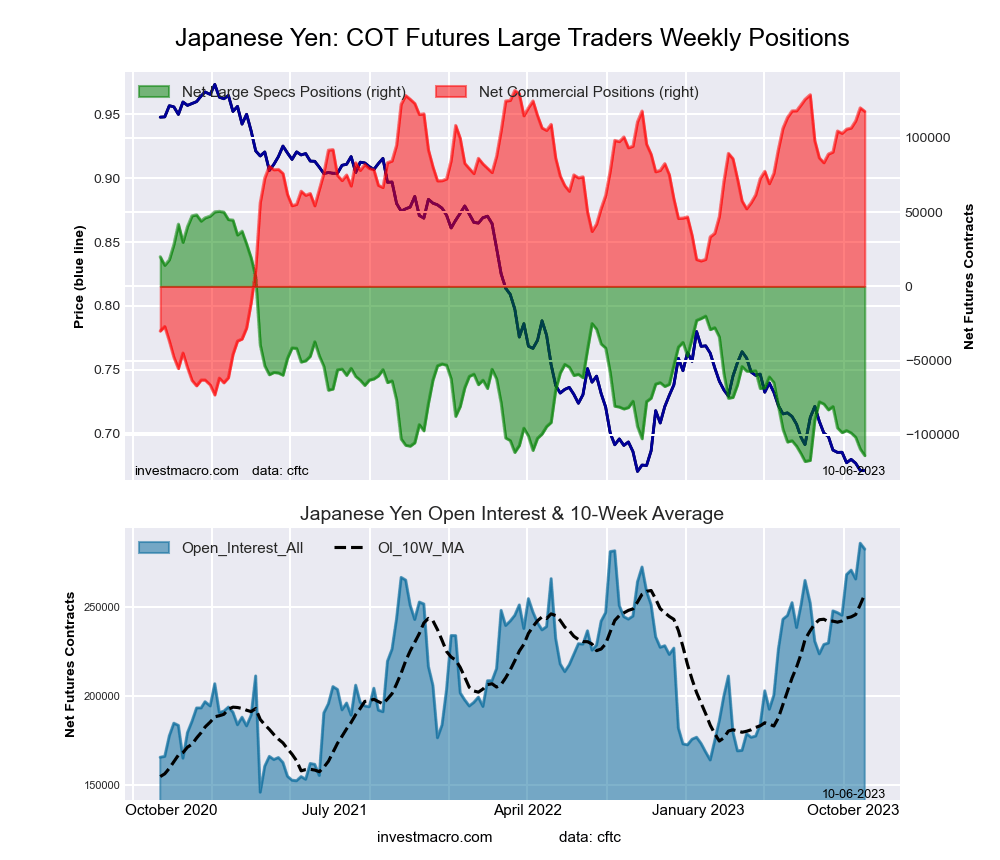 The Japanese Yen large speculator standing this week recorded a net position of -113,988 contracts in the data reported through Tuesday. This was a weekly fall of -4,476 contracts from the previous week which had a total of -109,512 net contracts.
This week’s current strength score (the trader positioning range over the past three years, measured from 0 to 100) shows the speculators are currently Bearish-Extreme with a score of 2.3 percent. The commercials are Bullish-Extreme with a score of 93.2 percent and the small traders (not shown in chart) are Bearish with a score of 45.6 percent.
Price Trend-Following Model: Strong Downtrend
Our weekly trend-following model classifies the current market price position as: Strong Downtrend. The current action for the model is considered to be: Hold – Maintain Short Position.
| JAPANESE YEN Statistics | SPECULATORS | COMMERCIALS | SMALL TRADERS |
| – Percent of Open Interest Longs: | 16.8 | 68.7 | 13.4 |
| – Percent of Open Interest Shorts: | 57.1 | 27.0 | 14.7 |
| – Net Position: | -113,988 | 117,869 | -3,881 |
| – Gross Longs: | 47,544 | 194,193 | 37,744 |
| – Gross Shorts: | 161,532 | 76,324 | 41,625 |
| – Long to Short Ratio: | 0.3 to 1 | 2.5 to 1 | 0.9 to 1 |
| NET POSITION TREND: | | | |
| – Strength Index Score (3 Year Range Pct): | 2.3 | 93.2 | 45.6 |
| – Strength Index Reading (3 Year Range): | Bearish-Extreme | Bullish-Extreme | Bearish |
| NET POSITION MOVEMENT INDEX: | | | |
| – 6-Week Change in Strength Index: | -11.1 | 6.5 | 11.0 |
Swiss Franc Futures:
 The Swiss Franc large speculator standing this week recorded a net position of -16,742 contracts in the data reported through Tuesday. This was a weekly fall of -7,627 contracts from the previous week which had a total of -9,115 net contracts.
This week’s current strength score (the trader positioning range over the past three years, measured from 0 to 100) shows the speculators are currently Bearish-Extreme with a score of 10.7 percent. The commercials are Bullish-Extreme with a score of 89.1 percent and the small traders (not shown in chart) are Bearish with a score of 22.9 percent.
Price Trend-Following Model: Strong Downtrend
Our weekly trend-following model classifies the current market price position as: Strong Downtrend. The current action for the model is considered to be: New Sell – Short Position.
| SWISS FRANC Statistics | SPECULATORS | COMMERCIALS | SMALL TRADERS |
| – Percent of Open Interest Longs: | 19.0 | 65.6 | 15.4 |
| – Percent of Open Interest Shorts: | 47.5 | 18.9 | 33.5 |
| – Net Position: | -16,742 | 27,368 | -10,626 |
| – Gross Longs: | 11,143 | 38,468 | 9,030 |
| – Gross Shorts: | 27,885 | 11,100 | 19,656 |
| – Long to Short Ratio: | 0.4 to 1 | 3.5 to 1 | 0.5 to 1 |
| NET POSITION TREND: | | | |
| – Strength Index Score (3 Year Range Pct): | 10.7 | 89.1 | 22.9 |
| – Strength Index Reading (3 Year Range): | Bearish-Extreme | Bullish-Extreme | Bearish |
| NET POSITION MOVEMENT INDEX: | | | |
| – 6-Week Change in Strength Index: | -35.3 | 39.4 | -32.0 |
Canadian Dollar Futures:
 The Canadian Dollar large speculator standing this week recorded a net position of -40,151 contracts in the data reported through Tuesday. This was a weekly decline of -7,455 contracts from the previous week which had a total of -32,696 net contracts.
This week’s current strength score (the trader positioning range over the past three years, measured from 0 to 100) shows the speculators are currently Bearish-Extreme with a score of 17.1 percent. The commercials are Bullish-Extreme with a score of 82.4 percent and the small traders (not shown in chart) are Bearish with a score of 26.3 percent.
Price Trend-Following Model: Strong Downtrend
Our weekly trend-following model classifies the current market price position as: Strong Downtrend. The current action for the model is considered to be: Hold – Maintain Short Position.
| CANADIAN DOLLAR Statistics | SPECULATORS | COMMERCIALS | SMALL TRADERS |
| – Percent of Open Interest Longs: | 11.4 | 67.3 | 19.5 |
| – Percent of Open Interest Shorts: | 32.6 | 46.9 | 18.6 |
| – Net Position: | -40,151 | 38,581 | 1,570 |
| – Gross Longs: | 21,674 | 127,502 | 36,889 |
| – Gross Shorts: | 61,825 | 88,921 | 35,319 |
| – Long to Short Ratio: | 0.4 to 1 | 1.4 to 1 | 1.0 to 1 |
| NET POSITION TREND: | | | |
| – Strength Index Score (3 Year Range Pct): | 17.1 | 82.4 | 26.3 |
| – Strength Index Reading (3 Year Range): | Bearish-Extreme | Bullish-Extreme | Bearish |
| NET POSITION MOVEMENT INDEX: | | | |
| – 6-Week Change in Strength Index: | -26.2 | 15.3 | 12.5 |
Australian Dollar Futures:
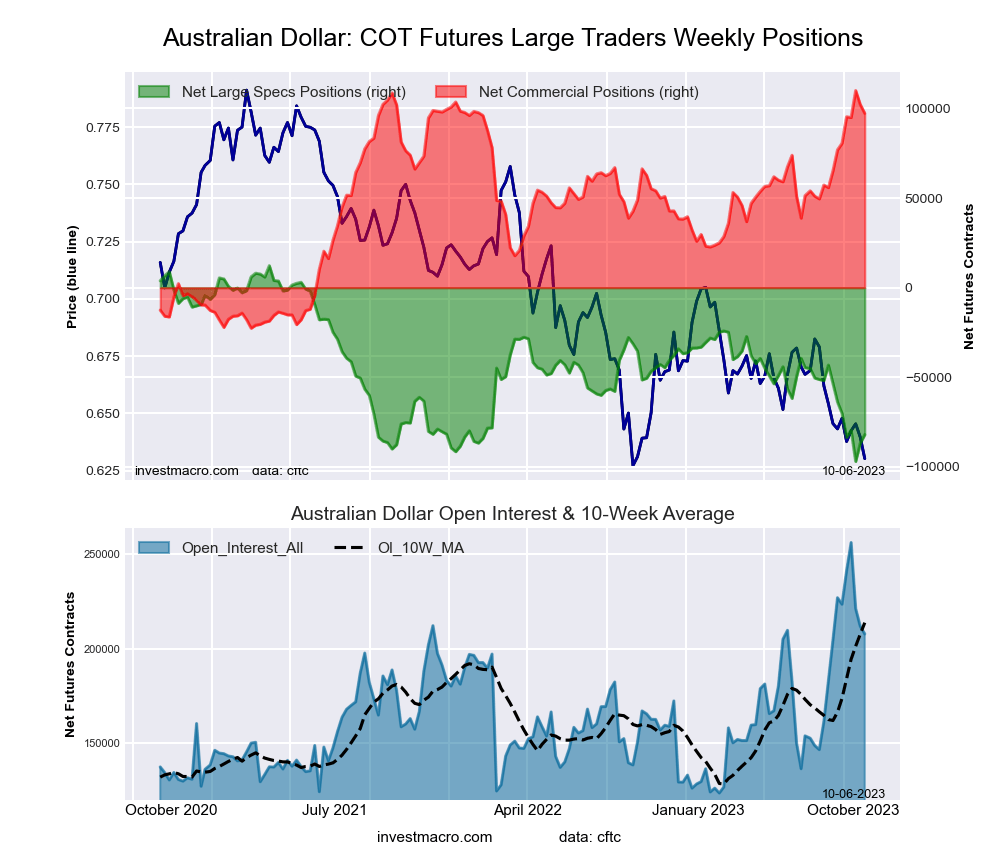 The Australian Dollar large speculator standing this week recorded a net position of -81,987 contracts in the data reported through Tuesday. This was a weekly lift of 4,828 contracts from the previous week which had a total of -86,815 net contracts.
This week’s current strength score (the trader positioning range over the past three years, measured from 0 to 100) shows the speculators are currently Bearish-Extreme with a score of 13.7 percent. The commercials are Bullish-Extreme with a score of 90.4 percent and the small traders (not shown in chart) are Bearish-Extreme with a score of 15.2 percent.
Price Trend-Following Model: Strong Downtrend
Our weekly trend-following model classifies the current market price position as: Strong Downtrend. The current action for the model is considered to be: Hold – Maintain Short Position.
| AUSTRALIAN DOLLAR Statistics | SPECULATORS | COMMERCIALS | SMALL TRADERS |
| – Percent of Open Interest Longs: | 19.0 | 68.6 | 10.0 |
| – Percent of Open Interest Shorts: | 58.5 | 21.8 | 17.3 |
| – Net Position: | -81,987 | 97,266 | -15,279 |
| – Gross Longs: | 39,465 | 142,572 | 20,690 |
| – Gross Shorts: | 121,452 | 45,306 | 35,969 |
| – Long to Short Ratio: | 0.3 to 1 | 3.1 to 1 | 0.6 to 1 |
| NET POSITION TREND: | | | |
| – Strength Index Score (3 Year Range Pct): | 13.7 | 90.4 | 15.2 |
| – Strength Index Reading (3 Year Range): | Bearish-Extreme | Bullish-Extreme | Bearish-Extreme |
| NET POSITION MOVEMENT INDEX: | | | |
| – 6-Week Change in Strength Index: | -16.7 | 15.4 | -5.3 |
New Zealand Dollar Futures:
 The New Zealand Dollar large speculator standing this week recorded a net position of -7,650 contracts in the data reported through Tuesday. This was a weekly increase of 7,531 contracts from the previous week which had a total of -15,181 net contracts.
This week’s current strength score (the trader positioning range over the past three years, measured from 0 to 100) shows the speculators are currently Bearish with a score of 35.5 percent. The commercials are Bullish with a score of 69.1 percent and the small traders (not shown in chart) are Bearish-Extreme with a score of 13.5 percent.
Price Trend-Following Model: Downtrend
Our weekly trend-following model classifies the current market price position as: Downtrend. The current action for the model is considered to be: Hold – Maintain Short Position.
| NEW ZEALAND DOLLAR Statistics | SPECULATORS | COMMERCIALS | SMALL TRADERS |
| – Percent of Open Interest Longs: | 30.4 | 64.4 | 4.8 |
| – Percent of Open Interest Shorts: | 45.0 | 43.9 | 10.6 |
| – Net Position: | -7,650 | 10,717 | -3,067 |
| – Gross Longs: | 15,895 | 33,651 | 2,497 |
| – Gross Shorts: | 23,545 | 22,934 | 5,564 |
| – Long to Short Ratio: | 0.7 to 1 | 1.5 to 1 | 0.4 to 1 |
| NET POSITION TREND: | | | |
| – Strength Index Score (3 Year Range Pct): | 35.5 | 69.1 | 13.5 |
| – Strength Index Reading (3 Year Range): | Bearish | Bullish | Bearish-Extreme |
| NET POSITION MOVEMENT INDEX: | | | |
| – 6-Week Change in Strength Index: | -3.0 | 3.4 | -4.3 |
Mexican Peso Futures:
 The Mexican Peso large speculator standing this week recorded a net position of 64,514 contracts in the data reported through Tuesday. This was a weekly advance of 3,881 contracts from the previous week which had a total of 60,633 net contracts.
This week’s current strength score (the trader positioning range over the past three years, measured from 0 to 100) shows the speculators are currently Bullish with a score of 78.5 percent. The commercials are Bearish with a score of 21.3 percent and the small traders (not shown in chart) are Bearish with a score of 28.6 percent.
Price Trend-Following Model: Strong Downtrend
Our weekly trend-following model classifies the current market price position as: Strong Downtrend. The current action for the model is considered to be: New Sell – Short Position.
| MEXICAN PESO Statistics | SPECULATORS | COMMERCIALS | SMALL TRADERS |
| – Percent of Open Interest Longs: | 42.7 | 53.7 | 2.8 |
| – Percent of Open Interest Shorts: | 12.4 | 85.4 | 1.5 |
| – Net Position: | 64,514 | -67,248 | 2,734 |
| – Gross Longs: | 90,848 | 114,185 | 5,986 |
| – Gross Shorts: | 26,334 | 181,433 | 3,252 |
| – Long to Short Ratio: | 3.4 to 1 | 0.6 to 1 | 1.8 to 1 |
| NET POSITION TREND: | | | |
| – Strength Index Score (3 Year Range Pct): | 78.5 | 21.3 | 28.6 |
| – Strength Index Reading (3 Year Range): | Bullish | Bearish | Bearish |
| NET POSITION MOVEMENT INDEX: | | | |
| – 6-Week Change in Strength Index: | -5.6 | 5.4 | -0.2 |
Brazilian Real Futures:
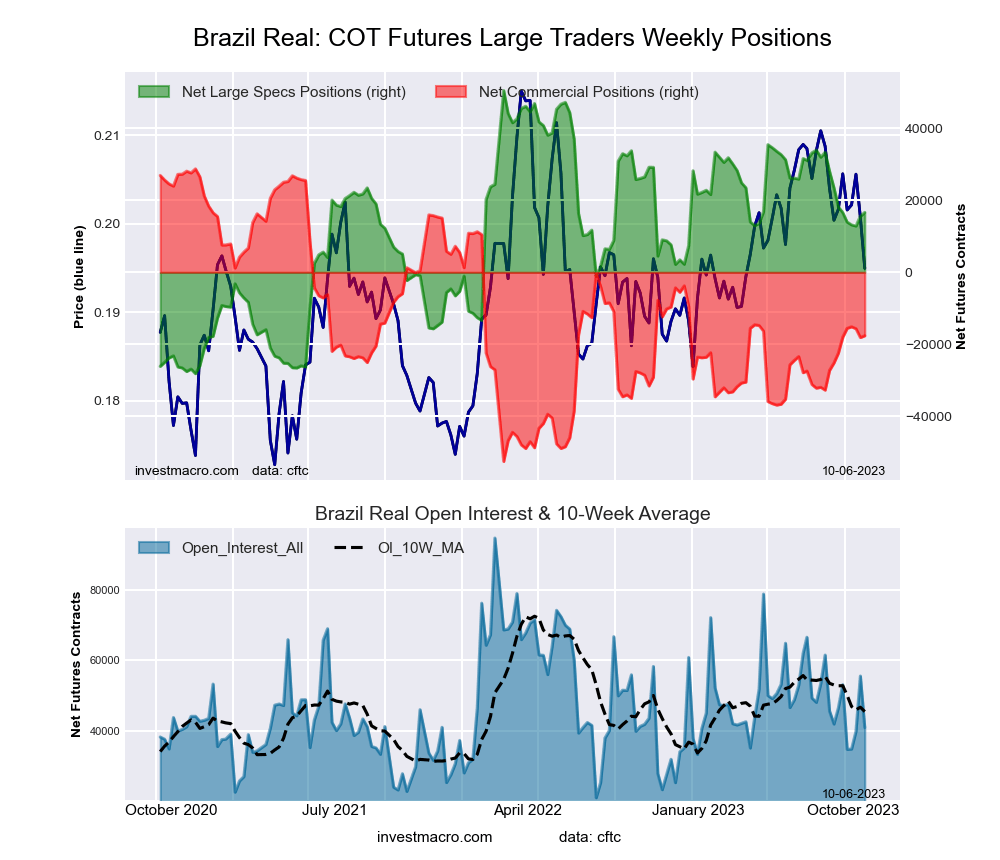 The Brazilian Real large speculator standing this week recorded a net position of 16,637 contracts in the data reported through Tuesday. This was a weekly boost of 1,079 contracts from the previous week which had a total of 15,558 net contracts.
This week’s current strength score (the trader positioning range over the past three years, measured from 0 to 100) shows the speculators are currently Bullish with a score of 57.0 percent. The commercials are Bearish with a score of 43.0 percent and the small traders (not shown in chart) are Bearish with a score of 43.8 percent.
Price Trend-Following Model: Strong Downtrend
Our weekly trend-following model classifies the current market price position as: Strong Downtrend. The current action for the model is considered to be: Hold – Maintain Short Position.
| BRAZIL REAL Statistics | SPECULATORS | COMMERCIALS | SMALL TRADERS |
| – Percent of Open Interest Longs: | 61.0 | 31.9 | 7.0 |
| – Percent of Open Interest Shorts: | 20.5 | 74.9 | 4.6 |
| – Net Position: | 16,637 | -17,643 | 1,006 |
| – Gross Longs: | 25,029 | 13,086 | 2,888 |
| – Gross Shorts: | 8,392 | 30,729 | 1,882 |
| – Long to Short Ratio: | 3.0 to 1 | 0.4 to 1 | 1.5 to 1 |
| NET POSITION TREND: | | | |
| – Strength Index Score (3 Year Range Pct): | 57.0 | 43.0 | 43.8 |
| – Strength Index Reading (3 Year Range): | Bullish | Bearish | Bearish |
| NET POSITION MOVEMENT INDEX: | | | |
| – 6-Week Change in Strength Index: | -2.0 | 6.0 | -31.0 |
Bitcoin Futures:
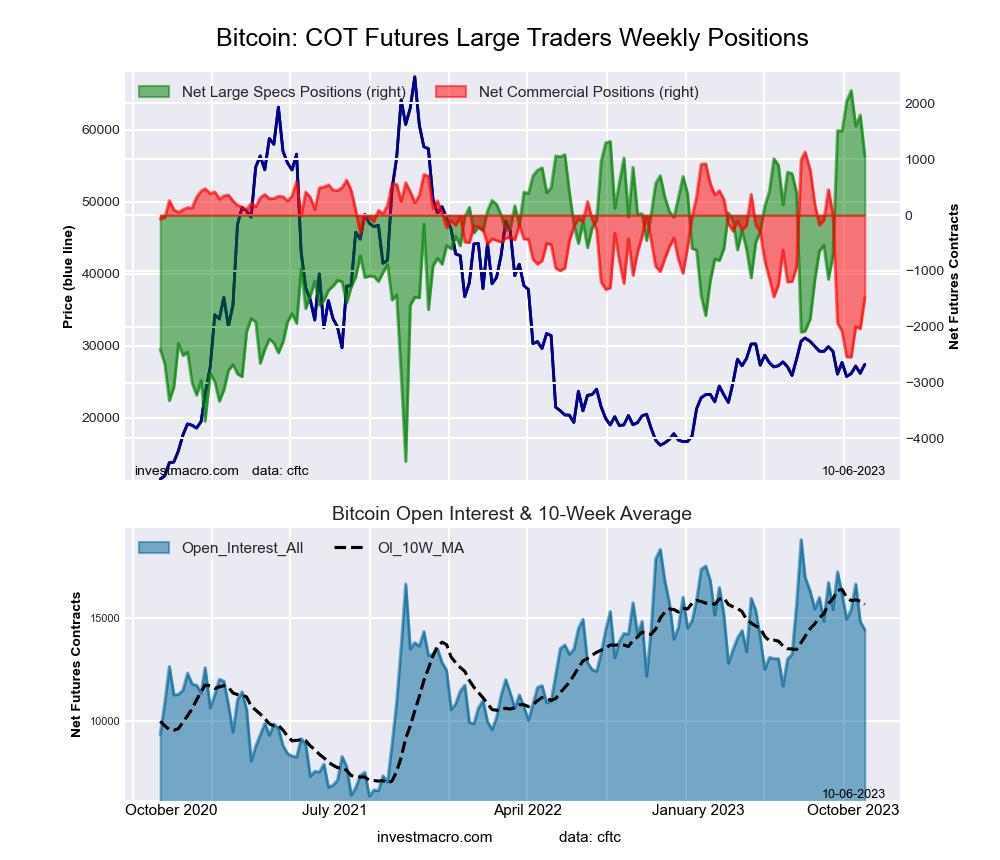 The Bitcoin large speculator standing this week recorded a net position of 1,056 contracts in the data reported through Tuesday. This was a weekly reduction of -738 contracts from the previous week which had a total of 1,794 net contracts.
This week’s current strength score (the trader positioning range over the past three years, measured from 0 to 100) shows the speculators are currently Bullish-Extreme with a score of 82.3 percent. The commercials are Bearish with a score of 29.1 percent and the small traders (not shown in chart) are Bearish with a score of 22.5 percent.
Price Trend-Following Model: Weak Downtrend
Our weekly trend-following model classifies the current market price position as: Weak Downtrend. The current action for the model is considered to be: Hold – Maintain Short Position.
| BITCOIN Statistics | SPECULATORS | COMMERCIALS | SMALL TRADERS |
| – Percent of Open Interest Longs: | 82.8 | 1.1 | 8.3 |
| – Percent of Open Interest Shorts: | 75.5 | 11.3 | 5.4 |
| – Net Position: | 1,056 | -1,475 | 419 |
| – Gross Longs: | 11,964 | 161 | 1,195 |
| – Gross Shorts: | 10,908 | 1,636 | 776 |
| – Long to Short Ratio: | 1.1 to 1 | 0.1 to 1 | 1.5 to 1 |
| NET POSITION TREND: | | | |
| – Strength Index Score (3 Year Range Pct): | 82.3 | 29.1 | 22.5 |
| – Strength Index Reading (3 Year Range): | Bullish-Extreme | Bearish | Bearish |
| NET POSITION MOVEMENT INDEX: | | | |
| – 6-Week Change in Strength Index: | -6.9 | 12.4 | 0.1 |
Article By InvestMacro – Receive our weekly COT Newsletter
*COT Report: The COT data, released weekly to the public each Friday, is updated through the most recent Tuesday (data is 3 days old) and shows a quick view of how large speculators or non-commercials (for-profit traders) were positioned in the futures markets.
The CFTC categorizes trader positions according to commercial hedgers (traders who use futures contracts for hedging as part of the business), non-commercials (large traders who speculate to realize trading profits) and nonreportable traders (usually small traders/speculators) as well as their open interest (contracts open in the market at time of reporting). See CFTC criteria here.


.png)


