Source: Ron Struthers (12/12/23)
Investment in copper mining is very low at a time when it should be at record highs to accommodate electrification of world economies. Ron Struthers of Struthers Resource Stock Report looks into three promising copper exploration plays and a pure producer, Capstone.
For a long time, copper has been described with a PhD in economics. It is tied so much to all industries that its demand cycles can mirror economic cycles.
As most of the world seeks to reach net-zero targets and transition to cleaner, renewable forms of energy, copper is a big requirement. However, the amount of copper needed to successfully facilitate the energy transition is staggering. Nearly 70% of all copper produced is used in electrical applications, which is why it’s so important to the energy transition.
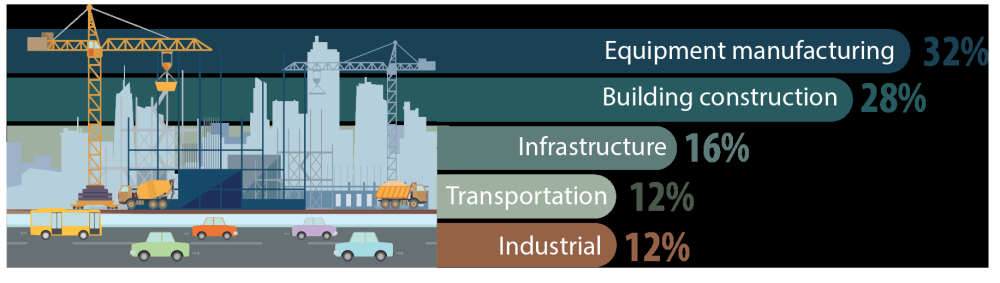
While the average internal combustion engine vehicle contains approximately 48 pounds of copper, a typical EV contains nearly four times that amount. Solar Technology uses about 5.5 tons copper/MW of electricity and wind about 4 tons/MW onshore and 10 tons/MW offshore.
Jerome Leroy, vice president of the Canadian business unit of cable supplier Nexans, worries that copper mines won’t be able to keep up. This concern partly stems from the fact it takes many years to secure regulatory approvals for new mines. Moreover, ore grades at existing mines have long been in decline. (Production is concentrated in Chile, Peru, and China.) Mr. Leroy points to forecasts suggesting production capacity will grow to 27 million tonnes a year by the end of this decade, whereas demand could rise as high as 35 million tonnes. A shortfall could materialize as soon as next year, he warns.
“I start to see it happening at the power utility level,” he said. “People are requesting more and more cable. The likes of BC Hydro and Hydro-Québec, and others, say that probably they will need at least 5% more cable every year starting from now.”
Blair DeBruyne, the director of operations, inventory, and fleet services at SaskPower, points out that copper is a major ingredient in transformer coils and almost every power line. But he’s worried about all mined materials because order lead times are being pushed out.
Last year, IHS Markit (a market research firm owned by S&P Global) projected that copper demand could double in little more than a decade — from 25 million tonnes today to 50 million by 2035.
“The chronic gap between worldwide copper supply and demand projected to begin in the middle of this decade will have serious consequences across the global economy,” an IHS report warned, “and will affect the timing of net-zero emissions by 2050.”
Demand for copper in energy transition applications is expected to climb about 8.2% over the next decade, outstripping a projected 2.9% increase in copper demand in that period for traditional uses such as construction, infrastructure, machinery, and transportation, said Mohsen Bonakdarpour, executive director of economics & country risk for Market Intelligence.
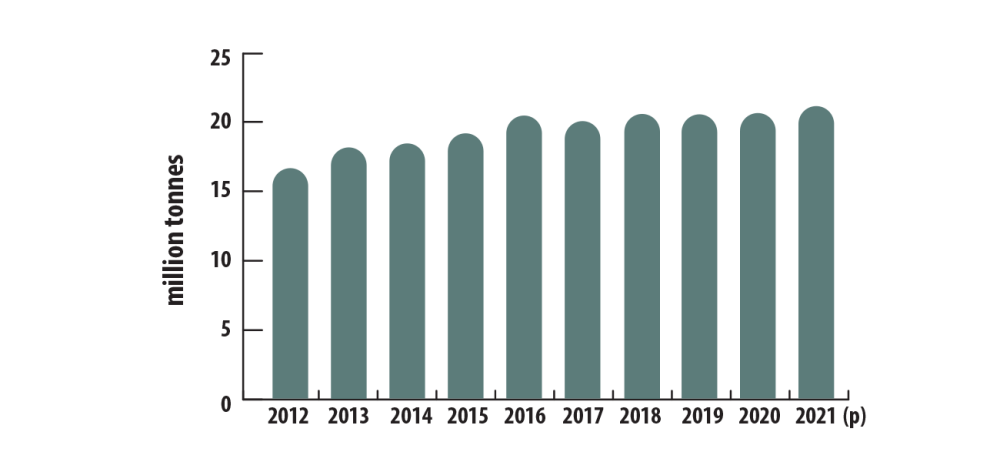
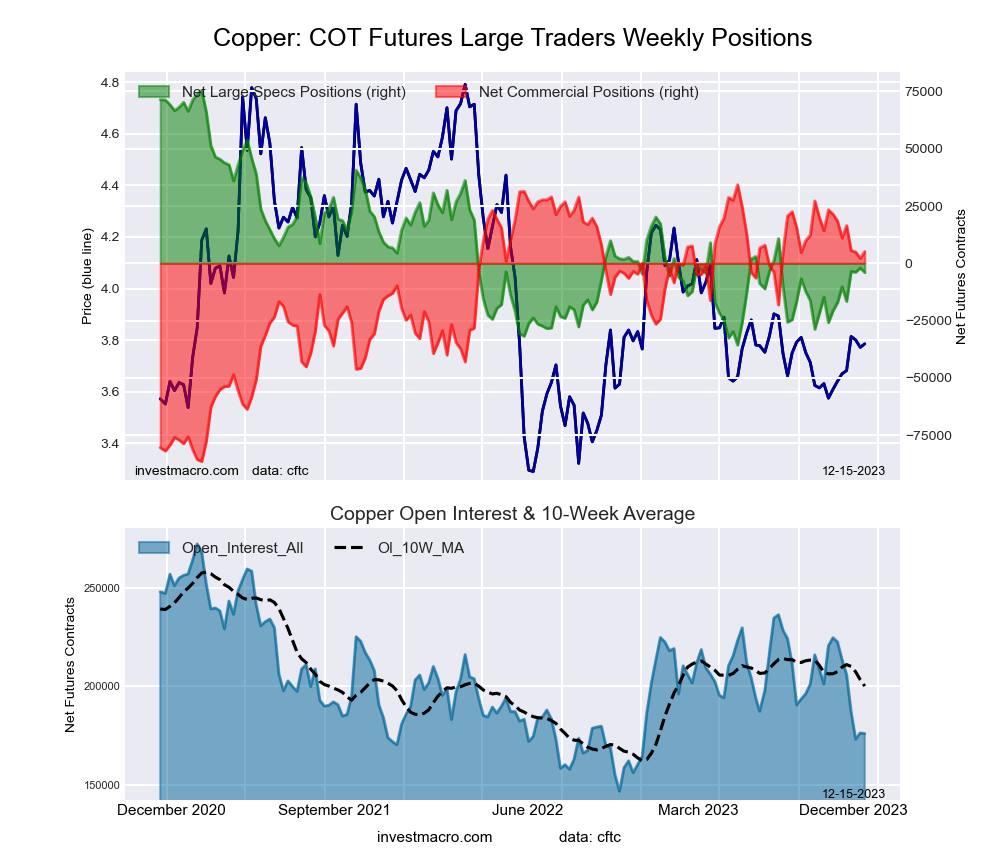
My take — I am not as bullish as many on the speed to electrification and EVs, but if demand even grows at half of the projections, there will be shortages. You see, the problem is really on the supply side, mainly because of years of underinvestment in mining. The chart below on copper production shows that growth has been flat since 2016.
The global copper industry needs to spend more than $100 billion to build mines able to close what could be an annual supply deficit of 4.7 million tonnes by 2030, Erik Heimlich, head of base metals supply at CRU, said in 2022.
The supply gap for the next decade is estimated at six million tonnes per year as the clean energy and electric vehicles sectors ramp up. This means the world would need to build eight projects the size of BHP’s (ASX: BHP) Escondido in Chile, the world’s largest copper mine, over the next eight years.
Such task, Heimlich said, seems questionable.
“Many of the projects currently developed have been in the making for almost three decades, and with exploration activity relatively limited in recent years, supply increases may fade from 2025,” experts at BoA said.
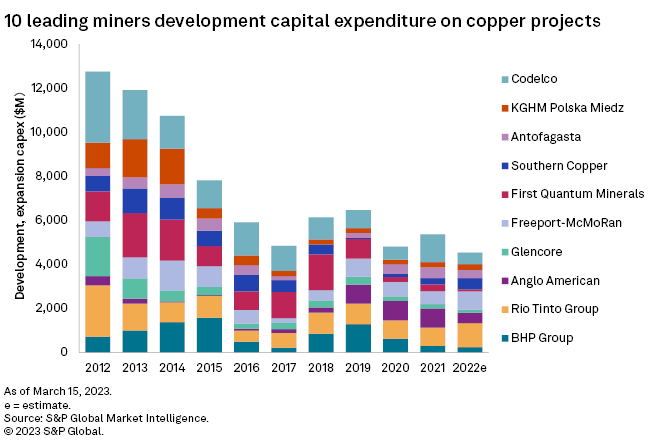
Global development and expansion capital for primary copper mines peaked in 2013 at $26.13 billion, almost halved in subsequent years, and has not recovered since.
Capital spending on copper projects is estimated to have been only $14.42 billion in 2022, based on Mine Economics’ universe of coverage. A further decrease of 18.7% is projected for 2023. This chart is just the top 10 companies.
Mine expansion activities rose in 2021, with some major announcements in Chile, Indonesia, and Mongolia that will add 3 million tonnes (mt) over the next four years. Most miners continue to allocate a major portion of the budget to the expansion of existing mines, while the root share was 34% in 2021.
Over the last decade, there have been 19 major grass root discoveries, but only three in the past five years, adding just 5.6mt to the total production. Latin America (LatAm) remains the top region in terms of total discoveries; however, over the past decade, new supplies have come more from Africa and Asia. In particular, between 2012 and 2021, around 56% of the top 10 discovered deposits were added by the Kamoa-Kakula deposit in the Democratic Republic of the Congo in 2014 and the Onto deposit in Indonesia in 2013.
Catch 22 — The Climate Activists Want to Electrify and Go Green but Don’t Want New Copper Mines — Dah!
The changes in LatAm royalty taxes add to the regulatory uncertainty prevailing in the region. The Chilean government is considering a modified version of a 2021 bill to impose a 1% sales tax for copper companies producing less than 200 kilotonnes per annum (ktpa) and up to 3% for companies with output exceeding 200ktpa.
However, companies producing under 50ktpa are exempted from this tax. Similarly, tax changes and local community protests in Peru have impacted production from major mines in the region. This is likely to impact the new project pipeline over the coming years.
Freshwater usage is another major concern for copper mines, especially in Chile, Peru, and the southwest United States. Peru has been rocked by protests since former President Pedro Castillo was ousted in December 2022 in an impeachment trial. The South American nation accounts for 10% of the global copper supply.
Shares in First Quantum Minerals Ltd. (FM:TSX; FQM:LSE) have dropped a whopping 2/3rds (66%) since opposition to a mining contract on their massive copper mine went viral in Panama.
The mine is about 1/2 their copper production, so the stock might be getting oversold.
Let’s see where it bottoms.
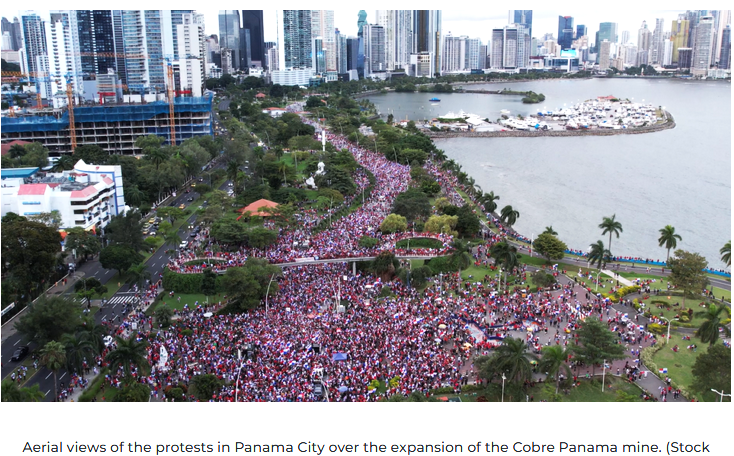
Their contract deal gave the company the right to mine the site for at least the next two decades in exchange for US$375 million a year to the government. It has become a flashpoint for local protesters. That opposition has escalated into broader anti-government protests that officials say are costing Panama US$80 million a day.
The mine faces legal and constitutional challenges from the country’s top court, and citizens may get a chance to vote on the contract extension in a referendum next month. Because of the blockade, Quantum announced on November 23 that they suspended production at the mine.
No Way Supply Will Meet Demand
There is no way that supply will ramp up enough to meet rising demand, even if demand increases are half of what is expected. Bringing new mines on stream is becoming more difficult with regulation and climate activists.
The major mining companies are mostly focused on expanding and improving profits at their existing mines. The two main results are higher copper prices, which will likely go to new highs, and a huge focus on junior copper explorers. Not by investors yet, but the majors who are watching these like hawks will be jumping on discoveries and promising projects.
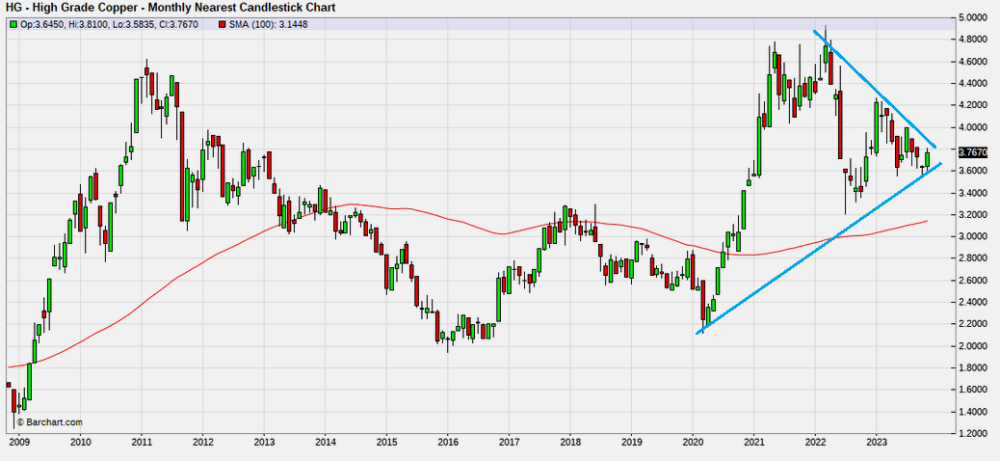
First, a long-term chart on copper. Prices have not gone crazy, but the 2011 highs were tested in 2021 and 2022. Since then, a wedge pattern has developed. A breakout will occur, and I would bet to the upside.
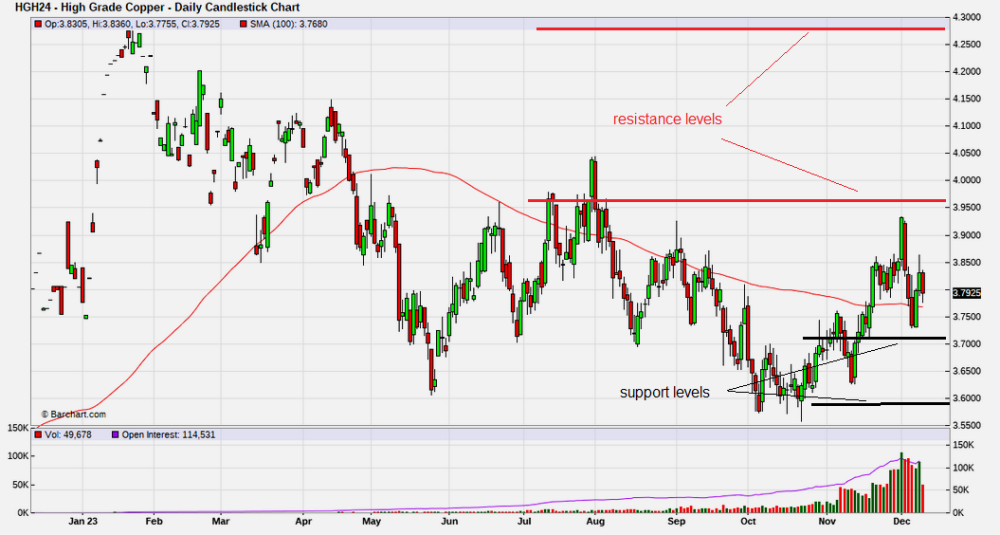
Next chart, short term on the next page, the recent move up and then back was a test of resistance and support levels.
There are virtually no pure copper producer plays, but perhaps one and the big copper producers also produce other base metals, so they are nowhere near a pure copper investment. One option is the junior copper explorers, and I will highlight three of my favorites before I touch on the best pure producer play.
Midnight Sun Mining Corp. (MMA:TSX.V; MDNGF:OTCQB)
Recent Price: $0.20
Midnight Sun has done a lot of exploration work on their Solwezi mineral exploration licenses in Zambia that are located directly adjacent to the largest copper mine in Africa — Once again, First Quantum Minerals’ Kansanshi copper/gold mine.
Midnight Sun has a copper discovery there and needs further work to prove it.
With Midnight Sun, it is all about location.
The Zambian-Congo copper belt is host to some of the world’s richest mines, with operators that include Barrick, Rio Tinto, Glencore, Ivanhoe Mines, and First Quantum and a lot of them surround MMA.
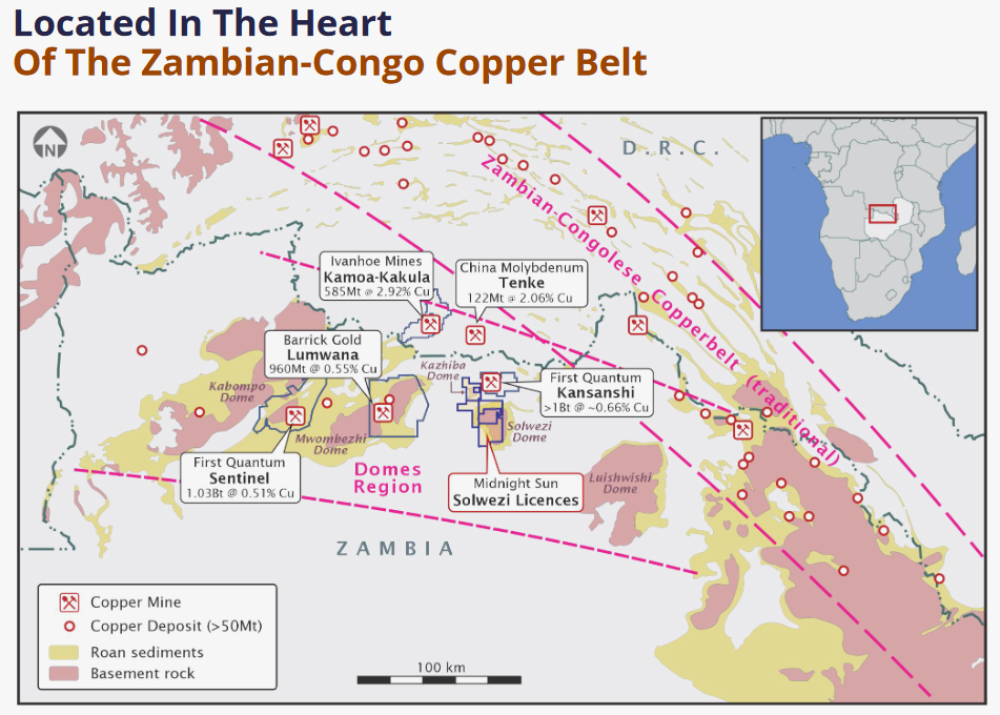
This graphic shows a better closeup.
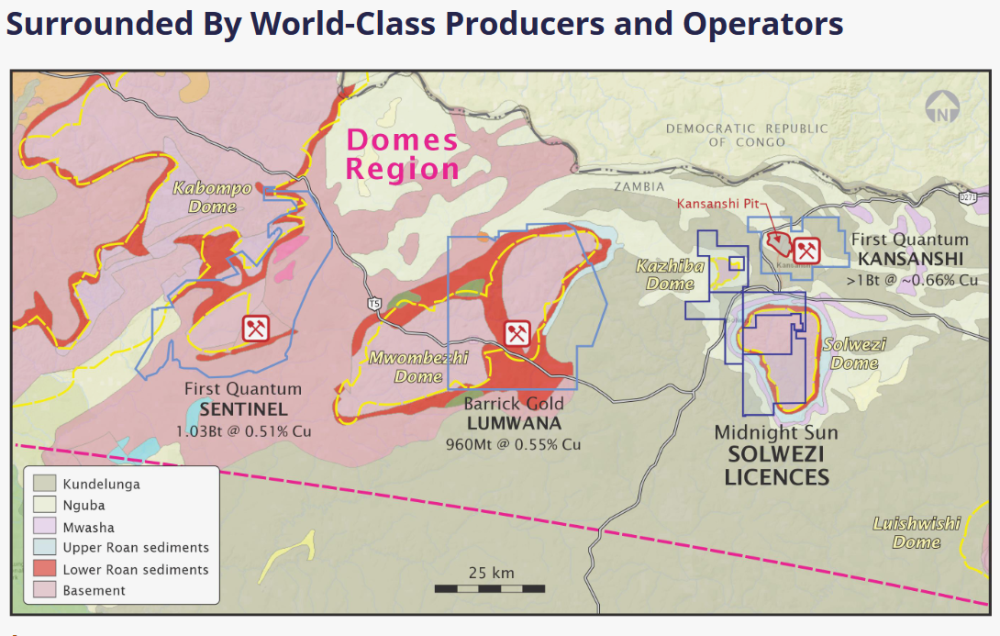
MMA has four main targets: Dumbwa, Kazhiba Dome, Mitu Trend, and Crunch Zone.
Dumbwa is a continuous high-grade copper-in-soil anomaly for over 20 km along strike and about 1 km wide with peak values up to 0.728% copper.
Kazhiba Dome has multiple high-grade hits in the 22 zones, with the discovery hole running 11.3 meters and grading 5.71% copper. Other intercepts include 21 meters of 3.26% copper and 6.4 meters of 5.08% copper.
The Mitu Trend shows a similar style of mineralization as the Sentinel Mine with associated cobalt and nickel. Drill hits include 11.6 meters of 3.44% copper and 11.5 meters of 1.41% copper.
The Crunch Zone has a newly identified structural target with a largely untested VTEM conductive anomaly. It occurs on the same stratigraphy as First Quanum’s Kanasanshi Mine.
MMA has a large 506 sq km property and already has two high grade discoveries. They are in the right place and have caught the attention of the major miners. I expect we will see some type of JV deal on one or more of their target areas and/or some more great results in the next drill program.
They have 118 million shares out, and at $0.20, the market cap is just around CA$24 million, which is quite cheap for their location and discovery. The company is run by CEO Al Fabbro, whom I have known for many years and who made good returns on his last deal, RoxGold.
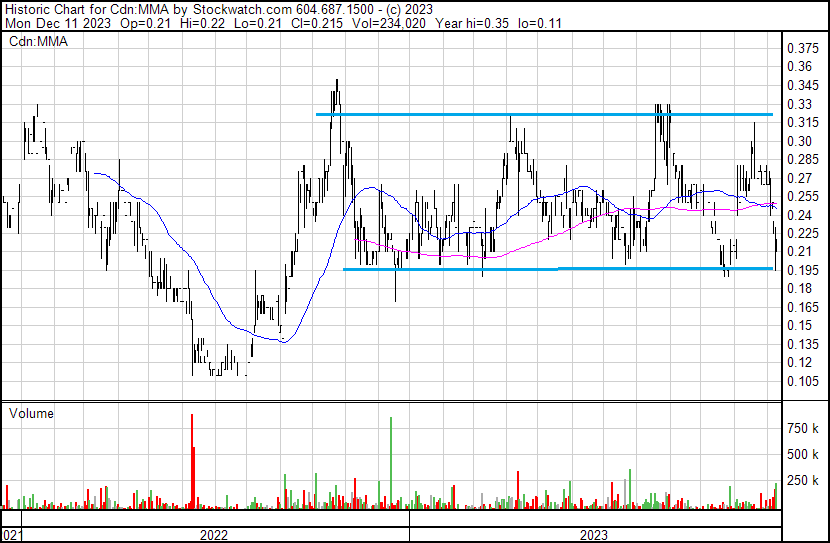
The stock bottomed in 2022 with the correction in copper prices. Since then, it recovered but has been stuck in a range between $0.20 and $0.32. It is a good buy here at the bottom of this range.
Zonte Metals Inc. (ZON:TSX.V)
Recent Price: $0.08
Zonte is in a great location as well, miner-friendly NFLD Canada. Year-round road access, high voltage power at the one end of the property, and near tidewater at the other end.
There has been a gold rush there with New Found Gold Corp.’s (NFG:TSX.V; NFGC:NYSE.American) high-grade discovery at their Queensway project.
There has not been much copper exploration, although NFLD was the world’s 4th largest copper producer back in the WW2 era. However, I think this will soon change as Zonte has discovered a grassroots new copper district, an Iron Oxide Copper Gold (IOCG) system.
These can produce huge mines, and Zonte has done a lot of tedious work over the past several years and has discovered 12 priority targets so far. I expect multiple mines could be discovered.
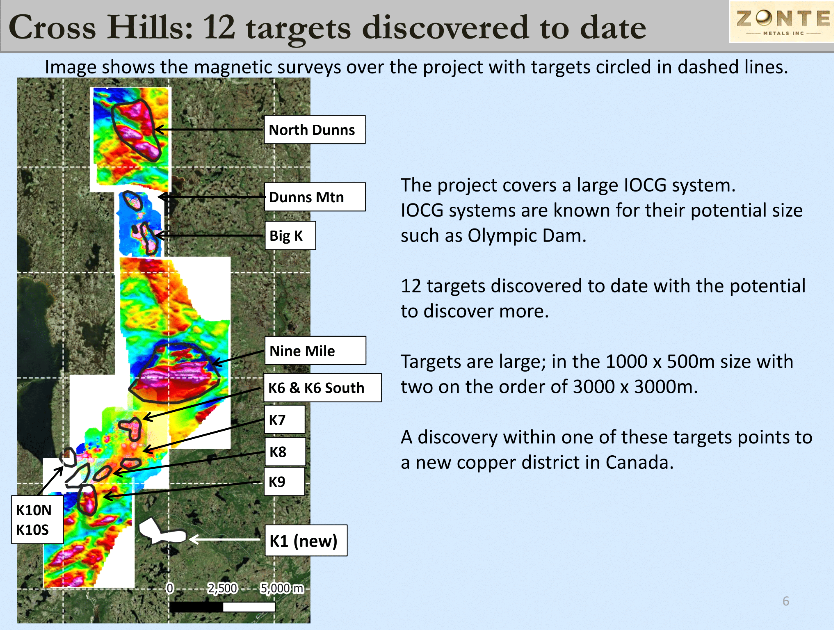
Zonte did some drilling, testing magnetic and gravity highs, and from this, learned that potential deposits are likely adjacent to these anomaly highs. Their soil sampling and rock sampling in the last two years appear to confirm this.
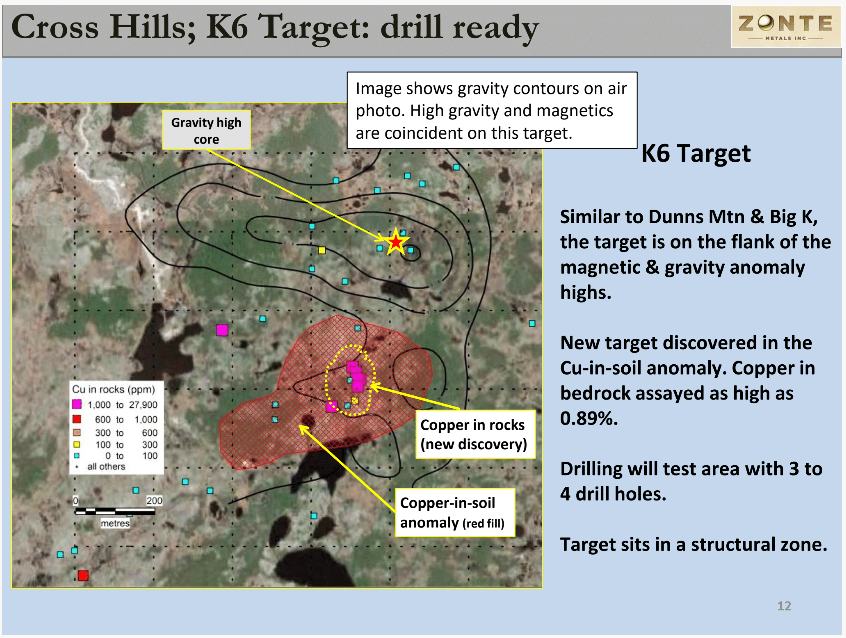
They did make one high-grade hit at their Dunns Mountain target, but it was narrow. It was 0.43 meters with 14% copper, 15 g/t gold and 352 g/t silver. With their new exploration approach, they are currently drilling the K6 target.
In the graphic, you can see that the copper soil anomaly sits adjacent to the gravity and magnetic highs. It is also proven with copper in rocks. Zonte has drilled four holes there so far, and I expect results in the New Year.
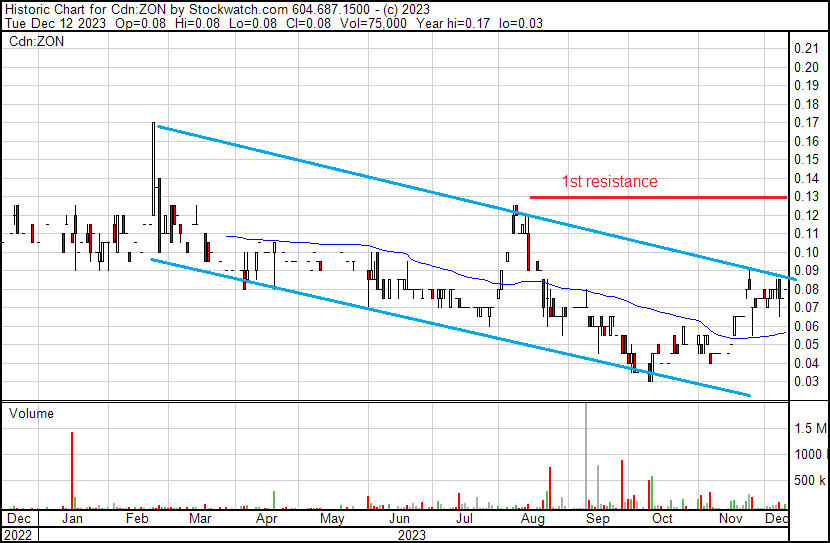
The stock just bottomed at historic lows in October but needs to break the downtrend channel. There is only mild resistance, around $0.08, with stronger resistance, around $0.13.
I did an 18-minute interview with CEO Terry Christopher, and we went over, in detail, the exploration of the K6 target. It is well worth watching at this YouTube link.
Zonte also has a gold project in the Yukon that is adjacent to Victoria Gold’s mine. Victoria Gold has been advancing a second discovery there and has been conducting sampling and drilling right up to Zonte’s property boundary. I have little doubt that it extends onto Zonte’s property. Zonte also had a drill discovery on this property in 2015 that is on trend. Zonte has about 70 M shares outstanding and, at current prices, has a market cap of just over $5 million.
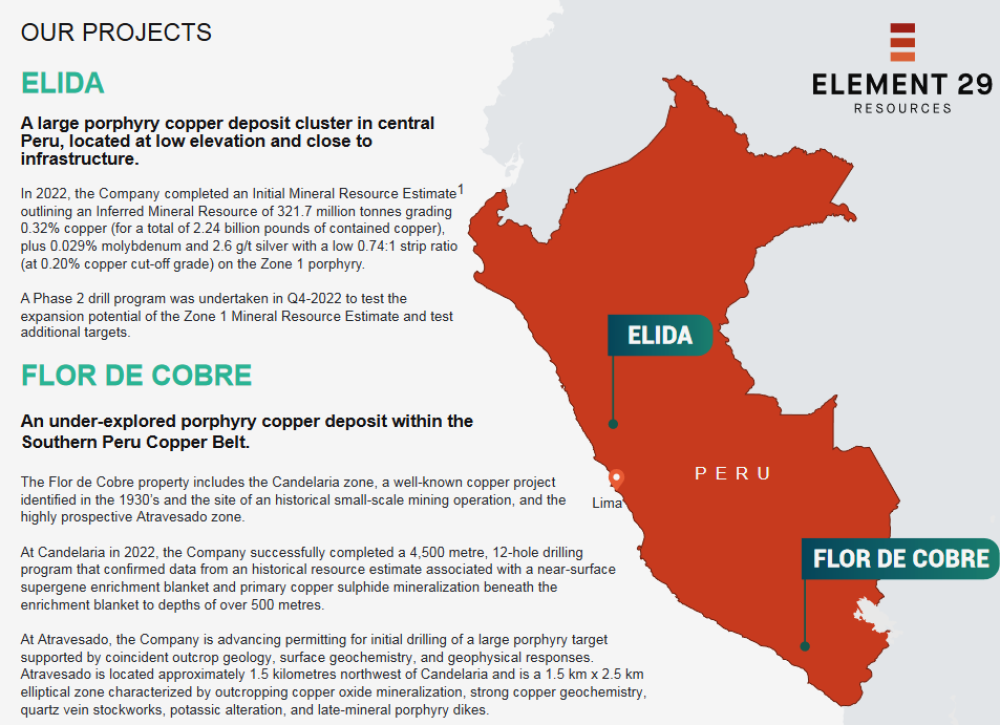
Element 29 Resources Inc. (ECU:TSX.V; EMTRF:OTC)
Recent Price: $0.15
Element 29 is advancing two new, high-quality copper projects in Peru — Flor de Cobre & Elida — each with excellent potential for resource growth and development.
They have 100% ownership in these projects and are at a favorable lower elevation < 2,700 meters and with good infrastructure.
ECU’s Elida project is in an advanced stage, but things have been quiet with the company. However, they just closed a $2.8 million financing in the middle of September, so I expect they will soon announce a new exploration and drill program. ECU has 106 M shares outstanding, so at $0.16, it has a market cap of about $16 million.
Explorers Ripe for Deals and Buyouts
All three of these junior explorers are ripe for either a JV deal or a buyout from a major. Of the three juniors, Zonte is the cheapest with a market cap of $5 million compared to the $16M (ECU) and $24M (MMA ) of the other two and has an active drill program, so additional catalysts to move the stock.
I suggest owning all three stocks with a focus first on Zonte if you don’t own any because they will have drill results in early 2024. For a copper producer, I think the best play is:
Capstone Copper Mining Corp. (CS:TSX)
Recent Price: $6.05
52-week trading range: $4.40 to $7.25
Shares outstanding: 695 million
Capstone is a pure copper producer with four producing mines: one in Arizona, one in Mexico, and two in Chile. And 97% of its revenues are derived from copper sales.
An expansion of their Mantoverde Mine in Chile is going to significantly increase copper production in 2024 and lower costs. Here are the operating results of the four mines in Q3 2023.
All operations performed a bit lower in Q3 and are temporary in nature.
Pinto Valley Mine, Arizona U.S.A.
Copper production of 13,600 tonnes in Q3 2023 was 3% lower than in Q3 2022, mainly on lower mill throughput during the quarter (Q3 2023 — 47,426 tonnes per day (tpd) versus Q3 2022 — 48,143 tpd), resulting from unplanned eight-day downtime related to the secondary crusher jack shaft replacement and counter shaft repairs. The grade was consistent quarter-over-quarter (Q3 2023 — 0.34% versus Q3 2022 — 0.34%). Recoveries were lower compared with the same period last year (Q3 2023 — 87.4% versus Q3 2022 — 89.1%).
Mantos Blancos Mine, Chile
Q3 2023 production was 12,200 tonnes, composed of 9,100 tonnes from sulfide operations and 3,000 tonnes of cathode from oxide operations, 11% lower than the 13,600 tonnes produced in Q3 2022. The lower production was driven primarily by lower dump throughput, grade, and recoveries impacting cathode production. The mill throughput of 14,176 tpd in Q3 2023 was impacted by mill downtime caused by planned repair and maintenance of the concentrator plant that lasted six days (liners and major components change). Recoveries were lower in Q3 2023 compared with the same period last year (76.3% in Q3 2023 versus 79.3 % in Q3 2022), mainly driven by ore characteristics in the upper areas of the mine. A plan to address the plant stability during the second half of 2023 is underway which includes improved maintenance and optimization of the concentrator and the tailings system.
Cozamin Mine, Mexico
Q3 2023 copper production of 5,900 tonnes was lower than the same period the prior year, mainly due to lower mill throughput (3,567 tpd in Q3 2023 versus 3,829 tpd in Q3 2022). Recoveries and grades were consistent quarter-over-quarter.
Mantoverde Mine, Chile
Q3 2023 copper production of 8,600 tonnes was 26 % lower compared with 11,600 tonnes in Q3 2022. Heap operations grade was lower as a result of mine sequence (0.32 % in Q3 2023 versus 0.45 % in Q3 2022), and recoveries were lower (66.5 % in Q3 2023 versus 86.7 % in Q3 2022) due to lower solubility ratio of the processed mineral and lower grades, all of which was partially offset by higher heap throughput (2.7 million tonnes in Q3 2023 versus 2.5 million tonnes in Q3 2022). Throughput from dump operations was lower compared with the same period last year due to a temporary sulphuric acid supply shortfall in September, and grades were consistent with the same period last year.
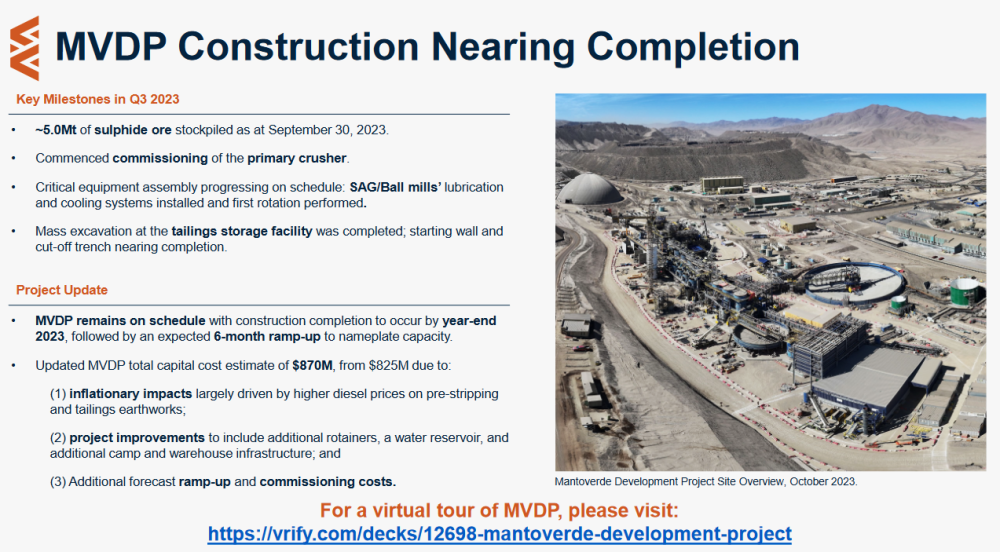
Mantoverde development project’s overall progress is at 93 % and remains on schedule. Construction is progressing well in all key areas of the project. Total project spending since inception was $763 million at the end of September 2023, compared with $706 million in June 2023.
The project is on target for construction completion by year-end 2023. As the project nears completion, the updated total project cost is estimated at $870 million, which is a 5% increase and includes approximately $20 million in project improvements.
Financial
Total available liquidity of $424.5 million as of September 30, 2023, composed of $129.5 million of cash and short-term investments, and $295 million of undrawn amounts on the corporate revolving credit facility. Capstone is in strong financial shape to get the Mantoverde on stream, and from that, revenues and cash flows will see significant increases.
Conclusion
Q3 2023 copper production totaled 40,300 tonnes at C1 cash costs of $2.88 per payable pound of copper produced. Copper production in the third quarter was impacted by an unplanned eight days of cumulative downtime at Pinto Valley related to the secondary crusher jack shaft replacement and counter shaft repairs, plus planned maintenance downtime at Mantos Blancos. Lower production levels and maintenance expenses were the key drivers related to higher consolidated cash costs in the quarter.
The company reaffirms its H2 copper production guidance of 83,000 tonnes to 93,000 t. C1 cash costs are trending toward the upper end of the H2 guidance range of $2.55/lb to $2.75/lb due to additional unplanned maintenance expenditures noted above.
John MacKenzie, CEO of Capstone, commented in the Q3 results: “I am encouraged by the progress we made during the third quarter in executing on our plan to improve operational reliability and expand margins across our portfolio. As construction at our flagship Mantoverde development project (MVDP) approaches completion by year-end, we look forward to a transformational year in 2024. Our excitement follows many years of dedicated effort by our mine build team in Chile. MVDP will drive a significant reduction in our consolidated unit costs and provide a pathway to record operating cash flow generation for Capstone Copper.”
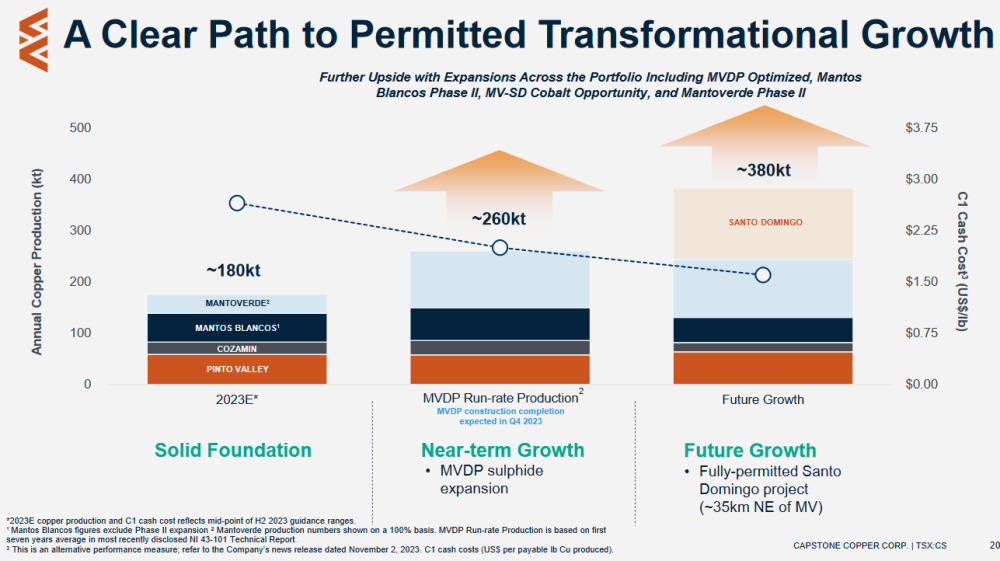
This graphic is from their presentation and highlights the strong growth in 2024 with the MVDP ramp-up. Future growth is expected with their Santo Domingo project in Chile. It is an IOCG system with a targeted 200,000 tonnes per year of low-cost copper with cobalt. An updated feasibility is planned for 2024.
With Capstone, you get the leverage to copper prices and exposure to strong production growth. The stock dipped with the overall market weakness in September/October and has recovered.
The drop in the stock in 2022 was when copper prices had some substantial weakness, see copper charts above.
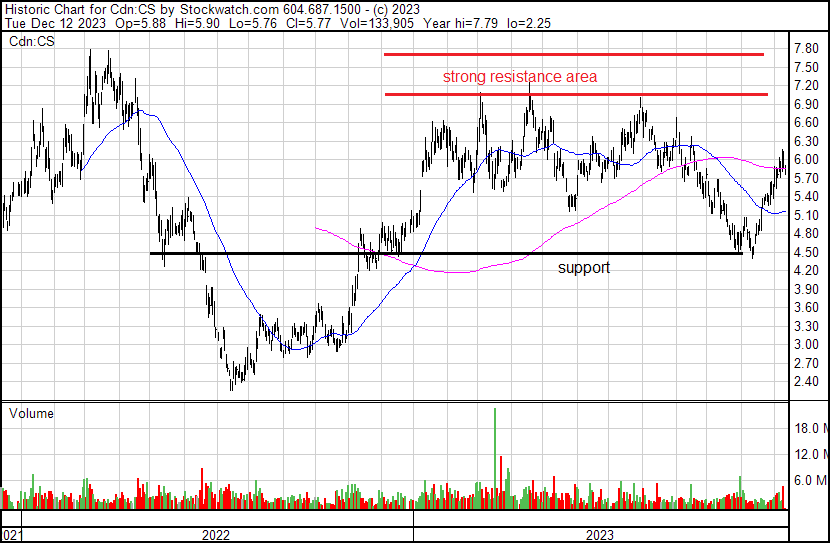
The stock has strong resistance above $7.00 and will probably take higher copper prices or when their increased production and revenue come on stream in 2024.
The stock has seen a very good rally, and I would look for some weakness or pull back to around $5.50 to buy.
Important Disclosures:
- As of the date of this article, officers and/or employees of Streetwise Reports LLC (including members of their household) own securities of [Midnight Sun Mining Corp.].
- [Ron Struthers]: I, or members of my immediate household or family, own securities of: [Zonte Metals and Midnight Sun]. I determined which companies would be included in this article based on my research and understanding of the sector.
- Statements and opinions expressed are the opinions of the author and not of Streetwise Reports or its officers. The author is wholly responsible for the validity of the statements. The author was not paid by Streetwise Reports for this article. Streetwise Reports was not paid by the author to publish or syndicate this article. Streetwise Reports requires contributing authors to disclose any shareholdings in, or economic relationships with, companies that they write about. Streetwise Reports relies upon the authors to accurately provide this information and Streetwise Reports has no means of verifying its accuracy.
- This article does not constitute investment advice. Each reader is encouraged to consult with his or her individual financial professional. By opening this page, each reader accepts and agrees to Streetwise Reports’ terms of use and full legal disclaimer. This article is not a solicitation for investment. Streetwise Reports does not render general or specific investment advice and the information on Streetwise Reports should not be considered a recommendation to buy or sell any security. Streetwise Reports does not endorse or recommend the business, products, services or securities of any company.
For additional disclosures, please click here.


