
By RoboForex Analytical Department
The commodity market started the week with a new wave of selloffs. The price of a barrel of Brent crude decreased to 80.65 USD.
Investors began reducing long positions on Friday amid uncertainty in the Middle East.
This week, the monthly reports from the International Energy Agency and OPEC are expected to be released. These documents will hold fresh assessments of the situation in the oil sector and, possibly, forecasted supply and demand parameters.
Also, the market eagerly awaits the latest inflation statistics from the US. This is one of the key indicators in shaping the Fed’s monetary policy, which is also significant for the oil market.
Brent technical analysis
Free Reports:
 Sign Up for Our Stock Market Newsletter – Get updated on News, Charts & Rankings of Public Companies when you join our Stocks Newsletter
 Get our Weekly Commitment of Traders Reports - See where the biggest traders (Hedge Funds and Commercial Hedgers) are positioned in the futures markets on a weekly basis.
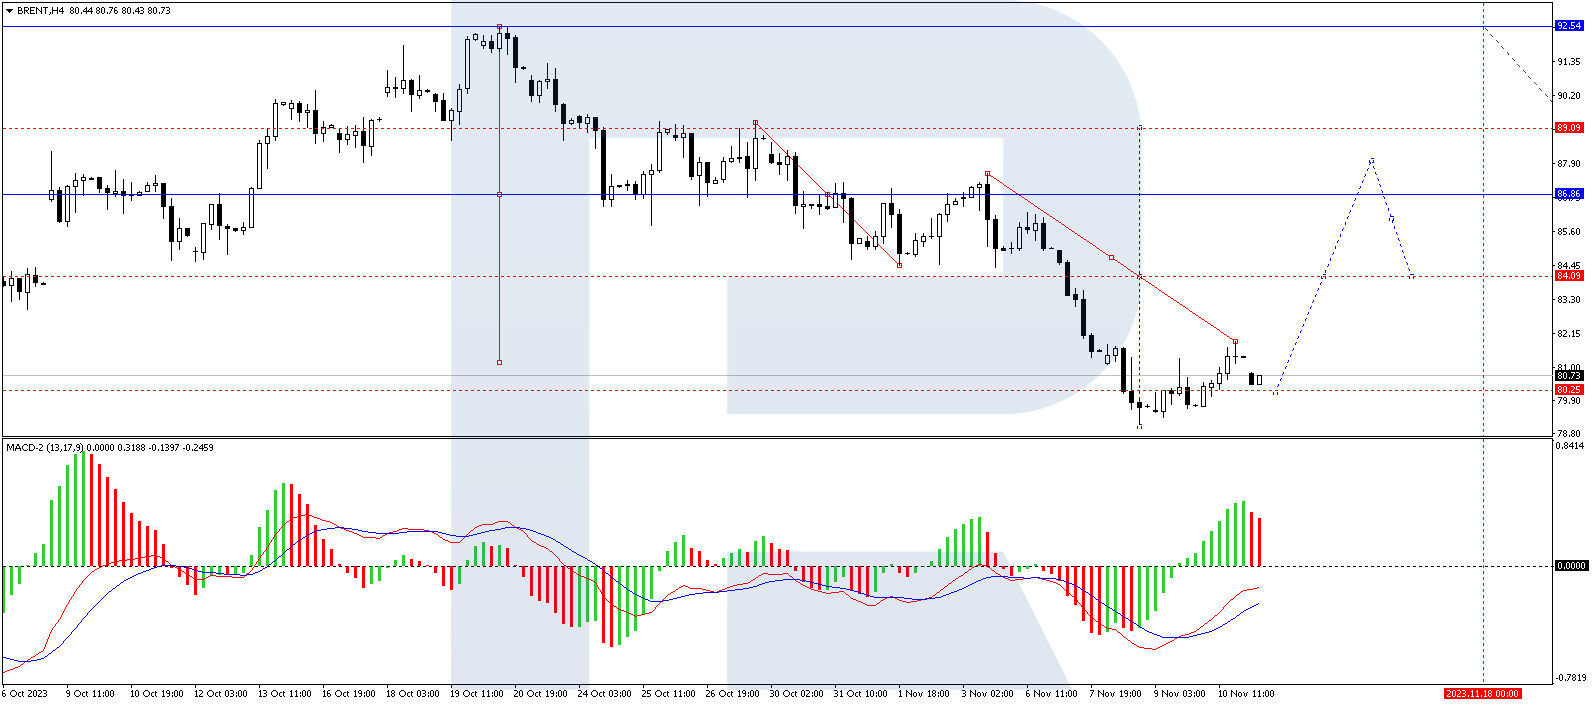
On the H4 chart, Brent has completed an upward impulse reaching the level of 81.89. Today, the quotes might correct to 80.37. After the correction is completed, a new wave of growth to 84.00 could begin, from where the trend could continue to 87.87. Technically, this scenario is confirmed by the MACD indicator. Its signal line is below zero and strictly directed upwards.
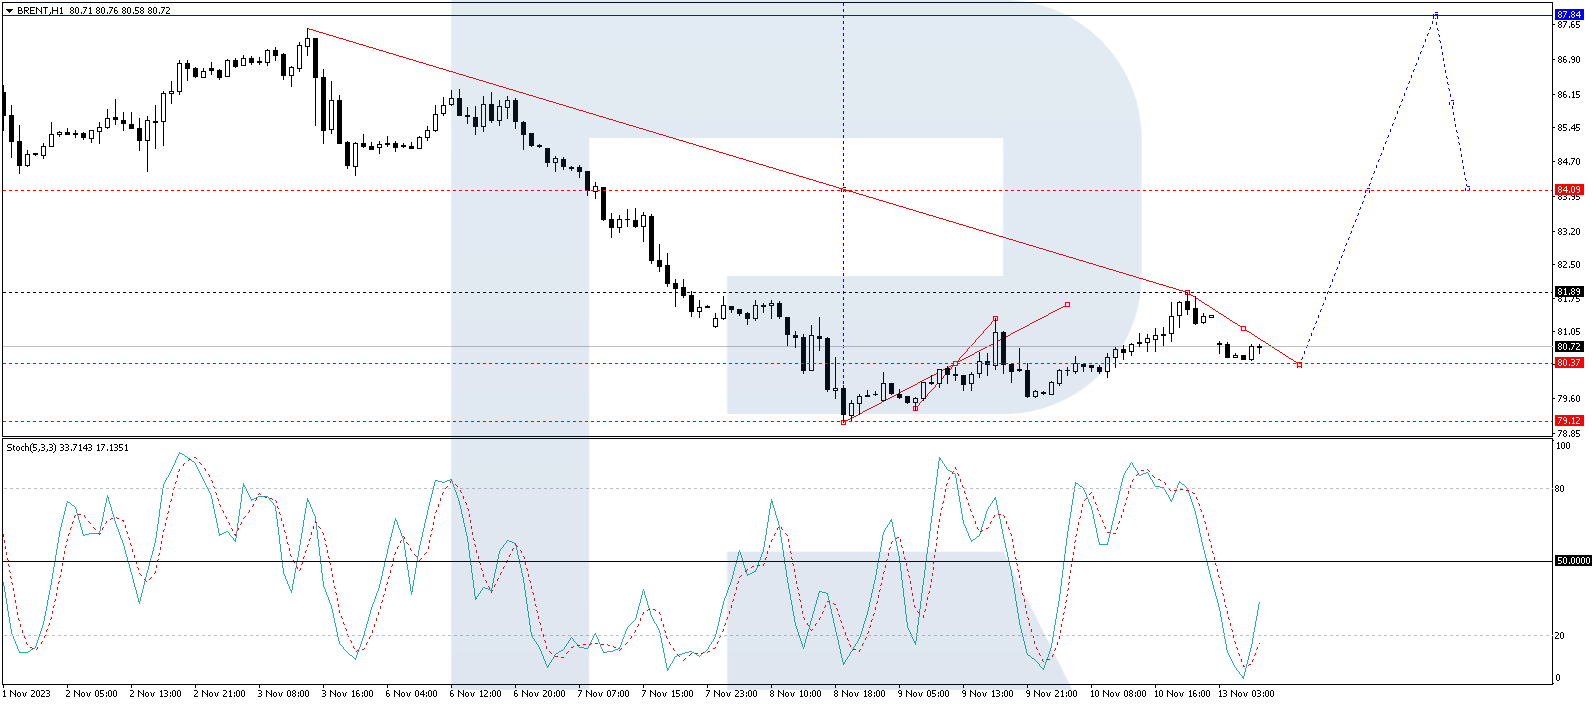
On the H1 chart, Brent has completed an upward wave to 81.89. Today, a correction to 80.37 is forming. After the price reaches this level, a wave of growth to 81.89 could follow. A breakout of this level could open the potential for a rise to 84.09. This is a local target. Technically, this scenario is confirmed by the Stochastic oscillator: its signal line is below 20 and strictly directed upwards. The indicator is expected to renew the highs.
Disclaimer
Any forecasts contained herein are based on the author’s particular opinion. This analysis may not be treated as trading advice. RoboForex bears no responsibility for trading results based on trading recommendations and reviews contained herein.

- COT Metals Charts: Weekly Speculator Bets see small gains for Silver & Gold Jul 12, 2026
- COT Bonds Charts: Speculator Bets led by SOFR 3-Months & 2-Year Bonds Jul 12, 2026
- COT Energy Charts: Weekly Speculator Changes led by Brent Oil Jul 12, 2026
- COT Soft Commodities Charts: Weekly Speculator Changes led by Sugar, Corn & Soybeans Jul 12, 2026
- The US and European stock indices are rising again amid renewed investor interest in the AI industry. Jul 10, 2026
- USD/JPY Falls as Yen Recovers Weekly Losses Jul 10, 2026
- Crude oil prices surged sharply by 7% in reaction to the rapid escalation of the conflict in the Middle East Jul 9, 2026
- Middle East Tensions Weigh on Gold Jul 9, 2026
- Pound Awaits Tighter Policy from Bank of England Jul 8, 2026
- The United States carried out airstrikes on Iran after Iran’s attacked tankers in the Strait of Hormuz. The RBNZ raised the interest rate to 2.5% Jul 8, 2026