By InvestMacro
Here are the latest charts and statistics for the Commitment of Traders (COT) data published by the Commodities Futures Trading Commission (CFTC).
The latest COT data is updated through Tuesday February 27th and shows a quick view of how large market participants (for-profit speculators and commercial traders) were positioned in the futures markets. All currency positions are in direct relation to the US dollar where, for example, a bet for the euro is a bet that the euro will rise versus the dollar while a bet against the euro will be a bet that the euro will decline versus the dollar.
Weekly Speculator Changes led by New Zealand Dollar & Australian Dollar
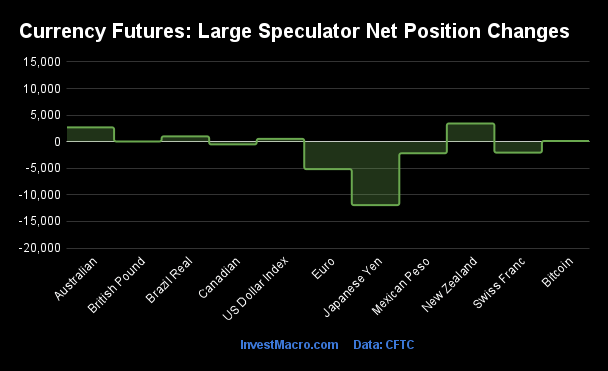
The COT currency market speculator bets were higher this week as six out of the eleven currency markets we cover had higher positioning while the other five markets had lower speculator contracts.
Leading the gains for the currency markets was the New Zealand Dollar (3,431 contracts) with the Australian Dollar (2,699 contracts), the Brazilian Real (1,004 contracts), the US Dollar Index (537 contracts), Bitcoin (131 contracts) and the British Pound (46 contracts) also having positive weeks.
The currencies seeing declines in speculator bets on the week were the Japanese Yen (-11,927 contracts), the EuroFX (-5,162 contracts), the Mexican Peso (-2,181 contracts), the Swiss Franc (-2,058 contracts) and the Canadian Dollar (-515 contracts) also registering lower bets on the week.
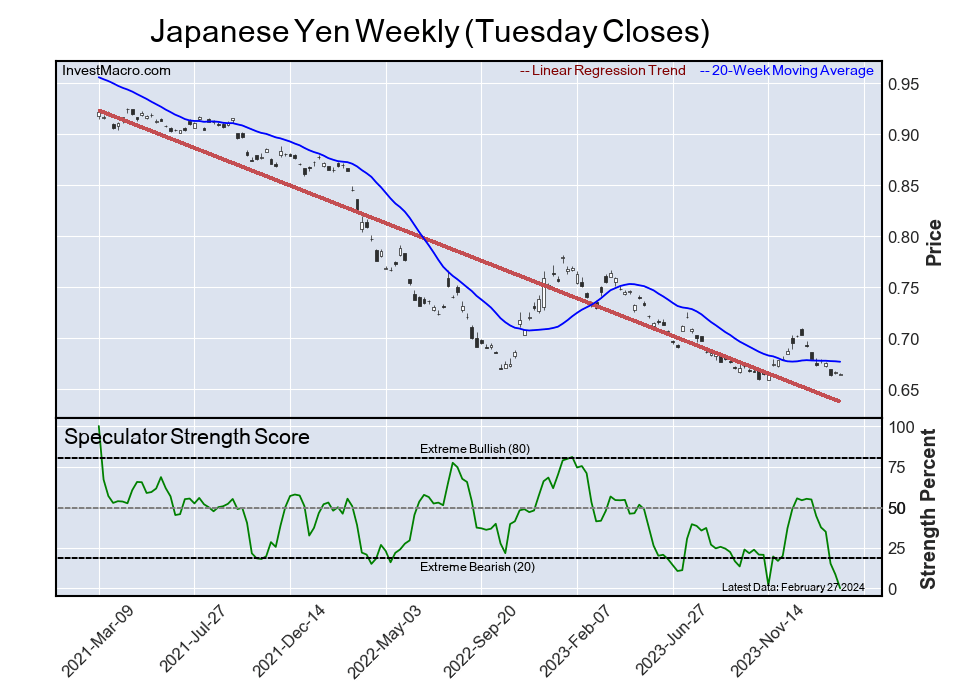
Japanese Yen Speculators sharply renew their bearish bets for 7th straight week
Highlighting the COT currency’s data this week is strong renewal in bearish bets for the Japanese yen speculators. Large speculative yen positions dropped for a seventh straight week this week and have now fallen by a total of -76,756 contracts over these past seven weeks.
This renewed bearishness for the yen has pushed the net position (currently at -132,705 contracts) to the most negative position since November 14th of 2017 (when it fell to -135,999 contracts), the lowest level in a span of 328 weeks.
Just a couple of months ago, the yen speculative positioning had been improving and was at it’s best level in 39-weeks (at -55,568 contracts on December 26th). This optimism was based on the hopes that the Bank of Japan (BOJ) would look to end its negative interest rate policy and its asset-buying program. However, the BOJ has maintained its policy so far in 2024 and speculator hopes for yen strength have been postponed.
The yen exchange rate has taken a large hit in the aftermath with the US Dollar’s exchange versus the yen shooting higher and closing in on the recent 2023 highs. The USDJPY currency pair is up by almost 7 percent since the beginning of the year and has risen in seven out of the past nine weeks. This week’s close was right above the 150.00 level is slightly below the November 2023 high of 151.90.
The USDJPY prices above the 150.00 level are very rare in recent years as these levels had not been reached since 1990 — until this threshold was breached in 2022, 2023 and now in 2024. The yen has now lost approximately 45 percent of its value versus the US Dollar since January of 2021 when the USDJPY traded around 103.00.
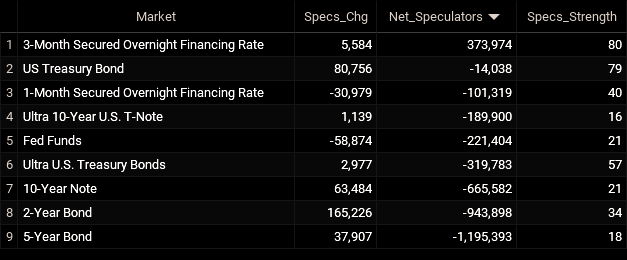
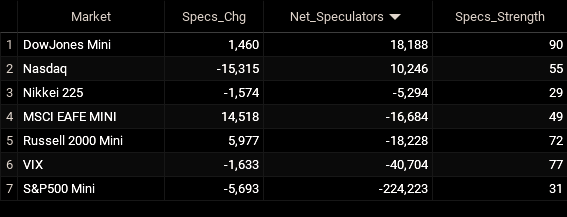
Currencies Net Speculators Leaderboard
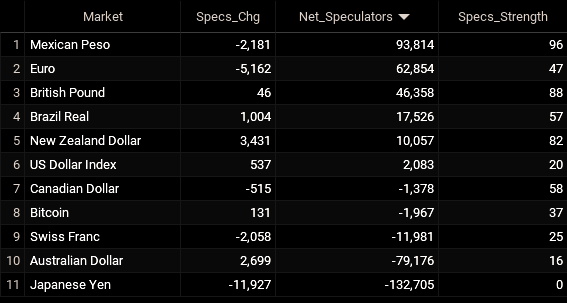
Legend: Weekly Speculators Change | Speculators Current Net Position | Speculators Strength Score compared to last 3-Years (0-100 range)
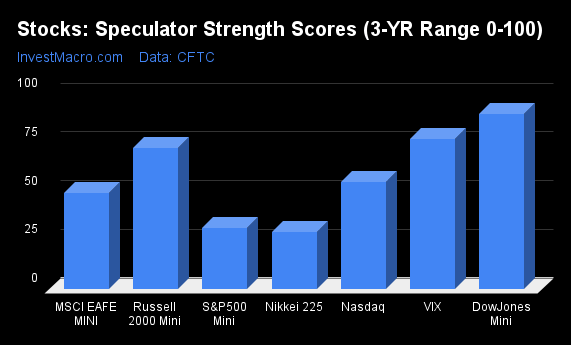
Strength Scores led by Mexican Peso & British Pound
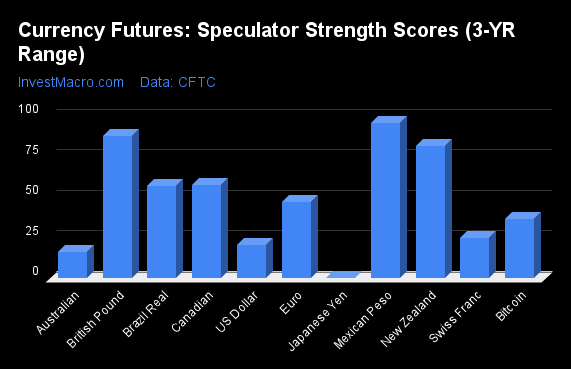
COT Strength Scores (a normalized measure of Speculator positions over a 3-Year range, from 0 to 100 where above 80 is Extreme-Bullish and below 20 is Extreme-Bearish) showed that the Mexican Peso (96 percent), the British Pound (88 percent) and New Zealand Dollar (82 percent) lead the currency markets this week. The Canadian Dollar (58 percent) and the Brazilian Real (57 percent) come in as the next highest in the weekly strength scores.
On the downside, the Japanese Yen (0 percent) and the Australian Dollar (16 percent) come in at the lowest strength levels currently and are in Extreme-Bearish territory (below 20 percent). The next lowest strength scores are the US Dollar Index (20 percent) and the Swiss Franc (25 percent).
Strength Statistics:
US Dollar Index (20.4 percent) vs US Dollar Index previous week (19.4 percent)
EuroFX (47.1 percent) vs EuroFX previous week (49.3 percent)
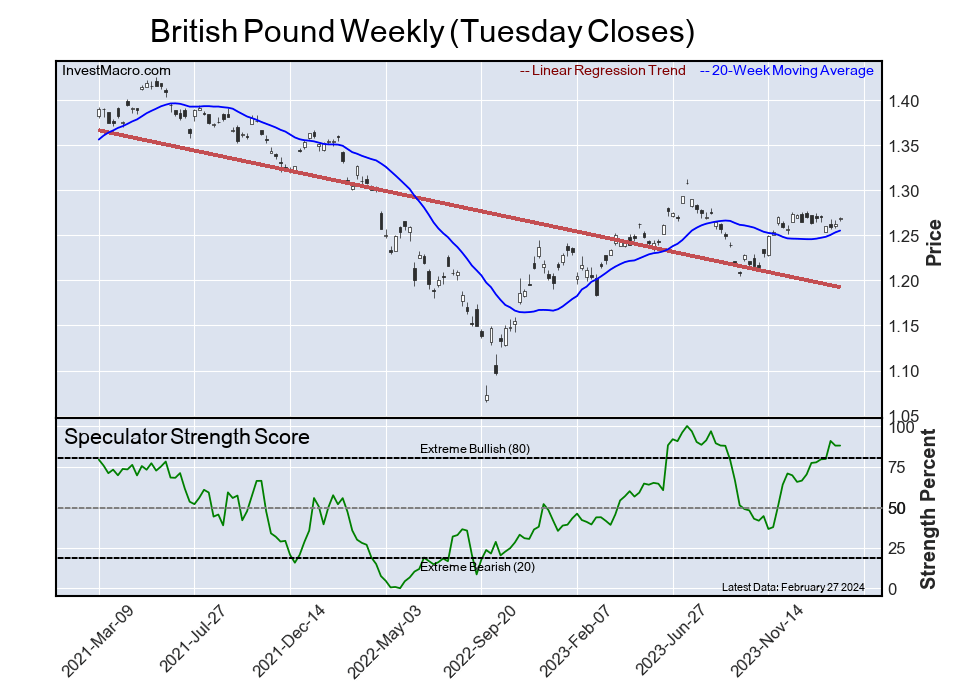
British Pound Sterling (87.9 percent) vs British Pound Sterling previous week (87.9 percent)
Japanese Yen (0.0 percent) vs Japanese Yen previous week (8.6 percent)
Swiss Franc (24.7 percent) vs Swiss Franc previous week (30.6 percent)
Canadian Dollar (57.9 percent) vs Canadian Dollar previous week (58.4 percent)
Australian Dollar (16.3 percent) vs Australian Dollar previous week (13.8 percent)
New Zealand Dollar (81.6 percent) vs New Zealand Dollar previous week (72.7 percent)
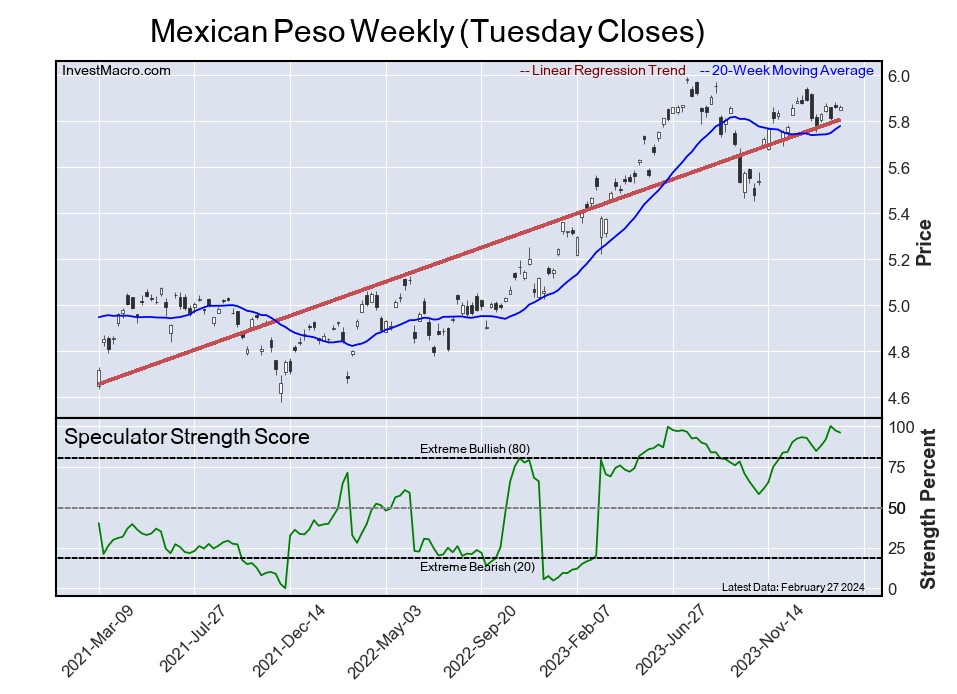
Mexican Peso (96.0 percent) vs Mexican Peso previous week (97.3 percent)
Brazilian Real (57.2 percent) vs Brazilian Real previous week (55.9 percent)
Bitcoin (36.8 percent) vs Bitcoin previous week (34.8 percent)
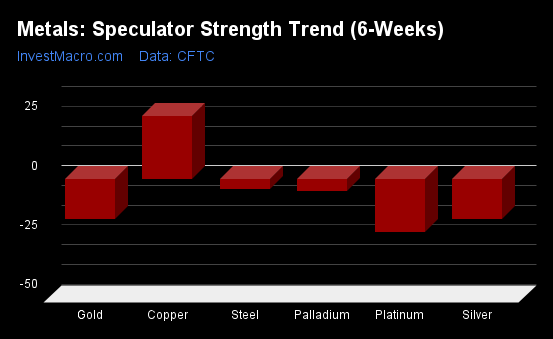
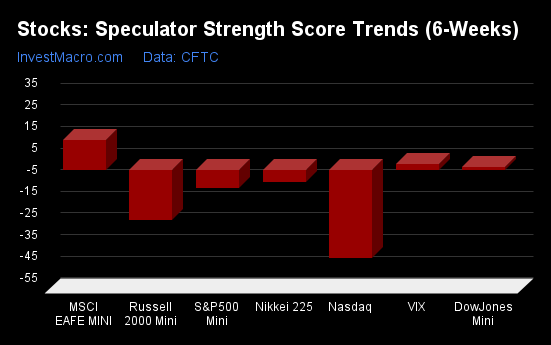
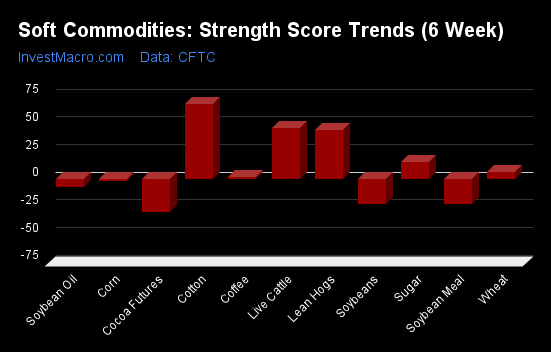
New Zealand Dollar & British Pound top the 6-Week Strength Trends
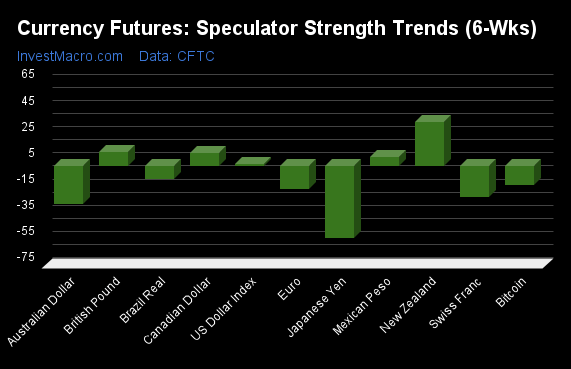
COT Strength Score Trends (or move index, calculates the 6-week changes in strength scores) showed that the New Zealand Dollar (34 percent) and the British Pound (11 percent) lead the past six weeks trends for the currencies. The Canadian Dollar (10 percent) and the Mexican Peso (7 percent) are the next highest positive movers in the latest trends data.
The Japanese Yen (-55 percent) leads the downside trend scores currently with the Australian Dollar (-29 percent), Swiss Franc (-24 percent) and the EuroFX (-18 percent) following next with lower trend scores.
Strength Trend Statistics:
US Dollar Index (1.5 percent) vs US Dollar Index previous week (-2.5 percent)
EuroFX (-17.6 percent) vs EuroFX previous week (-21.7 percent)
British Pound Sterling (10.7 percent) vs British Pound Sterling previous week (17.8 percent)
Japanese Yen (-54.7 percent) vs Japanese Yen previous week (-46.6 percent)
Swiss Franc (-23.5 percent) vs Swiss Franc previous week (-15.8 percent)
Canadian Dollar (10.1 percent) vs Canadian Dollar previous week (5.5 percent)
Australian Dollar (-28.7 percent) vs Australian Dollar previous week (-45.4 percent)
New Zealand Dollar (33.7 percent) vs New Zealand Dollar previous week (21.9 percent)
Mexican Peso (7.4 percent) vs Mexican Peso previous week (4.6 percent)
Brazilian Real (-9.3 percent) vs Brazilian Real previous week (-11.1 percent)
Bitcoin (-14.6 percent) vs Bitcoin previous week (-7.2 percent)
Individual COT Forex Markets:
US Dollar Index Futures:
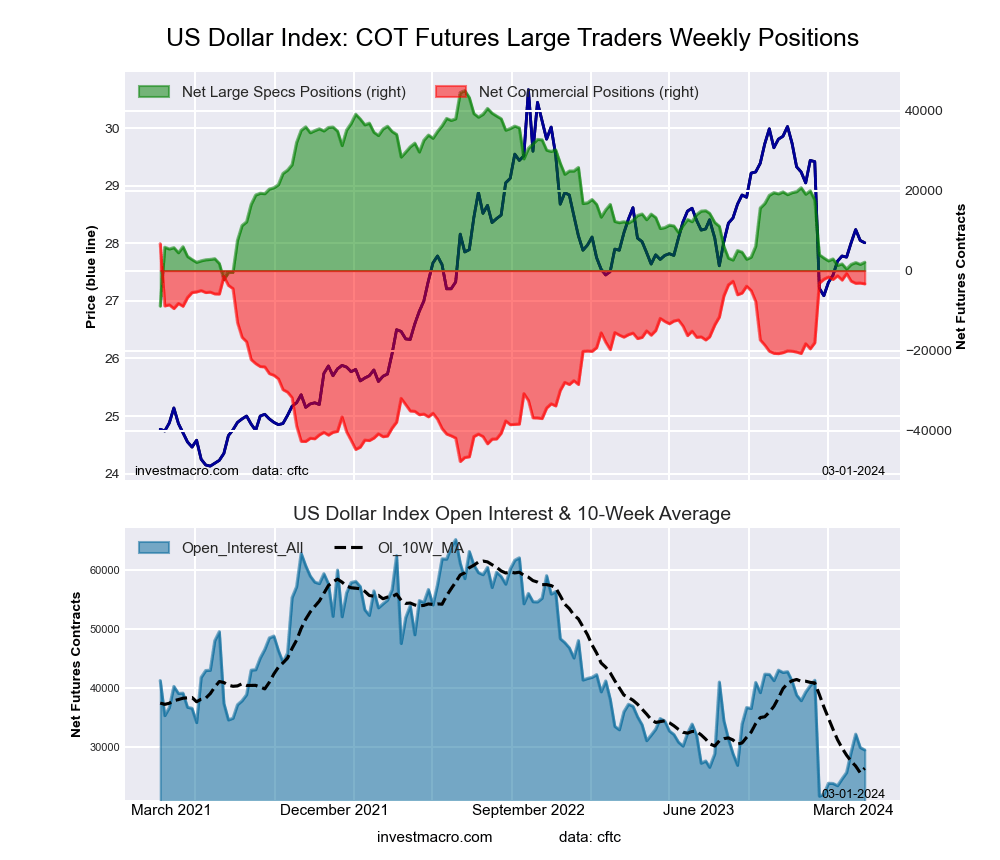 The US Dollar Index large speculator standing this week reached a net position of 2,083 contracts in the data reported through Tuesday. This was a weekly boost of 537 contracts from the previous week which had a total of 1,546 net contracts.
This week’s current strength score (the trader positioning range over the past three years, measured from 0 to 100) shows the speculators are currently Bearish with a score of 20.4 percent. The commercials are Bullish-Extreme with a score of 81.6 percent and the small traders (not shown in chart) are Bearish with a score of 25.6 percent.
Price Trend-Following Model: Downtrend
Our weekly trend-following model classifies the current market price position as: Downtrend. The current action for the model is considered to be: Hold – Maintain Short Position.
| US DOLLAR INDEX Statistics | SPECULATORS | COMMERCIALS | SMALL TRADERS |
| – Percent of Open Interest Longs: | 63.7 | 18.9 | 11.5 |
| – Percent of Open Interest Shorts: | 56.7 | 30.2 | 7.3 |
| – Net Position: | 2,083 | -3,323 | 1,240 |
| – Gross Longs: | 18,827 | 5,599 | 3,387 |
| – Gross Shorts: | 16,744 | 8,922 | 2,147 |
| – Long to Short Ratio: | 1.1 to 1 | 0.6 to 1 | 1.6 to 1 |
| NET POSITION TREND: | | | |
| – Strength Index Score (3 Year Range Pct): | 20.4 | 81.6 | 25.6 |
| – Strength Index Reading (3 Year Range): | Bearish | Bullish-Extreme | Bearish |
| NET POSITION MOVEMENT INDEX: | | | |
| – 6-Week Change in Strength Index: | 1.5 | -3.7 | 14.5 |
Euro Currency Futures:
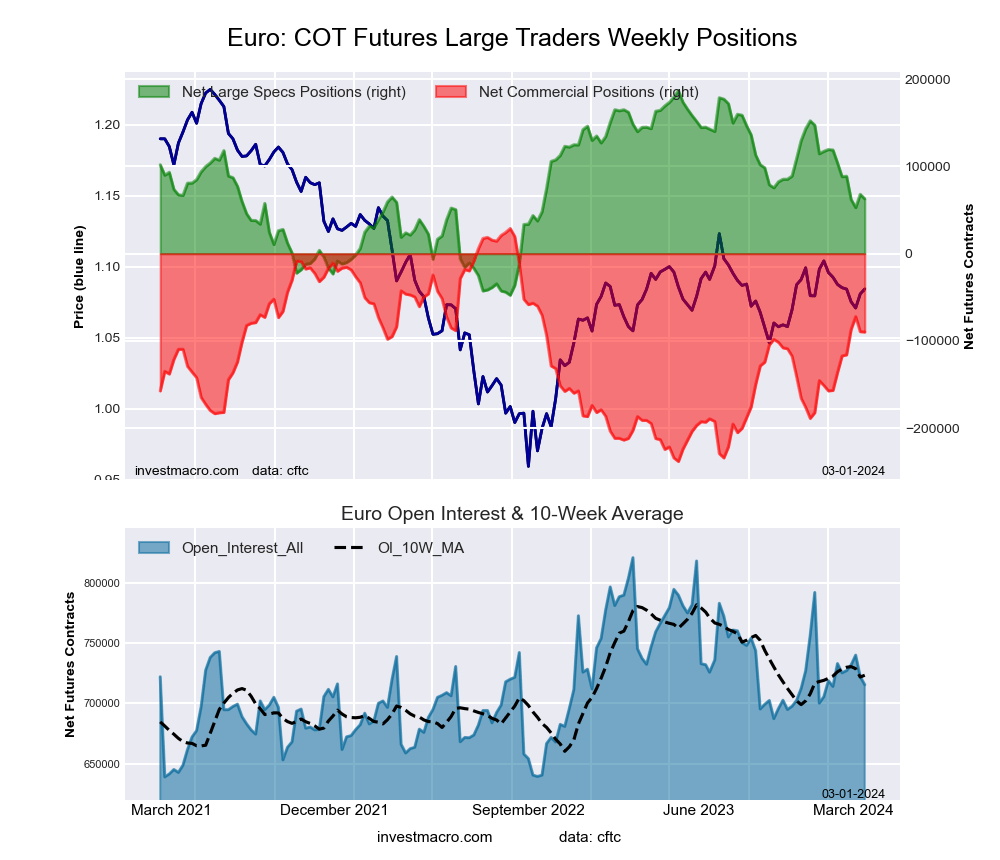 The Euro Currency large speculator standing this week reached a net position of 62,854 contracts in the data reported through Tuesday. This was a weekly decrease of -5,162 contracts from the previous week which had a total of 68,016 net contracts.
This week’s current strength score (the trader positioning range over the past three years, measured from 0 to 100) shows the speculators are currently Bearish with a score of 47.1 percent. The commercials are Bullish with a score of 55.6 percent and the small traders (not shown in chart) are Bearish with a score of 22.1 percent.
Price Trend-Following Model: Uptrend
Our weekly trend-following model classifies the current market price position as: Uptrend. The current action for the model is considered to be: Hold – Maintain Long Position.
| EURO Currency Statistics | SPECULATORS | COMMERCIALS | SMALL TRADERS |
| – Percent of Open Interest Longs: | 28.7 | 57.5 | 11.2 |
| – Percent of Open Interest Shorts: | 19.9 | 70.0 | 7.4 |
| – Net Position: | 62,854 | -89,901 | 27,047 |
| – Gross Longs: | 205,234 | 411,117 | 80,334 |
| – Gross Shorts: | 142,380 | 501,018 | 53,287 |
| – Long to Short Ratio: | 1.4 to 1 | 0.8 to 1 | 1.5 to 1 |
| NET POSITION TREND: | | | |
| – Strength Index Score (3 Year Range Pct): | 47.1 | 55.6 | 22.1 |
| – Strength Index Reading (3 Year Range): | Bearish | Bullish | Bearish |
| NET POSITION MOVEMENT INDEX: | | | |
| – 6-Week Change in Strength Index: | -17.6 | 17.4 | -8.6 |
British Pound Sterling Futures:
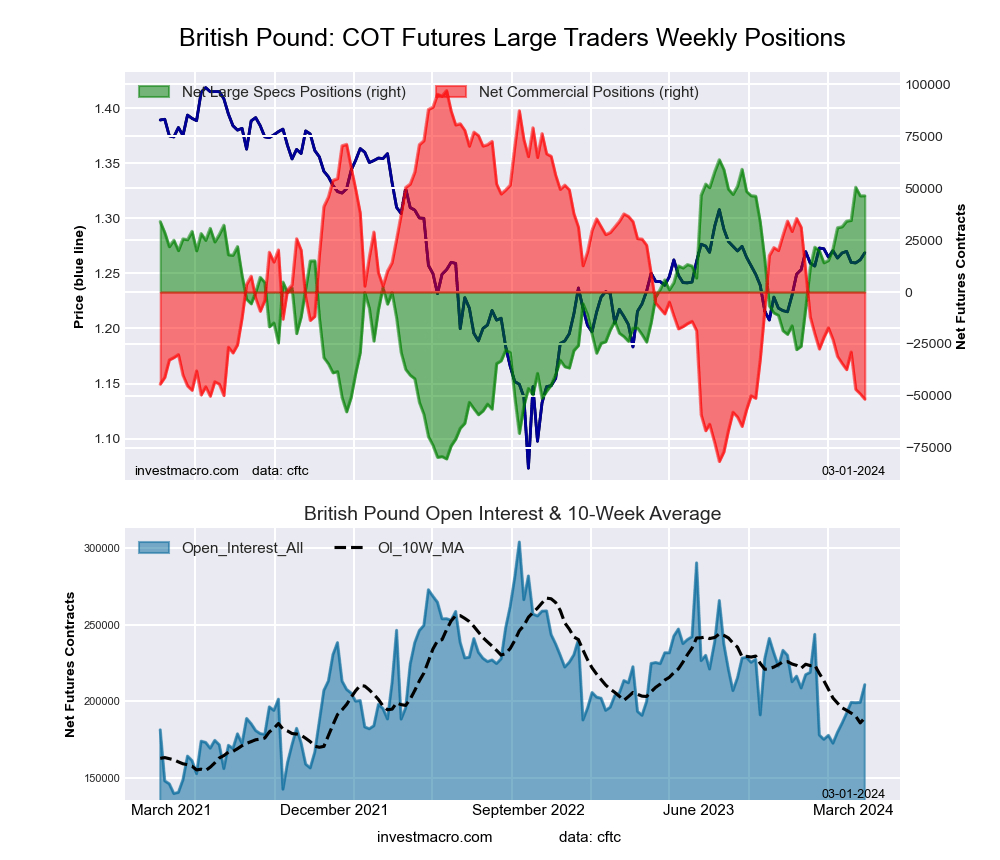 The British Pound Sterling large speculator standing this week reached a net position of 46,358 contracts in the data reported through Tuesday. This was a weekly lift of 46 contracts from the previous week which had a total of 46,312 net contracts.
This week’s current strength score (the trader positioning range over the past three years, measured from 0 to 100) shows the speculators are currently Bullish-Extreme with a score of 87.9 percent. The commercials are Bearish-Extreme with a score of 16.8 percent and the small traders (not shown in chart) are Bullish with a score of 68.3 percent.
Price Trend-Following Model: Uptrend
Our weekly trend-following model classifies the current market price position as: Uptrend. The current action for the model is considered to be: Hold – Maintain Long Position.
| BRITISH POUND Statistics | SPECULATORS | COMMERCIALS | SMALL TRADERS |
| – Percent of Open Interest Longs: | 43.6 | 35.9 | 14.7 |
| – Percent of Open Interest Shorts: | 21.6 | 60.4 | 12.2 |
| – Net Position: | 46,358 | -51,590 | 5,232 |
| – Gross Longs: | 91,970 | 75,762 | 31,048 |
| – Gross Shorts: | 45,612 | 127,352 | 25,816 |
| – Long to Short Ratio: | 2.0 to 1 | 0.6 to 1 | 1.2 to 1 |
| NET POSITION TREND: | | | |
| – Strength Index Score (3 Year Range Pct): | 87.9 | 16.8 | 68.3 |
| – Strength Index Reading (3 Year Range): | Bullish-Extreme | Bearish-Extreme | Bullish |
| NET POSITION MOVEMENT INDEX: | | | |
| – 6-Week Change in Strength Index: | 10.7 | -11.5 | 10.2 |
Japanese Yen Futures:
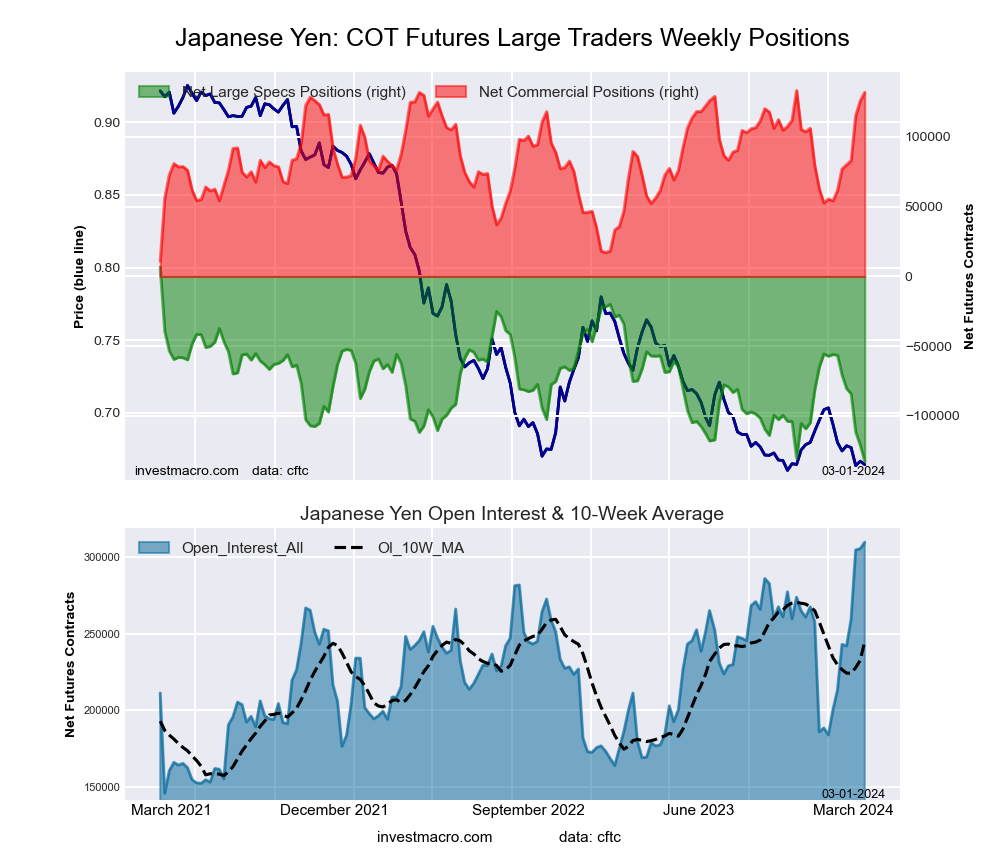 The Japanese Yen large speculator standing this week reached a net position of -132,705 contracts in the data reported through Tuesday. This was a weekly decrease of -11,927 contracts from the previous week which had a total of -120,778 net contracts.
This week’s current strength score (the trader positioning range over the past three years, measured from 0 to 100) shows the speculators are currently Bearish-Extreme with a score of 0.0 percent. The commercials are Bullish-Extreme with a score of 98.9 percent and the small traders (not shown in chart) are Bullish-Extreme with a score of 84.9 percent.
Price Trend-Following Model: Weak Uptrend
Our weekly trend-following model classifies the current market price position as: Weak Uptrend. The current action for the model is considered to be: Hold – Maintain Long Position.
| JAPANESE YEN Statistics | SPECULATORS | COMMERCIALS | SMALL TRADERS |
| – Percent of Open Interest Longs: | 16.6 | 66.0 | 14.0 |
| – Percent of Open Interest Shorts: | 59.4 | 23.4 | 13.7 |
| – Net Position: | -132,705 | 131,982 | 723 |
| – Gross Longs: | 51,261 | 204,425 | 43,296 |
| – Gross Shorts: | 183,966 | 72,443 | 42,573 |
| – Long to Short Ratio: | 0.3 to 1 | 2.8 to 1 | 1.0 to 1 |
| NET POSITION TREND: | | | |
| – Strength Index Score (3 Year Range Pct): | 0.0 | 98.9 | 84.9 |
| – Strength Index Reading (3 Year Range): | Bearish-Extreme | Bullish-Extreme | Bullish-Extreme |
| NET POSITION MOVEMENT INDEX: | | | |
| – 6-Week Change in Strength Index: | -54.7 | 57.4 | 18.5 |
Swiss Franc Futures:
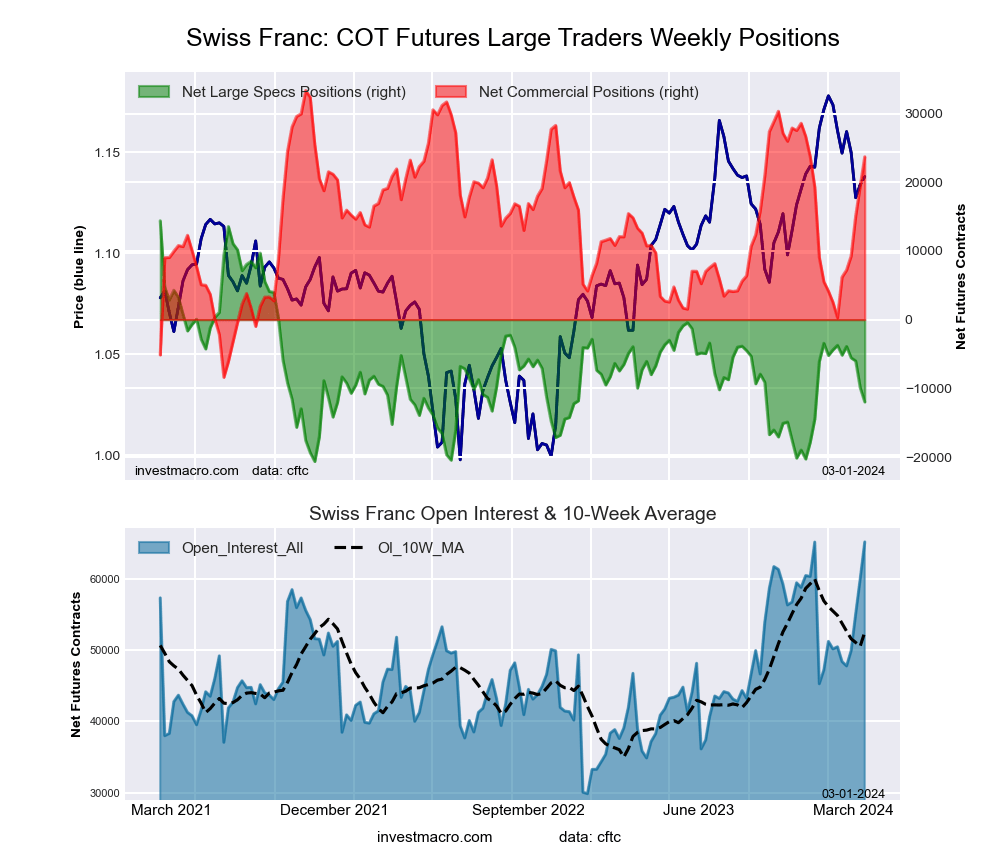 The Swiss Franc large speculator standing this week reached a net position of -11,981 contracts in the data reported through Tuesday. This was a weekly fall of -2,058 contracts from the previous week which had a total of -9,923 net contracts.
This week’s current strength score (the trader positioning range over the past three years, measured from 0 to 100) shows the speculators are currently Bearish with a score of 24.7 percent. The commercials are Bullish with a score of 76.9 percent and the small traders (not shown in chart) are Bearish with a score of 23.9 percent.
Price Trend-Following Model: Weak Uptrend
Our weekly trend-following model classifies the current market price position as: Weak Uptrend. The current action for the model is considered to be: Hold – Maintain Long Position.
| SWISS FRANC Statistics | SPECULATORS | COMMERCIALS | SMALL TRADERS |
| – Percent of Open Interest Longs: | 24.3 | 62.4 | 12.7 |
| – Percent of Open Interest Shorts: | 42.7 | 26.1 | 30.6 |
| – Net Position: | -11,981 | 23,709 | -11,728 |
| – Gross Longs: | 15,857 | 40,716 | 8,251 |
| – Gross Shorts: | 27,838 | 17,007 | 19,979 |
| – Long to Short Ratio: | 0.6 to 1 | 2.4 to 1 | 0.4 to 1 |
| NET POSITION TREND: | | | |
| – Strength Index Score (3 Year Range Pct): | 24.7 | 76.9 | 23.9 |
| – Strength Index Reading (3 Year Range): | Bearish | Bullish | Bearish |
| NET POSITION MOVEMENT INDEX: | | | |
| – 6-Week Change in Strength Index: | -23.5 | 56.1 | -69.1 |
Canadian Dollar Futures:
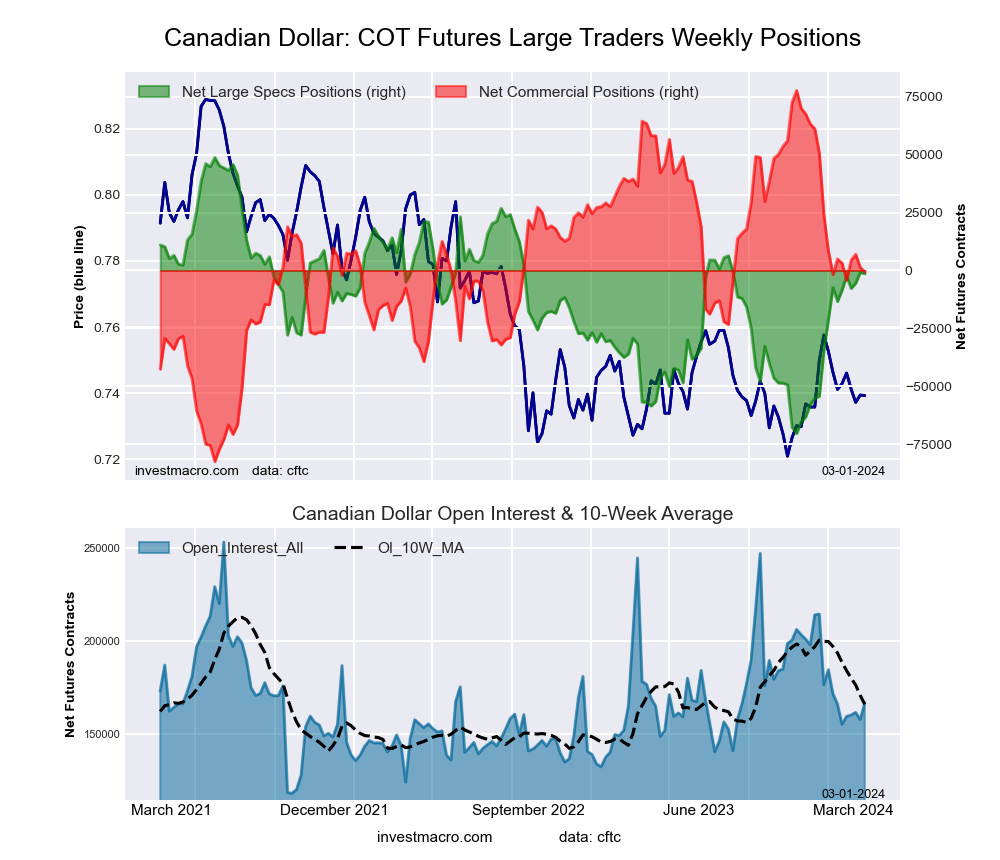 The Canadian Dollar large speculator standing this week reached a net position of -1,378 contracts in the data reported through Tuesday. This was a weekly fall of -515 contracts from the previous week which had a total of -863 net contracts.
This week’s current strength score (the trader positioning range over the past three years, measured from 0 to 100) shows the speculators are currently Bullish with a score of 57.9 percent. The commercials are Bullish with a score of 51.1 percent and the small traders (not shown in chart) are Bearish with a score of 27.1 percent.
Price Trend-Following Model: Weak Uptrend
Our weekly trend-following model classifies the current market price position as: Weak Uptrend. The current action for the model is considered to be: Hold – Maintain Long Position.
| CANADIAN DOLLAR Statistics | SPECULATORS | COMMERCIALS | SMALL TRADERS |
| – Percent of Open Interest Longs: | 24.7 | 54.4 | 17.9 |
| – Percent of Open Interest Shorts: | 25.5 | 54.7 | 16.7 |
| – Net Position: | -1,378 | -573 | 1,951 |
| – Gross Longs: | 41,158 | 90,546 | 29,731 |
| – Gross Shorts: | 42,536 | 91,119 | 27,780 |
| – Long to Short Ratio: | 1.0 to 1 | 1.0 to 1 | 1.1 to 1 |
| NET POSITION TREND: | | | |
| – Strength Index Score (3 Year Range Pct): | 57.9 | 51.1 | 27.1 |
| – Strength Index Reading (3 Year Range): | Bullish | Bullish | Bearish |
| NET POSITION MOVEMENT INDEX: | | | |
| – 6-Week Change in Strength Index: | 10.1 | -3.4 | -14.5 |
Australian Dollar Futures:
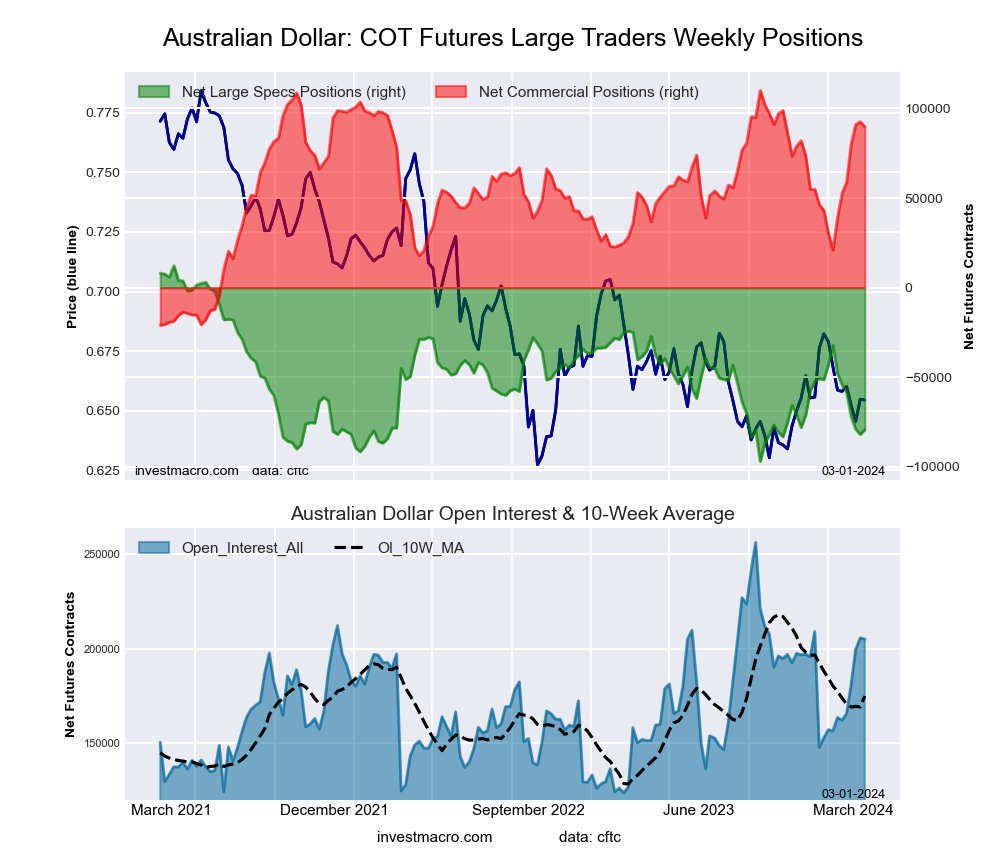 The Australian Dollar large speculator standing this week reached a net position of -79,176 contracts in the data reported through Tuesday. This was a weekly advance of 2,699 contracts from the previous week which had a total of -81,875 net contracts.
This week’s current strength score (the trader positioning range over the past three years, measured from 0 to 100) shows the speculators are currently Bearish-Extreme with a score of 16.3 percent. The commercials are Bullish-Extreme with a score of 84.5 percent and the small traders (not shown in chart) are Bearish with a score of 27.5 percent.
Price Trend-Following Model: Weak Uptrend
Our weekly trend-following model classifies the current market price position as: Weak Uptrend. The current action for the model is considered to be: Hold – Maintain Long Position.
| AUSTRALIAN DOLLAR Statistics | SPECULATORS | COMMERCIALS | SMALL TRADERS |
| – Percent of Open Interest Longs: | 24.2 | 63.1 | 9.5 |
| – Percent of Open Interest Shorts: | 62.8 | 19.3 | 14.6 |
| – Net Position: | -79,176 | 89,777 | -10,601 |
| – Gross Longs: | 49,640 | 129,292 | 19,390 |
| – Gross Shorts: | 128,816 | 39,515 | 29,991 |
| – Long to Short Ratio: | 0.4 to 1 | 3.3 to 1 | 0.6 to 1 |
| NET POSITION TREND: | | | |
| – Strength Index Score (3 Year Range Pct): | 16.3 | 84.5 | 27.5 |
| – Strength Index Reading (3 Year Range): | Bearish-Extreme | Bullish-Extreme | Bearish |
| NET POSITION MOVEMENT INDEX: | | | |
| – 6-Week Change in Strength Index: | -28.7 | 38.8 | -49.0 |
New Zealand Dollar Futures:
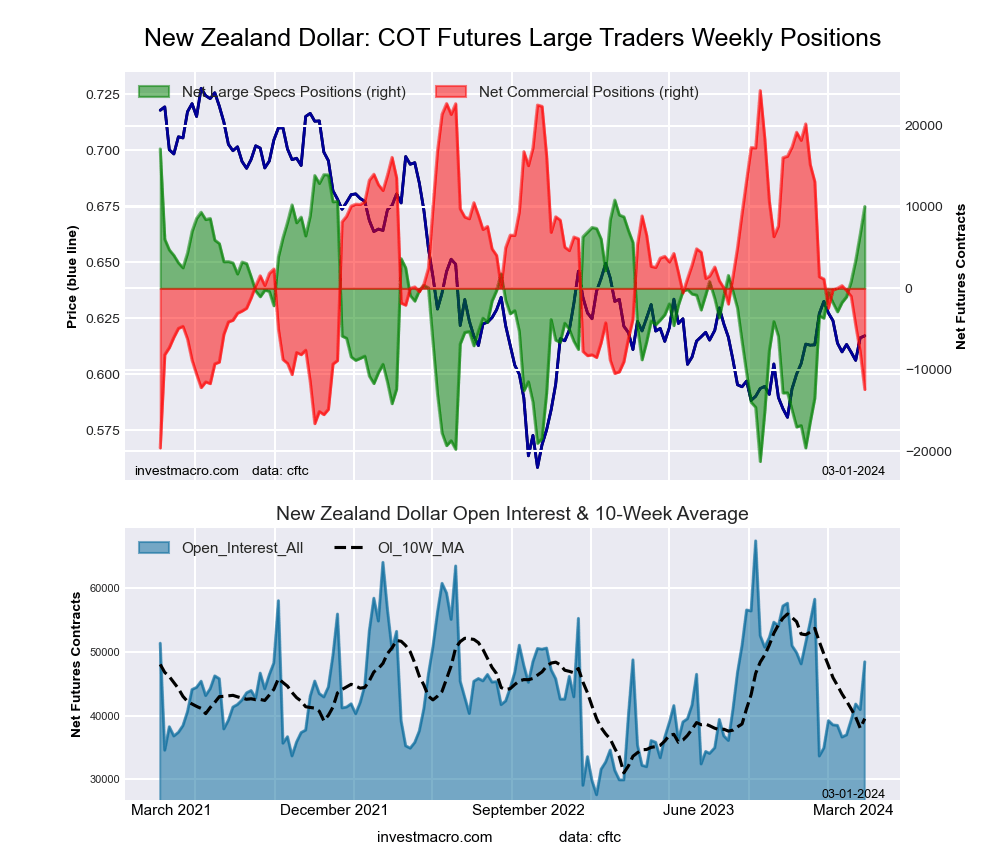 The New Zealand Dollar large speculator standing this week reached a net position of 10,057 contracts in the data reported through Tuesday. This was a weekly gain of 3,431 contracts from the previous week which had a total of 6,626 net contracts.
This week’s current strength score (the trader positioning range over the past three years, measured from 0 to 100) shows the speculators are currently Bullish-Extreme with a score of 81.6 percent. The commercials are Bearish-Extreme with a score of 16.4 percent and the small traders (not shown in chart) are Bullish-Extreme with a score of 84.7 percent.
Price Trend-Following Model: Uptrend
Our weekly trend-following model classifies the current market price position as: Uptrend. The current action for the model is considered to be: Hold – Maintain Long Position.
| NEW ZEALAND DOLLAR Statistics | SPECULATORS | COMMERCIALS | SMALL TRADERS |
| – Percent of Open Interest Longs: | 49.4 | 36.1 | 10.4 |
| – Percent of Open Interest Shorts: | 28.7 | 61.7 | 5.5 |
| – Net Position: | 10,057 | -12,425 | 2,368 |
| – Gross Longs: | 23,942 | 17,474 | 5,020 |
| – Gross Shorts: | 13,885 | 29,899 | 2,652 |
| – Long to Short Ratio: | 1.7 to 1 | 0.6 to 1 | 1.9 to 1 |
| NET POSITION TREND: | | | |
| – Strength Index Score (3 Year Range Pct): | 81.6 | 16.4 | 84.7 |
| – Strength Index Reading (3 Year Range): | Bullish-Extreme | Bearish-Extreme | Bullish-Extreme |
| NET POSITION MOVEMENT INDEX: | | | |
| – 6-Week Change in Strength Index: | 33.7 | -28.3 | -6.6 |
Mexican Peso Futures:
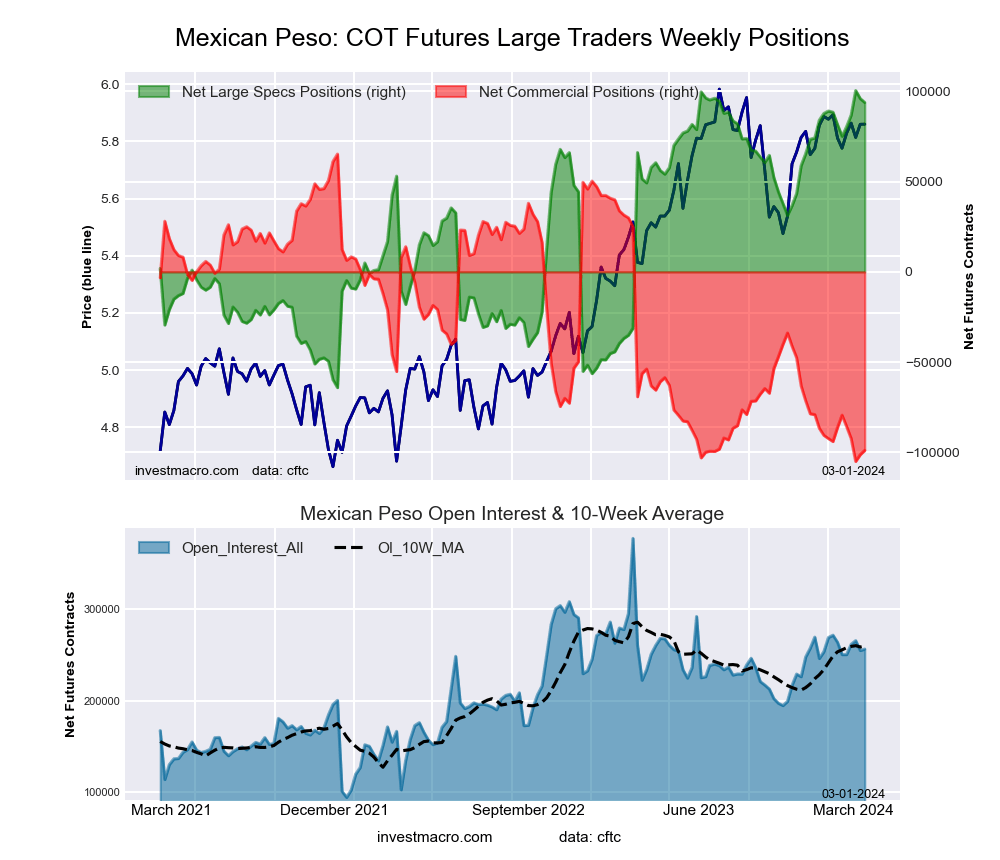 The Mexican Peso large speculator standing this week reached a net position of 93,814 contracts in the data reported through Tuesday. This was a weekly reduction of -2,181 contracts from the previous week which had a total of 95,995 net contracts.
This week’s current strength score (the trader positioning range over the past three years, measured from 0 to 100) shows the speculators are currently Bullish-Extreme with a score of 96.0 percent. The commercials are Bearish-Extreme with a score of 3.6 percent and the small traders (not shown in chart) are Bearish with a score of 43.6 percent.
Price Trend-Following Model: Uptrend
Our weekly trend-following model classifies the current market price position as: Uptrend. The current action for the model is considered to be: Hold – Maintain Long Position.
| MEXICAN PESO Statistics | SPECULATORS | COMMERCIALS | SMALL TRADERS |
| – Percent of Open Interest Longs: | 57.1 | 38.9 | 3.1 |
| – Percent of Open Interest Shorts: | 20.4 | 77.6 | 1.1 |
| – Net Position: | 93,814 | -98,895 | 5,081 |
| – Gross Longs: | 146,118 | 99,727 | 7,980 |
| – Gross Shorts: | 52,304 | 198,622 | 2,899 |
| – Long to Short Ratio: | 2.8 to 1 | 0.5 to 1 | 2.8 to 1 |
| NET POSITION TREND: | | | |
| – Strength Index Score (3 Year Range Pct): | 96.0 | 3.6 | 43.6 |
| – Strength Index Reading (3 Year Range): | Bullish-Extreme | Bearish-Extreme | Bearish |
| NET POSITION MOVEMENT INDEX: | | | |
| – 6-Week Change in Strength Index: | 7.4 | -7.4 | 2.6 |
Brazilian Real Futures:
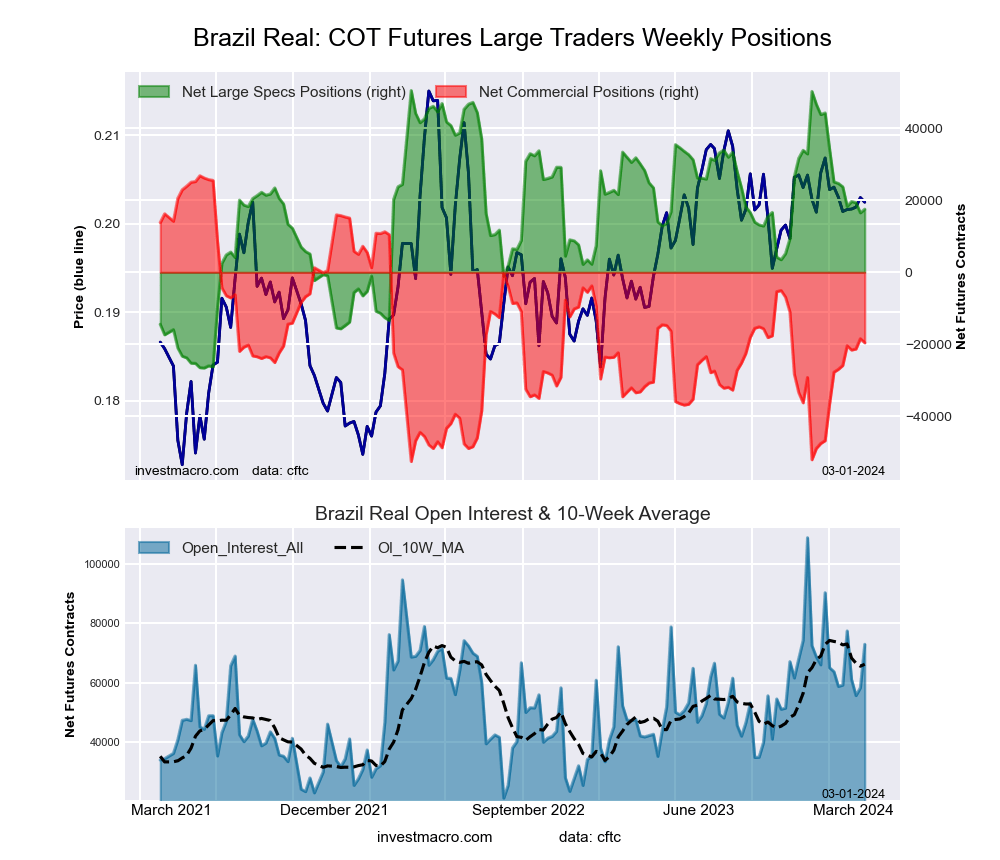 The Brazilian Real large speculator standing this week reached a net position of 17,526 contracts in the data reported through Tuesday. This was a weekly gain of 1,004 contracts from the previous week which had a total of 16,522 net contracts.
This week’s current strength score (the trader positioning range over the past three years, measured from 0 to 100) shows the speculators are currently Bullish with a score of 57.2 percent. The commercials are Bearish with a score of 41.5 percent and the small traders (not shown in chart) are Bullish with a score of 53.7 percent.
Price Trend-Following Model: Weak Uptrend
Our weekly trend-following model classifies the current market price position as: Weak Uptrend. The current action for the model is considered to be: Hold – Maintain Long Position.
| BRAZIL REAL Statistics | SPECULATORS | COMMERCIALS | SMALL TRADERS |
| – Percent of Open Interest Longs: | 47.4 | 43.4 | 4.6 |
| – Percent of Open Interest Shorts: | 23.3 | 70.3 | 1.7 |
| – Net Position: | 17,526 | -19,592 | 2,066 |
| – Gross Longs: | 34,550 | 31,653 | 3,337 |
| – Gross Shorts: | 17,024 | 51,245 | 1,271 |
| – Long to Short Ratio: | 2.0 to 1 | 0.6 to 1 | 2.6 to 1 |
| NET POSITION TREND: | | | |
| – Strength Index Score (3 Year Range Pct): | 57.2 | 41.5 | 53.7 |
| – Strength Index Reading (3 Year Range): | Bullish | Bearish | Bullish |
| NET POSITION MOVEMENT INDEX: | | | |
| – 6-Week Change in Strength Index: | -9.3 | 9.3 | -2.0 |
Bitcoin Futures:
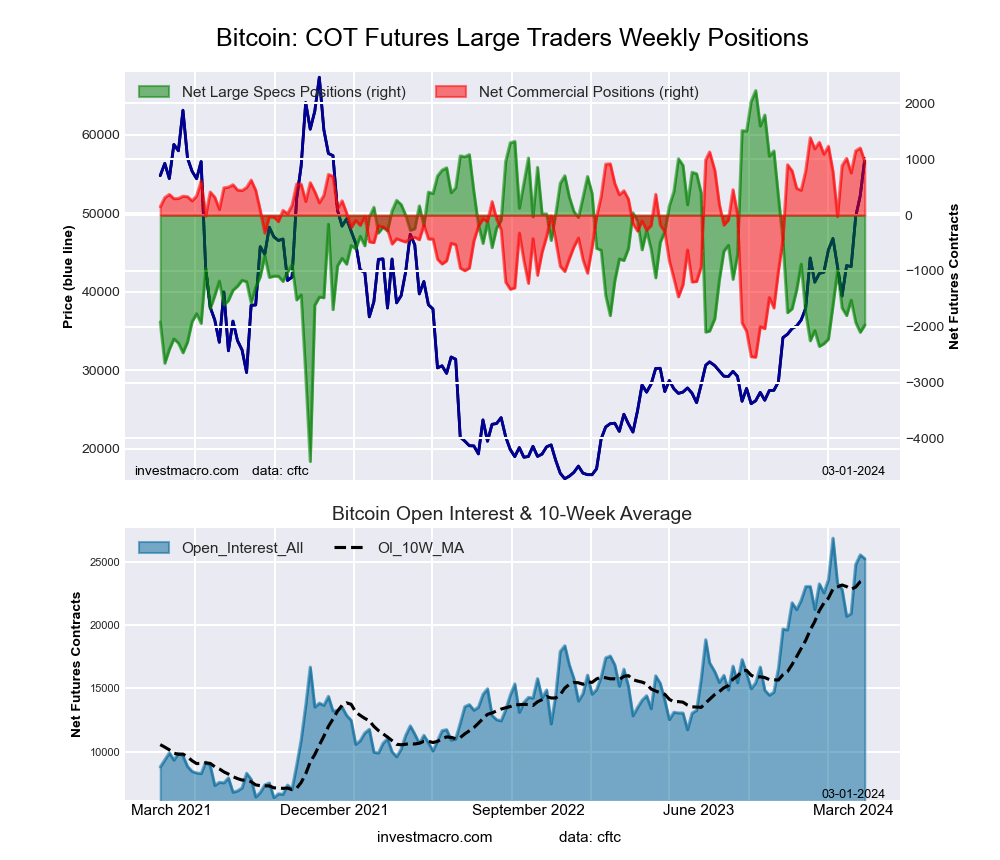 The Bitcoin large speculator standing this week reached a net position of -1,967 contracts in the data reported through Tuesday. This was a weekly gain of 131 contracts from the previous week which had a total of -2,098 net contracts.
This week’s current strength score (the trader positioning range over the past three years, measured from 0 to 100) shows the speculators are currently Bearish with a score of 36.8 percent. The commercials are Bullish-Extreme with a score of 89.1 percent and the small traders (not shown in chart) are Bearish with a score of 35.8 percent.
Price Trend-Following Model: Strong Uptrend
Our weekly trend-following model classifies the current market price position as: Strong Uptrend. The current action for the model is considered to be: Hold – Maintain Long Position.
| BITCOIN Statistics | SPECULATORS | COMMERCIALS | SMALL TRADERS |
| – Percent of Open Interest Longs: | 79.4 | 7.0 | 6.8 |
| – Percent of Open Interest Shorts: | 87.2 | 3.2 | 2.8 |
| – Net Position: | -1,967 | 960 | 1,007 |
| – Gross Longs: | 20,034 | 1,759 | 1,726 |
| – Gross Shorts: | 22,001 | 799 | 719 |
| – Long to Short Ratio: | 0.9 to 1 | 2.2 to 1 | 2.4 to 1 |
| NET POSITION TREND: | | | |
| – Strength Index Score (3 Year Range Pct): | 36.8 | 89.1 | 35.8 |
| – Strength Index Reading (3 Year Range): | Bearish | Bullish-Extreme | Bearish |
| NET POSITION MOVEMENT INDEX: | | | |
| – 6-Week Change in Strength Index: | -14.6 | 25.1 | -0.3 |
Article By InvestMacro – Receive our weekly COT Newsletter
*COT Report: The COT data, released weekly to the public each Friday, is updated through the most recent Tuesday (data is 3 days old) and shows a quick view of how large speculators or non-commercials (for-profit traders) were positioned in the futures markets.
The CFTC categorizes trader positions according to commercial hedgers (traders who use futures contracts for hedging as part of the business), non-commercials (large traders who speculate to realize trading profits) and nonreportable traders (usually small traders/speculators) as well as their open interest (contracts open in the market at time of reporting). See CFTC criteria here.