By InvestMacro
The latest update for the weekly Commitment of Traders (COT) report was released by the Commodity Futures Trading Commission (CFTC) on Friday for data ending on March 19th.
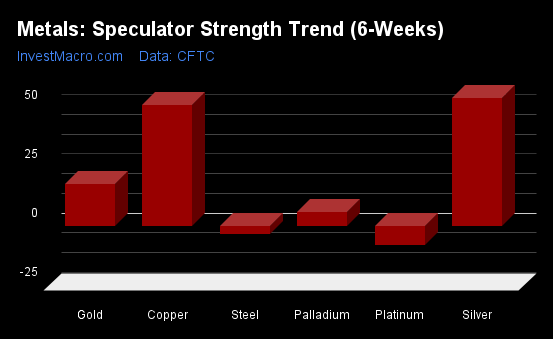
This weekly Extreme Positions report highlights the Most Bullish and Most Bearish Positions for the speculator category. Extreme positioning in these markets can foreshadow strong moves in the underlying market.
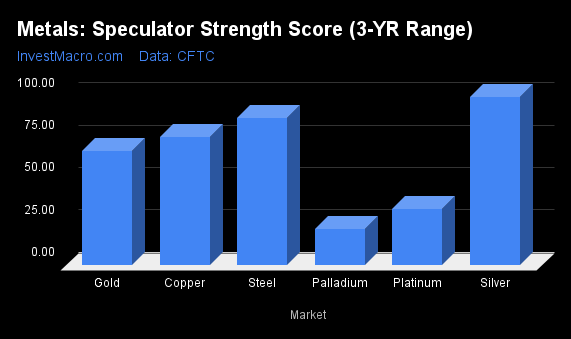
To signify an extreme position, we use the Strength Index (also known as the COT Index) of each instrument, a common method of measuring COT data. The Strength Index is simply a comparison of current trader positions against the range of positions over the previous 3 years. We use over 80 percent as extremely bullish and under 20 percent as extremely bearish. (Compare Strength Index scores across all markets in the data table or cot leaders table)
Here Are This Week’s Most Bullish Speculator Positions:
Mexican Peso
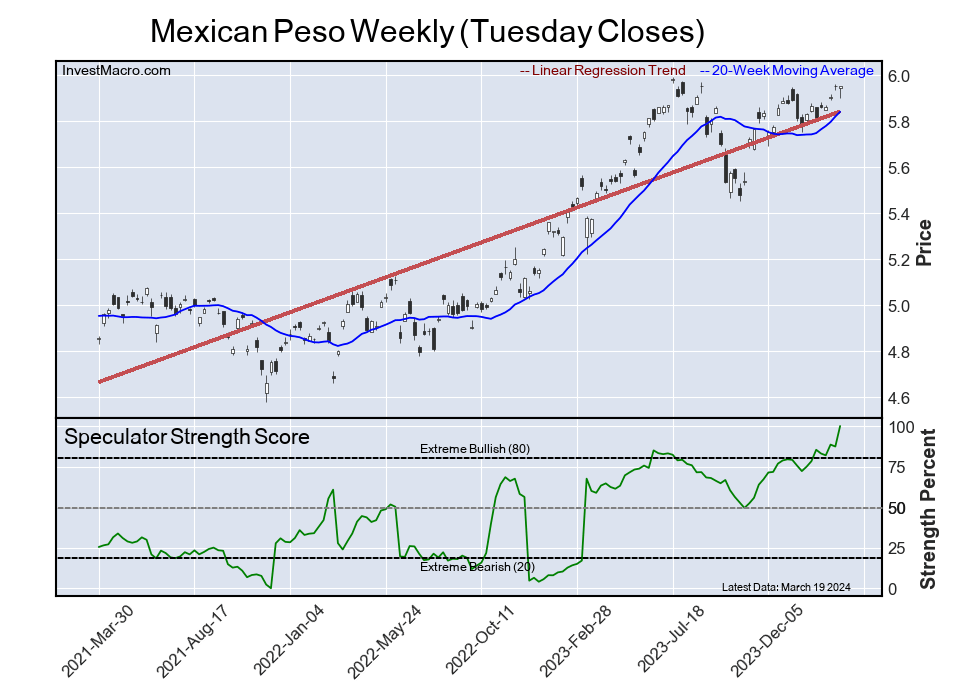
The Mexican Peso speculator position comes in as the most bullish extreme standing this week. The Mexican Peso speculator level is currently at a 100.0 percent score of its 3-year range.
The six-week trend for the percent strength score totaled 21.7 this week. The overall net speculator position was a total of 128,670 net contracts this week with a boost of 24,378 contract in the weekly speculator bets.
Speculators or Non-Commercials Notes:
Speculators, classified as non-commercial traders by the CFTC, are made up of large commodity funds, hedge funds and other significant for-profit participants. The Specs are generally regarded as trend-followers in their behavior towards price action – net speculator bets and prices tend to go in the same directions. These traders often look to buy when prices are rising and sell when prices are falling. To illustrate this point, many times speculator contracts can be found at their most extremes (bullish or bearish) when prices are also close to their highest or lowest levels.
These extreme levels can be dangerous for the large speculators as the trade is most crowded, there is less trading ammunition still sitting on the sidelines to push the trend further and prices have moved a significant distance. When the trend becomes exhausted, some speculators take profits while others look to also exit positions when prices fail to continue in the same direction. This process usually plays out over many months to years and can ultimately create a reverse effect where prices start to fall and speculators start a process of selling when prices are falling.
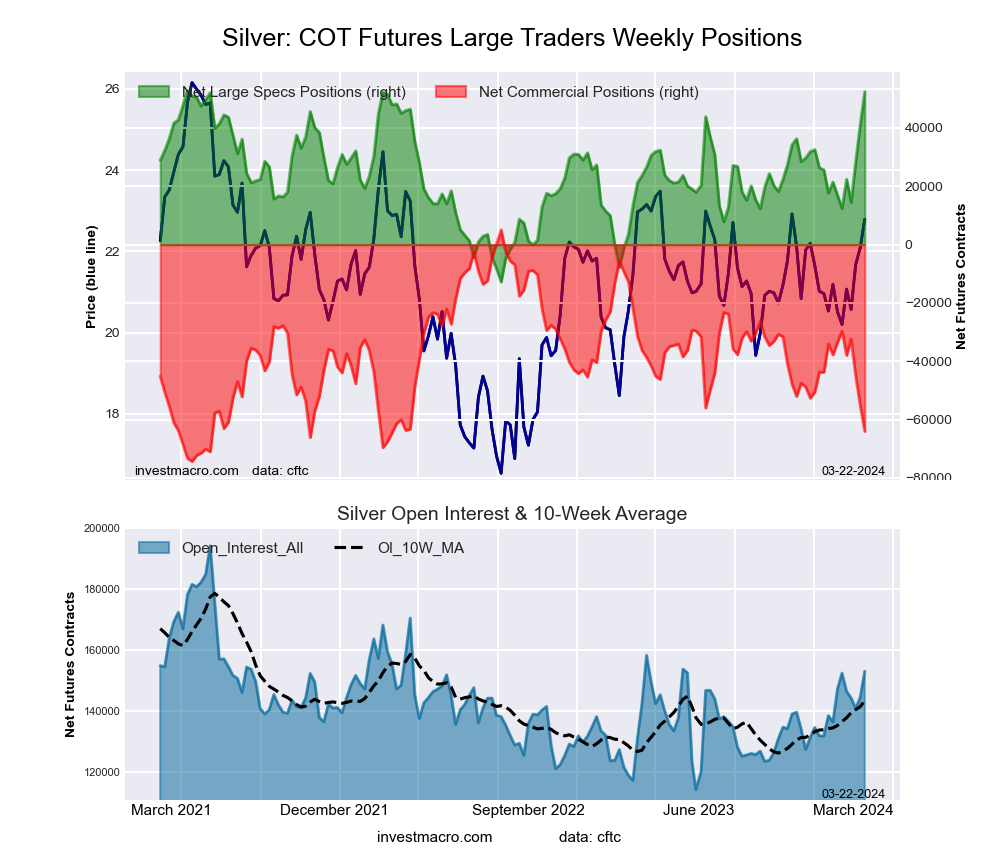
Silver
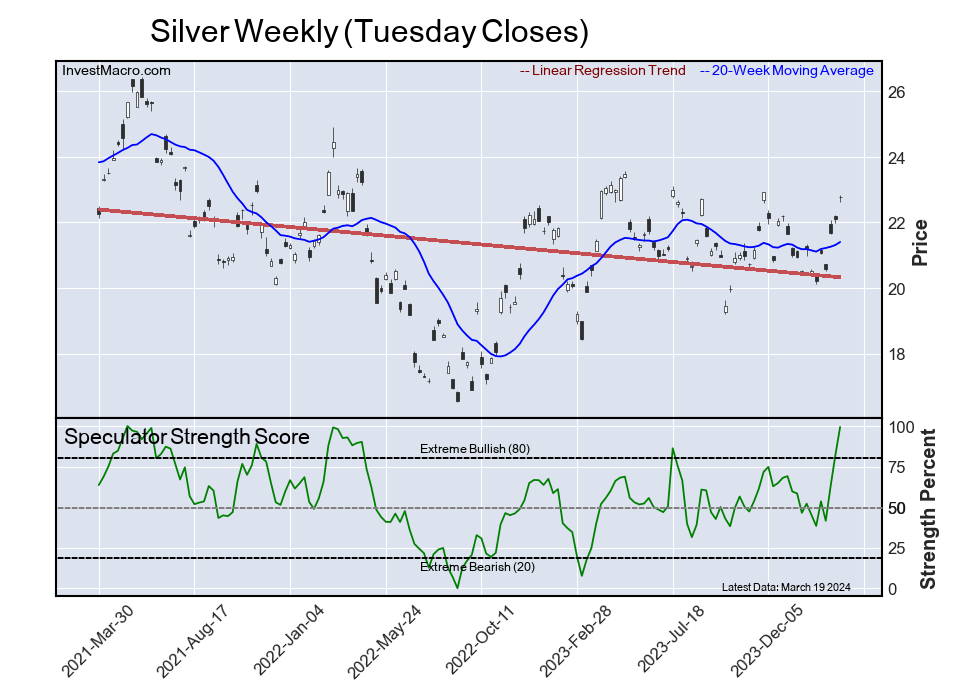
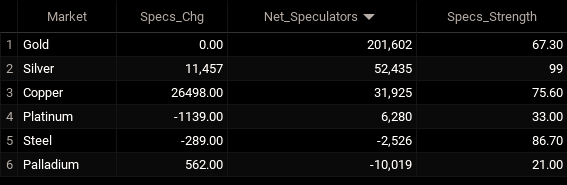
The Silver speculator position comes next in the extreme standings this week. The Silver speculator level is now at a 99.4 percent score of its 3-year range.
The six-week trend for the percent strength score was 54.2 this week. The speculator position registered 52,435 net contracts this week with a weekly gain of 11,457 contracts in speculator bets.
DowJones Mini
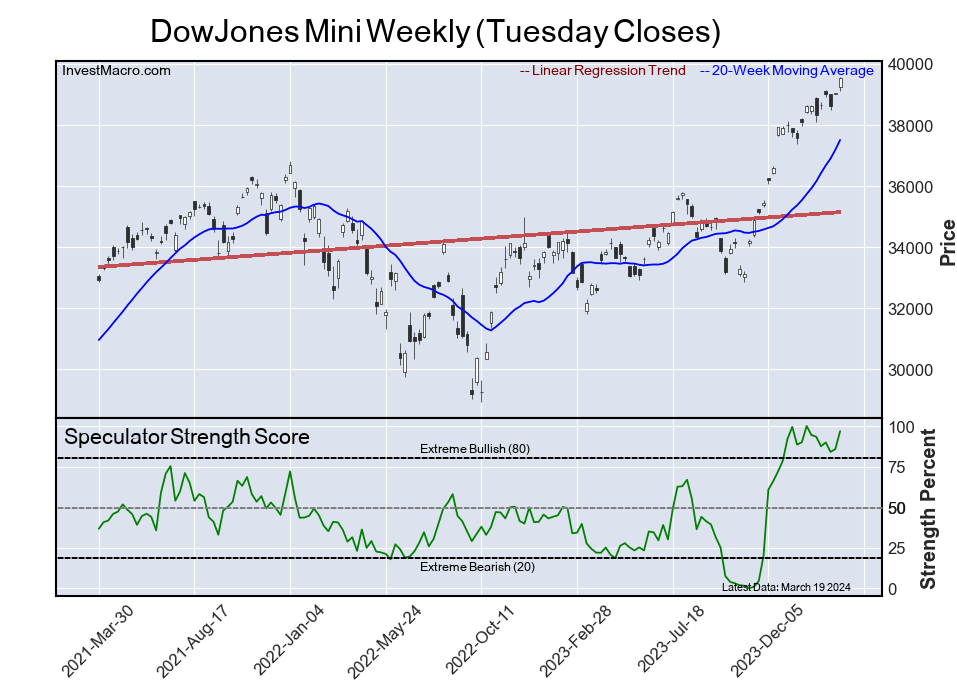
The DowJones Mini speculator position comes in third this week in the extreme standings. The DowJones Mini speculator level resides at a 96.8 percent score of its 3-year range.
The six-week trend for the speculator strength score came in at 2.4 this week. The overall speculator position was 22,445 net contracts this week with a jump of 6,774 contracts in the weekly speculator bets.
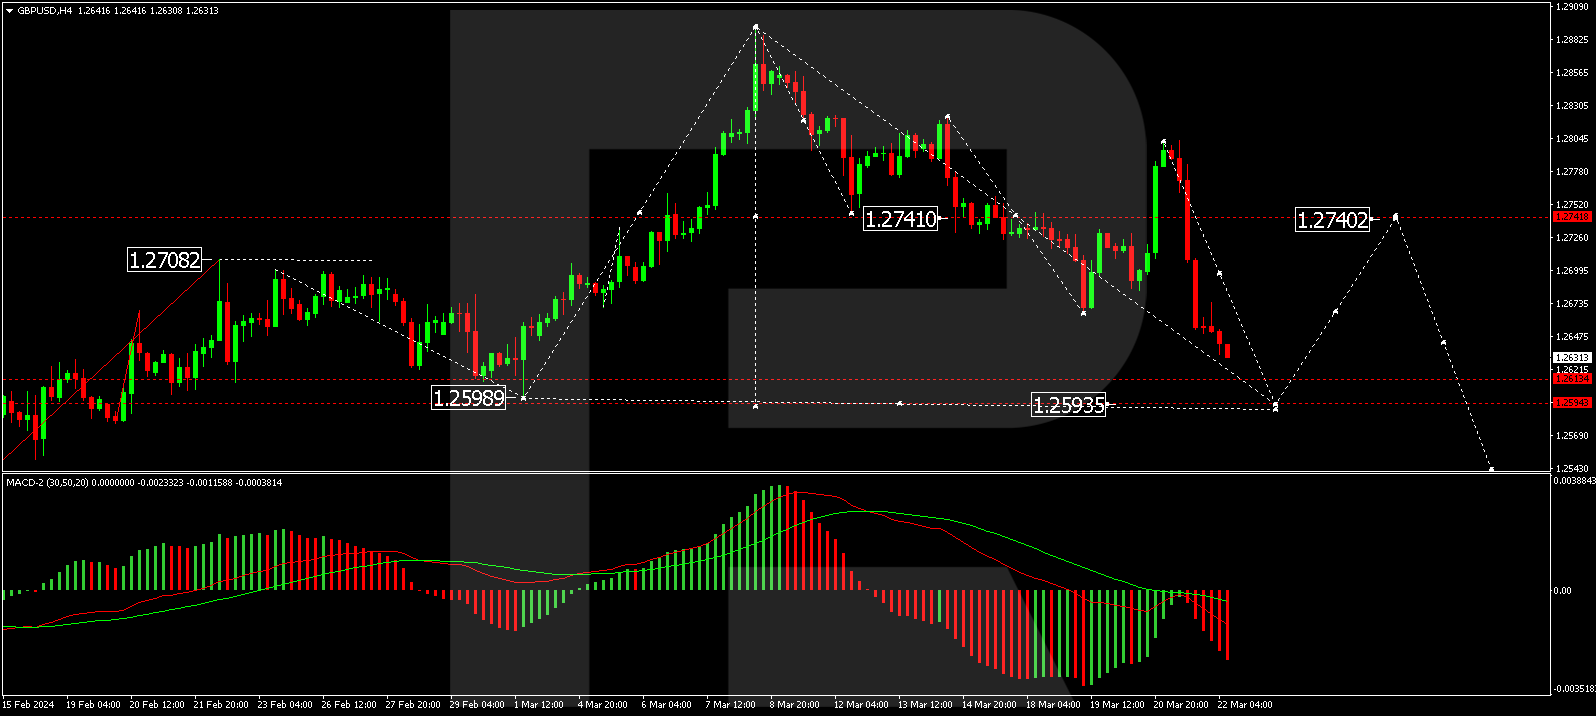
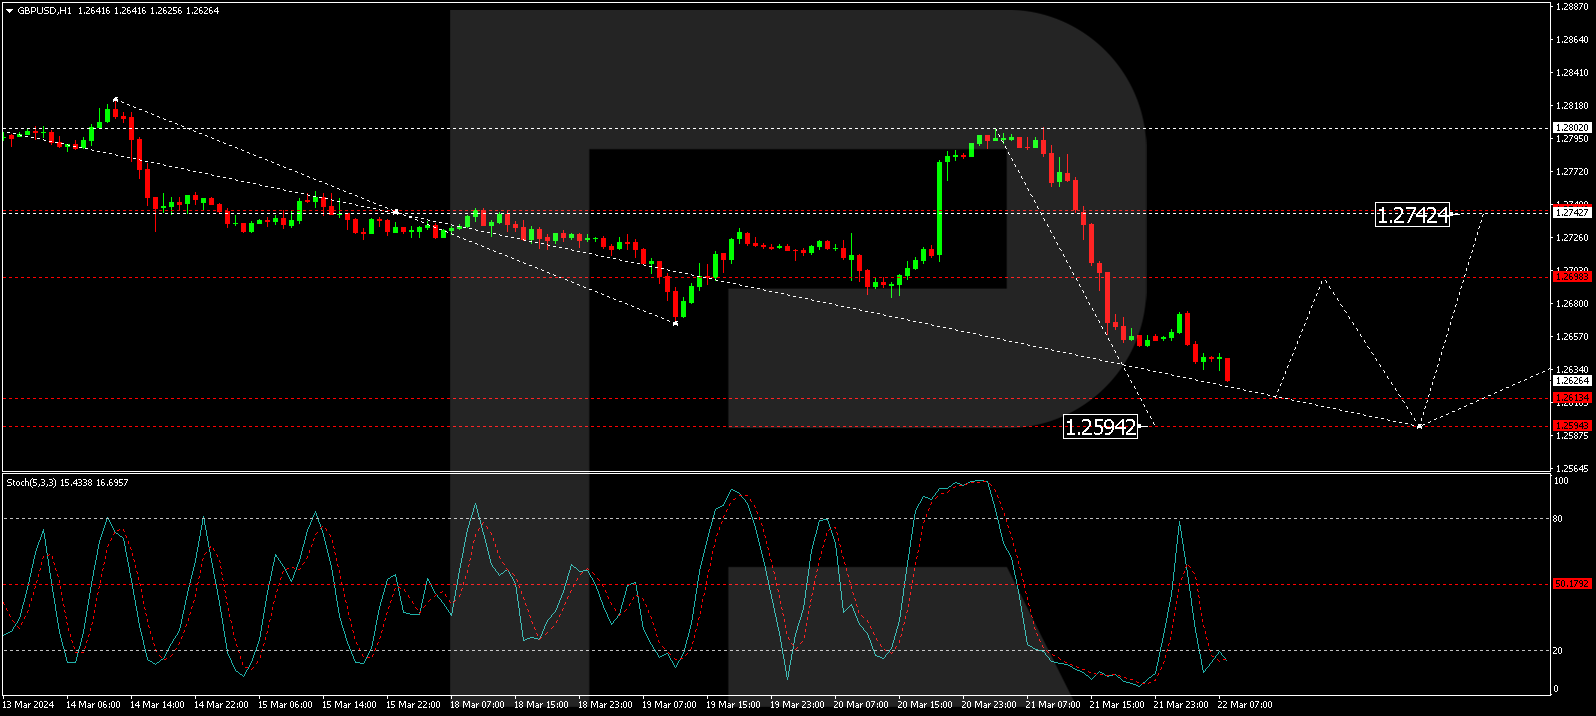
British Pound
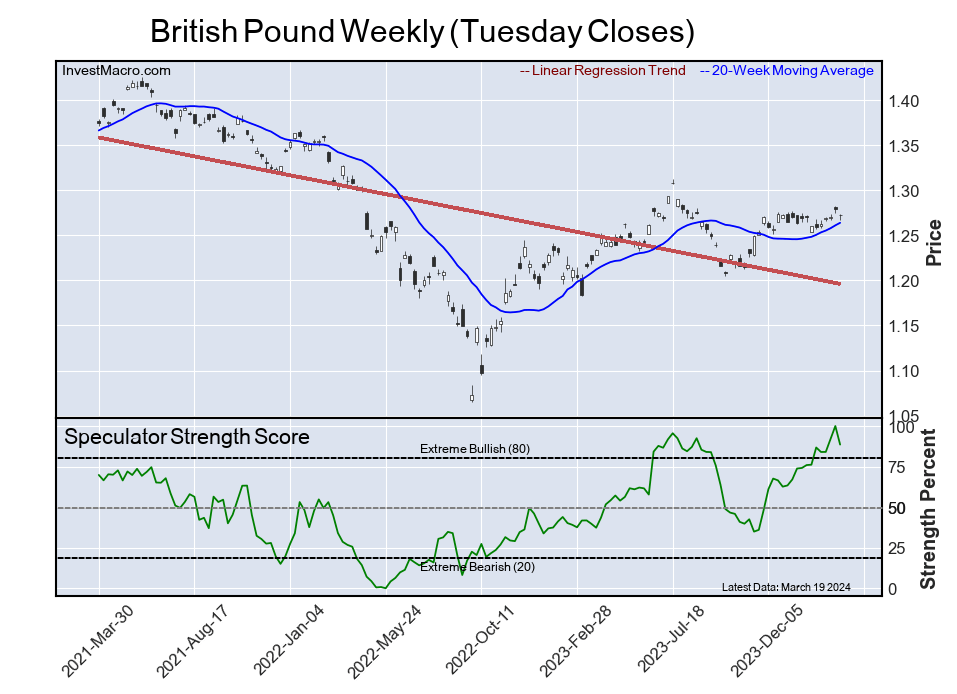
The British Pound speculator position comes up number four in the extreme standings this week. The British Pound speculator level is at a 88.6 percent score of its 3-year range.
The six-week trend for the speculator strength score totaled a change of 12.4 this week. The overall speculator position was 53,200 net contracts this week with a drop of -17,251 contracts in the speculator bets.
Gasoline
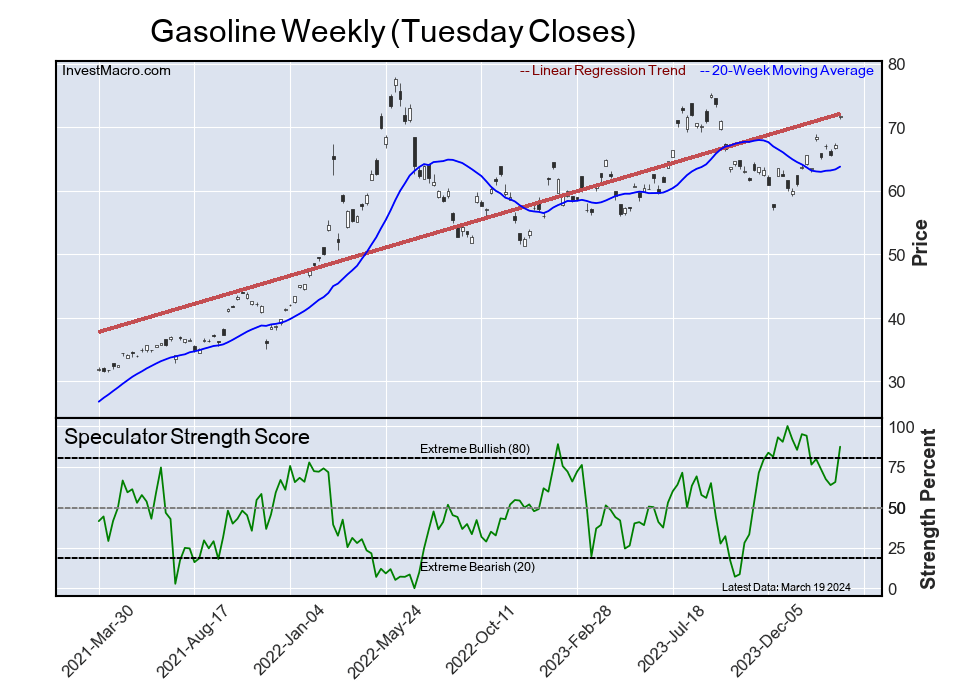
The Gasoline speculator position rounds out the top five in this week’s bullish extreme standings. The Gasoline speculator level sits at a 87.2 percent score of its 3-year range. The six-week trend for the speculator strength score was 11.0 this week.
The speculator position was 70,008 net contracts this week with an increase of 10,470 contracts in the weekly speculator bets.
This Week’s Most Bearish Speculator Positions:
Australian Dollar
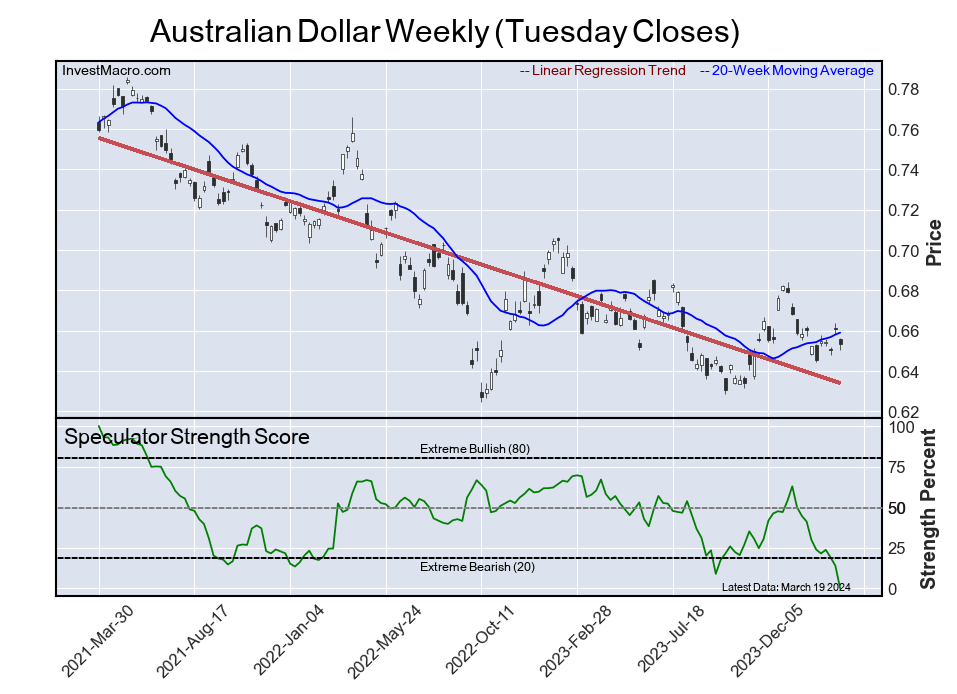
The Australian Dollar speculator position comes in as the most bearish extreme standing this week. The Australian Dollar speculator level is at a 0.0 percent score of its 3-year range.
The six-week trend for the speculator strength score was -29.8 this week. The overall speculator position was -107,538 net contracts this week with a drop of -16,698 contracts in the speculator bets.
Swiss Franc
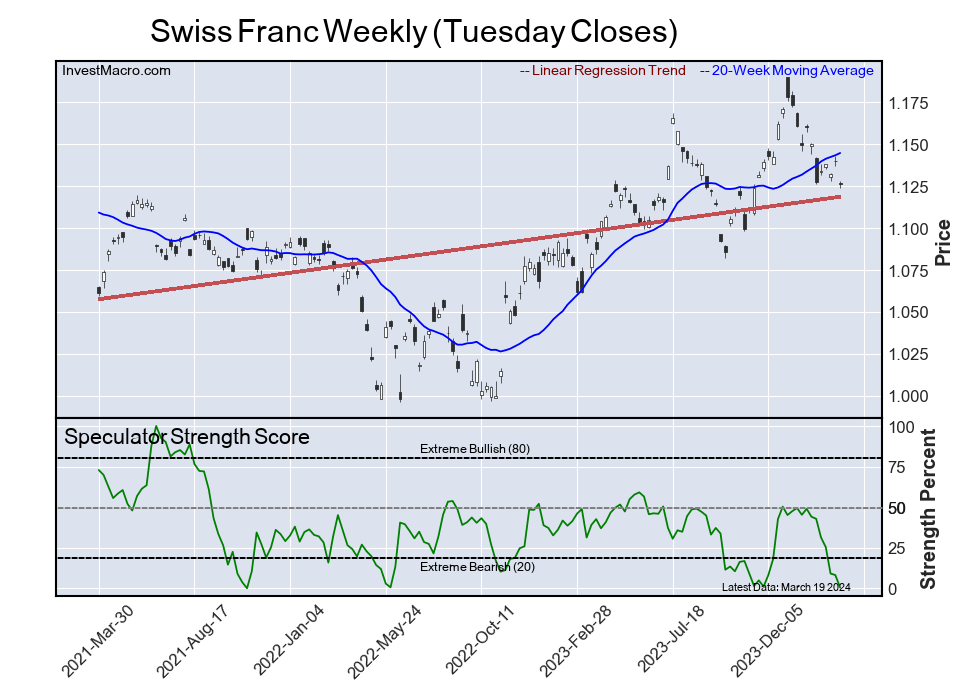
The Swiss Franc speculator position comes in next for the most bearish extreme standing on the week. The Swiss Franc speculator level is at a 0.4 percent score of its 3-year range.
The six-week trend for the speculator strength score was -43.7 this week. The speculator position was -20,500 net contracts this week with a decrease of -2,630 contracts in the weekly speculator bets.
US Dollar Index
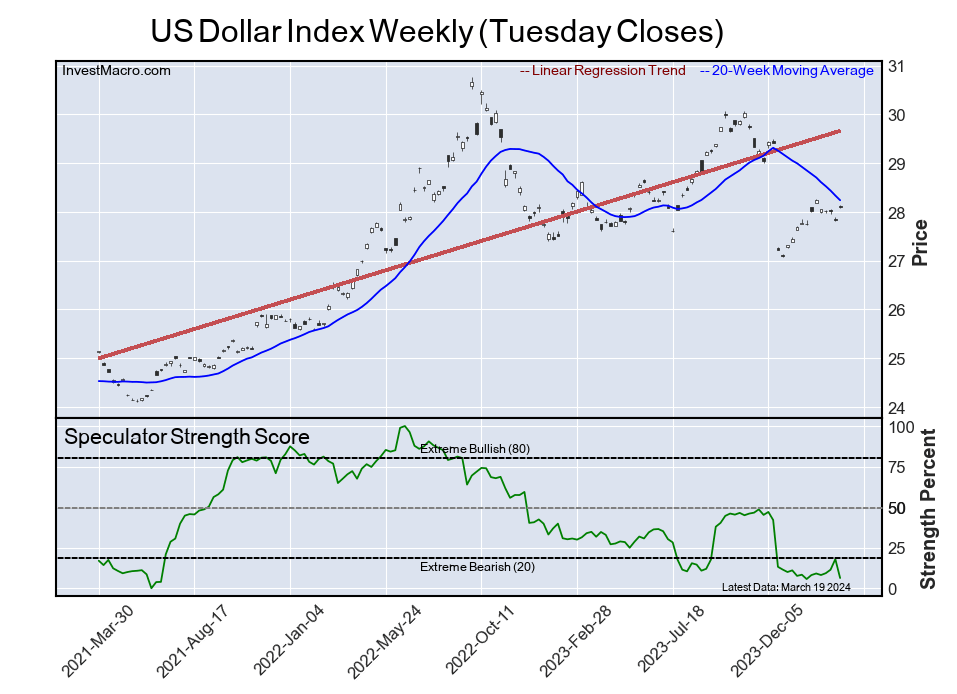
The US Dollar Index speculator position comes in as third most bearish extreme standing of the week. The US Dollar Index speculator level resides at a 6.3 percent score of its 3-year range.
The six-week trend for the speculator strength score was -1.8 this week. The overall speculator position was 679 net contracts this week with a decline of -5,507 contracts in the speculator bets.
Soybeans
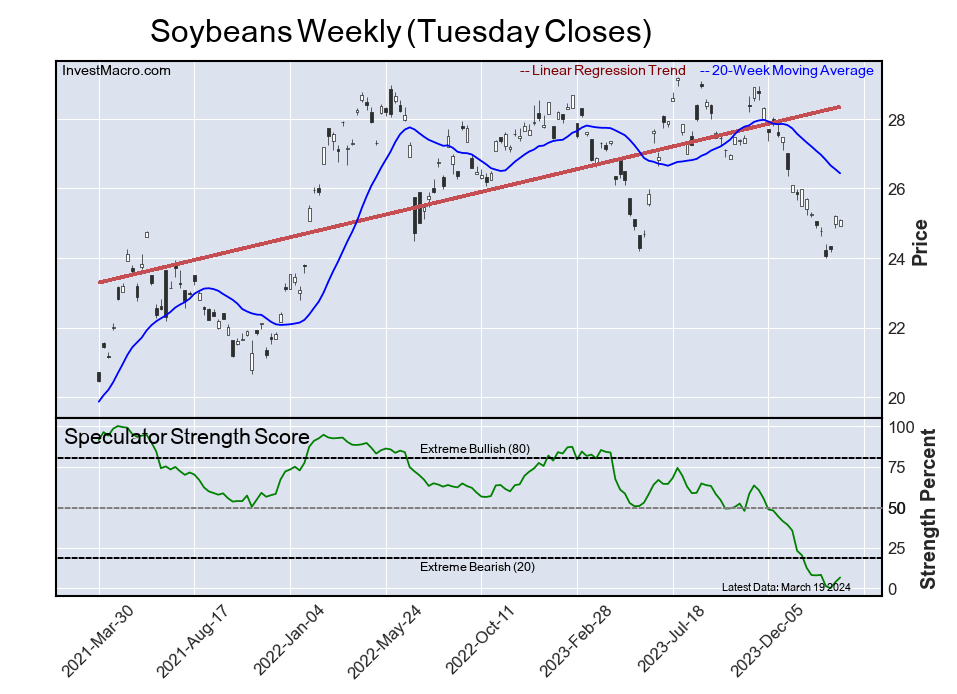
The Soybeans speculator position comes in as this week’s fourth most bearish extreme standing. The Soybeans speculator level is at a 6.6 percent score of its 3-year range.
The six-week trend for the speculator strength score was -1.5 this week. The speculator position was -167,653 net contracts this week with a rise of 12,760 contracts in the weekly speculator bets.
Soybean Meal
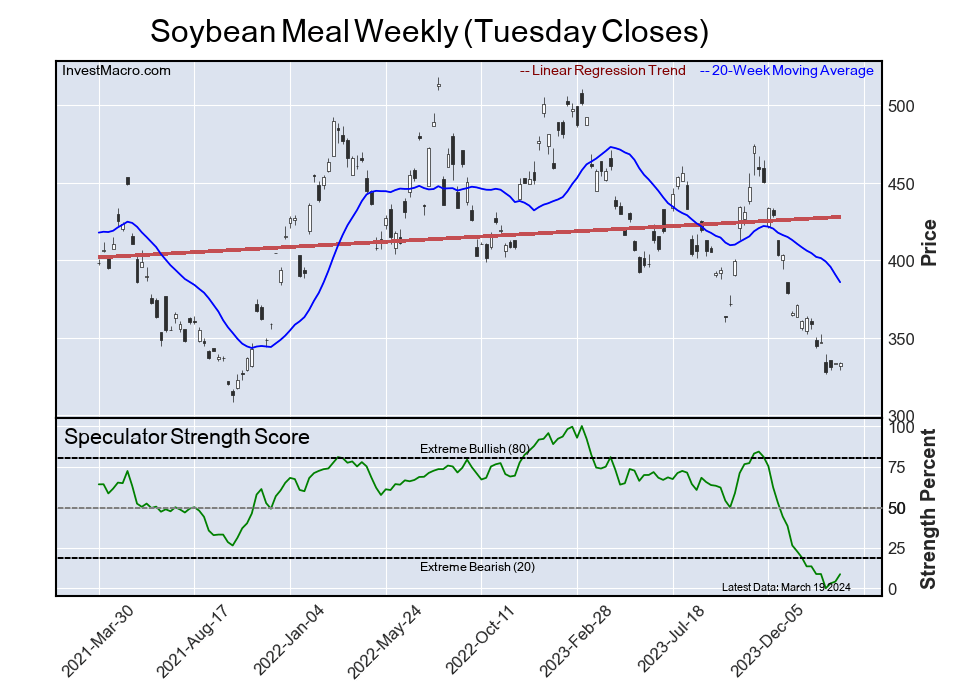
Finally, the Soybean Meal speculator position comes in as the fifth most bearish extreme standing for this week. The Soybean Meal speculator level is at a 8.7 percent score of its 3-year range.
The six-week trend for the speculator strength score was -4.8 this week. The speculator position was -45,705 net contracts this week with a gain of 11,182 contracts in the weekly speculator bets.
Article By InvestMacro – Receive our weekly COT Newsletter
*COT Report: The COT data, released weekly to the public each Friday, is updated through the most recent Tuesday (data is 3 days old) and shows a quick view of how large speculators or non-commercials (for-profit traders) were positioned in the futures markets.
The CFTC categorizes trader positions according to commercial hedgers (traders who use futures contracts for hedging as part of the business), non-commercials (large traders who speculate to realize trading profits) and nonreportable traders (usually small traders/speculators) as well as their open interest (contracts open in the market at time of reporting). See CFTC criteria here.