
By RoboForex Analytical Department
The USD/JPY pair surged to a four-month high as investors recalibrated their expectations for the Bank of Japan’s future actions. The consensus is now that the BoJ’s monetary policy will remain accommodative, even with the shift away from negative interest rates.
On Tuesday, the Bank of Japan announced its first interest rate hike in 17 years, indicating its expectation to observe favorable fiscal conditions for some time. However, the yen remains under pressure due to the significant interest rate differential between Japan and the United States.
Japan’s negative interest rate period extended over eight years. The recent decision marks a historic move following a prolonged phase of quantitative monetary easing.
The market generally believes that the Bank of Japan’s transition to a stable monetary policy is far from complete. This perspective is supported by the BoJ’s “soft” statements and the subsequent reaction of the JPY.
The yen plunged by 1% against the US dollar immediately following the BoJ’s decision and continues to weaken. The upward trend in the USD/JPY pair began in early January 2024 and has remained strong.
Free Reports:
 Get our Weekly Commitment of Traders Reports - See where the biggest traders (Hedge Funds and Commercial Hedgers) are positioned in the futures markets on a weekly basis.
 Sign Up for Our Stock Market Newsletter – Get updated on News, Charts & Rankings of Public Companies when you join our Stocks Newsletter
USD/JPY technical analysis
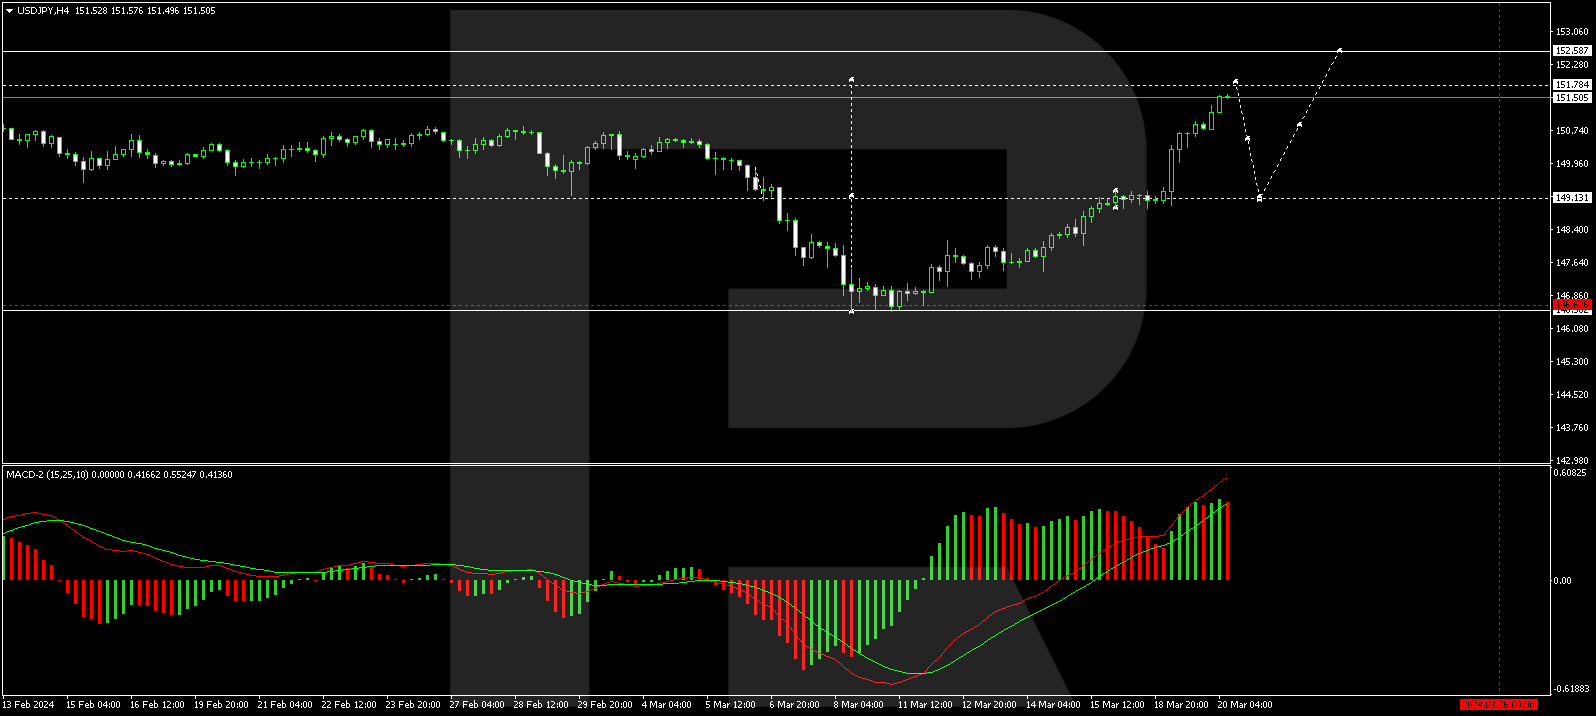
The H4 USD/JPY chart shows a consolidation range formed around the 149.13 level. With an upward breakout, the pair continues to develop a growth wave towards 151.77. A correction phase to 150.00 could follow, then a rise to 152.60. The MACD oscillator supports this scenario, with its signal line strictly pointing upwards and aiming for new highs.
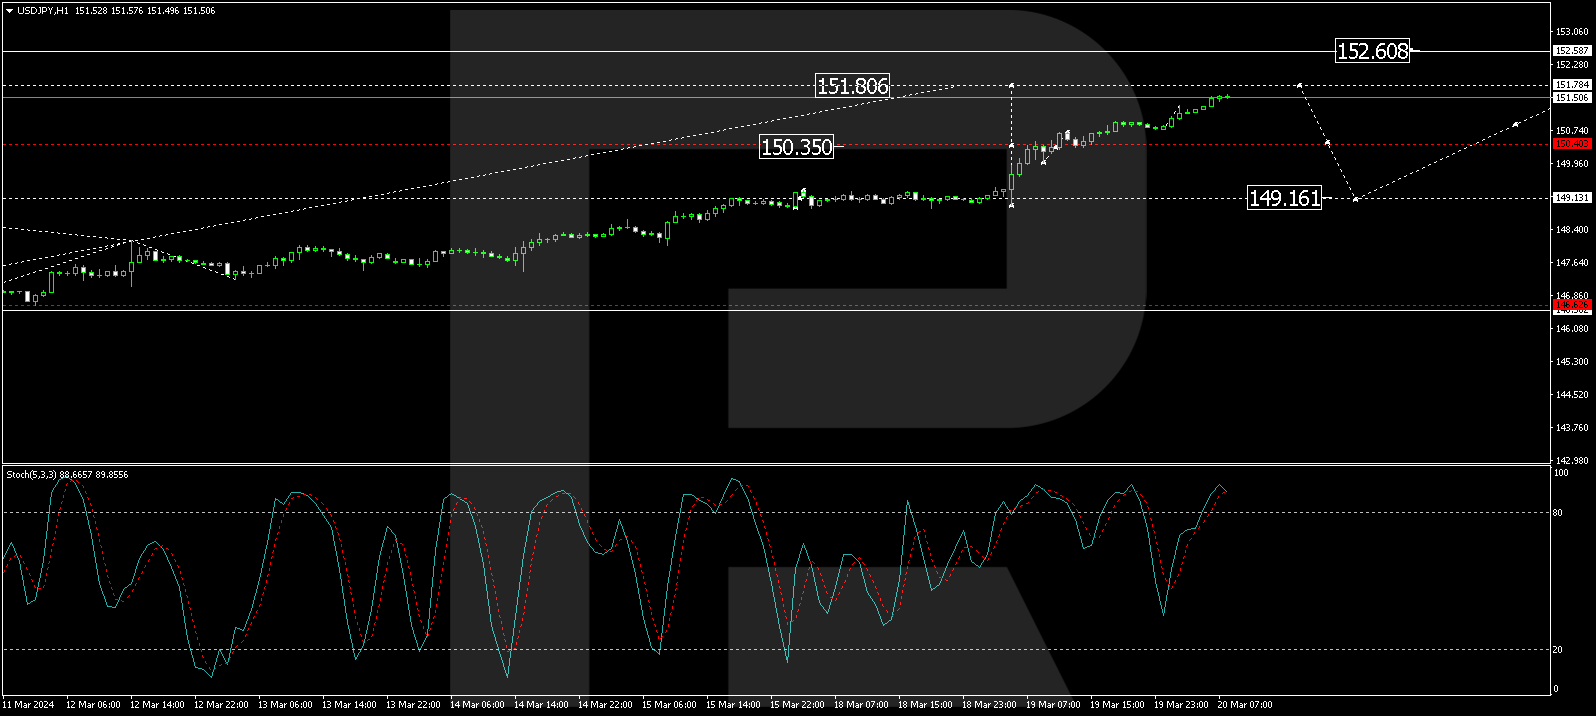
On the H1 USD/JPY chart, a narrow consolidation range has developed around the 150.40 level. Exiting upwards from this range, the growth wave continues towards 151.78. After reaching this level, a potential correction back to 150.40 (testing from above) is considered, followed by a new growth structure towards 152.60. The Stochastic oscillator corroborates this scenario, with its signal line above the 80 mark and preparing to drop to 50.
Disclaimer
Any forecasts contained herein are based on the author’s particular opinion. This analysis may not be treated as trading advice. RoboForex bears no responsibility for trading results based on trading recommendations and reviews contained herein.

- COT Metals Charts: Weekly Speculator Bets see small gains for Silver & Gold Jul 12, 2026
- COT Bonds Charts: Speculator Bets led by SOFR 3-Months & 2-Year Bonds Jul 12, 2026
- COT Energy Charts: Weekly Speculator Changes led by Brent Oil Jul 12, 2026
- COT Soft Commodities Charts: Weekly Speculator Changes led by Sugar, Corn & Soybeans Jul 12, 2026
- The US and European stock indices are rising again amid renewed investor interest in the AI industry. Jul 10, 2026
- USD/JPY Falls as Yen Recovers Weekly Losses Jul 10, 2026
- Crude oil prices surged sharply by 7% in reaction to the rapid escalation of the conflict in the Middle East Jul 9, 2026
- Middle East Tensions Weigh on Gold Jul 9, 2026
- Pound Awaits Tighter Policy from Bank of England Jul 8, 2026
- The United States carried out airstrikes on Iran after Iran’s attacked tankers in the Strait of Hormuz. The RBNZ raised the interest rate to 2.5% Jul 8, 2026