The USD/JPY pair surged to a four-month high as investors recalibrated their expectations for the Bank of Japan’s future actions. The consensus is now that the BoJ’s monetary policy will remain accommodative, even with the shift away from negative interest rates.
On Tuesday, the Bank of Japan announced its first interest rate hike in 17 years, indicating its expectation to observe favorable fiscal conditions for some time. However, the yen remains under pressure due to the significant interest rate differential between Japan and the United States.
Japan’s negative interest rate period extended over eight years. The recent decision marks a historic move following a prolonged phase of quantitative monetary easing.
The market generally believes that the Bank of Japan’s transition to a stable monetary policy is far from complete. This perspective is supported by the BoJ’s “soft” statements and the subsequent reaction of the JPY.
The yen plunged by 1% against the US dollar immediately following the BoJ’s decision and continues to weaken. The upward trend in the USD/JPY pair began in early January 2024 and has remained strong.
USD/JPY technical analysis
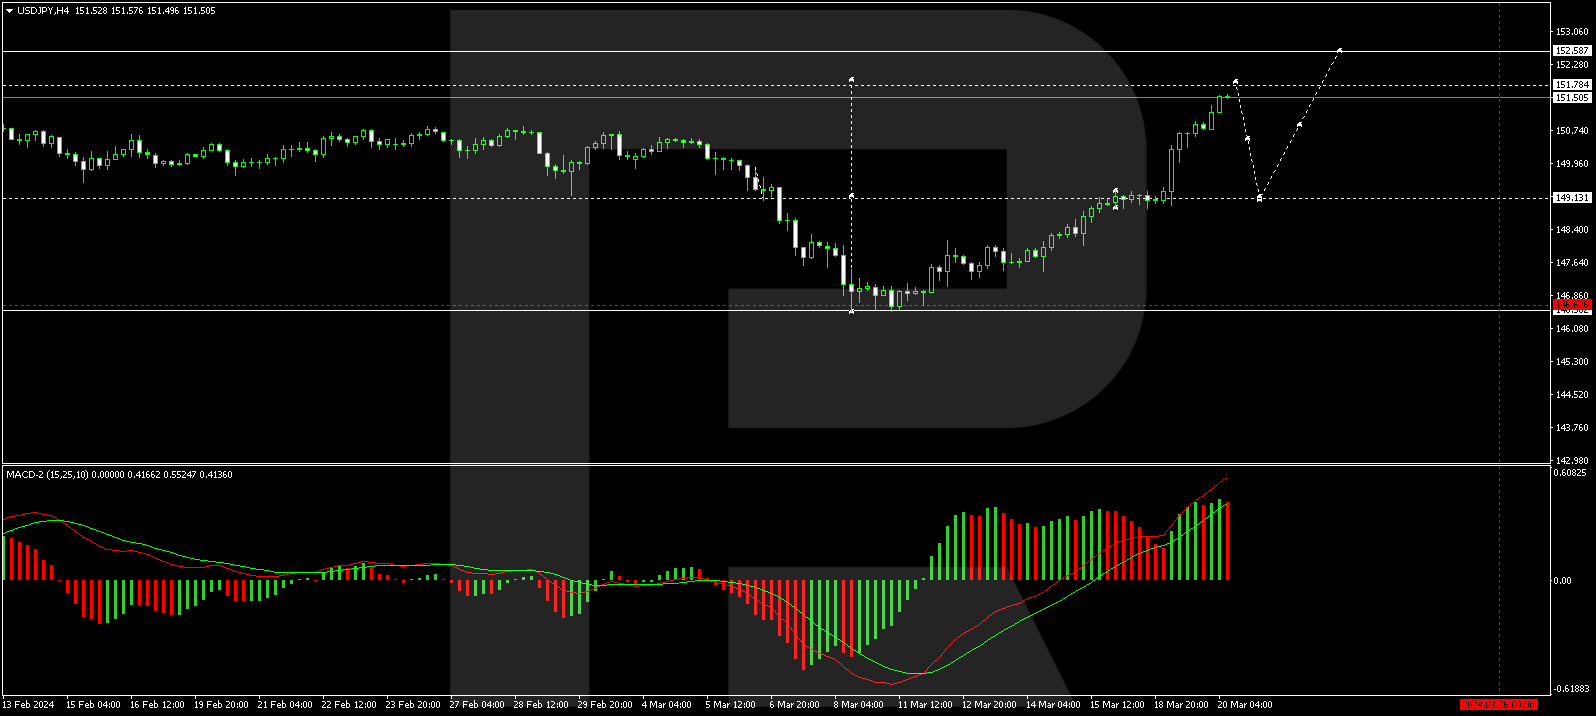
The H4 USD/JPY chart shows a consolidation range formed around the 149.13 level. With an upward breakout, the pair continues to develop a growth wave towards 151.77. A correction phase to 150.00 could follow, then a rise to 152.60. The MACD oscillator supports this scenario, with its signal line strictly pointing upwards and aiming for new highs.
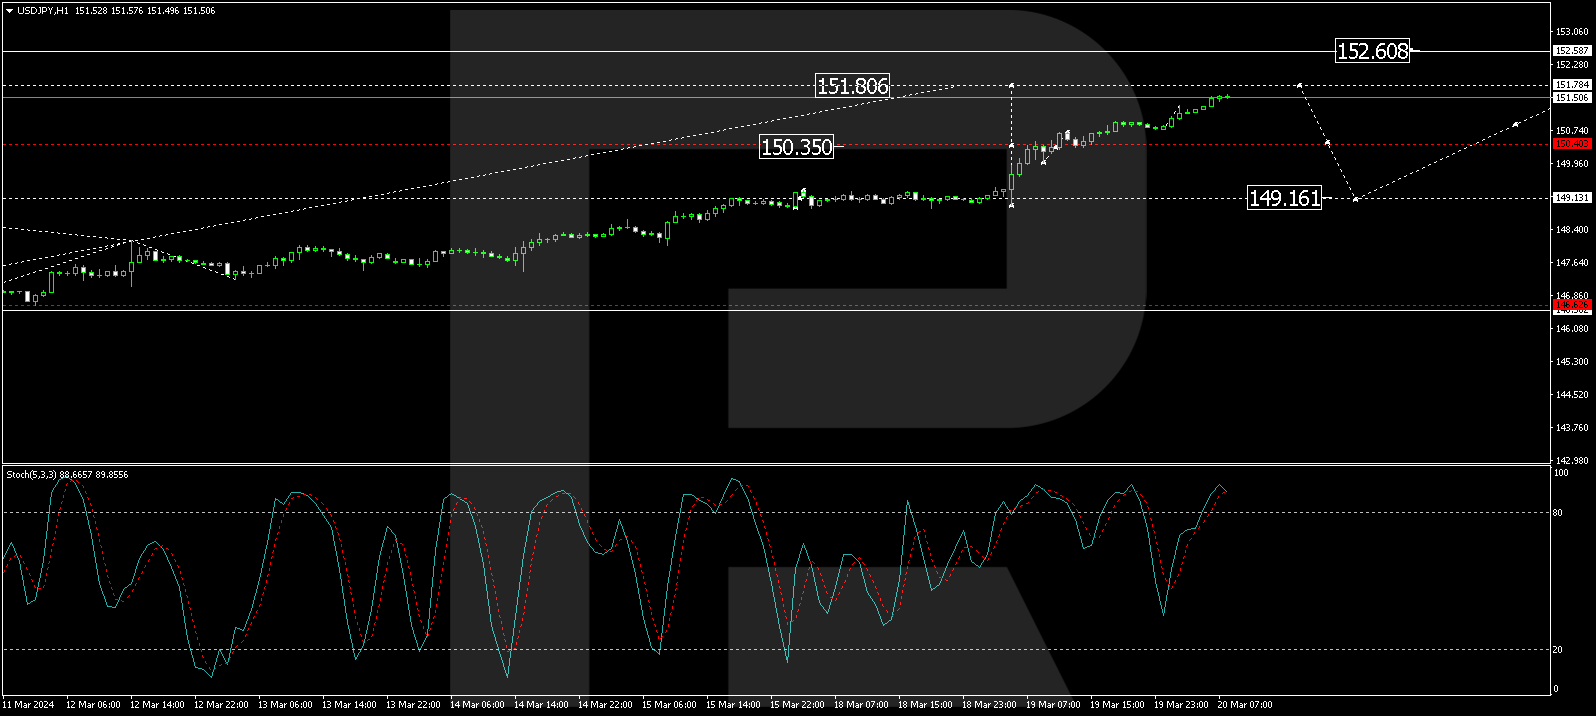
On the H1 USD/JPY chart, a narrow consolidation range has developed around the 150.40 level. Exiting upwards from this range, the growth wave continues towards 151.78. After reaching this level, a potential correction back to 150.40 (testing from above) is considered, followed by a new growth structure towards 152.60. The Stochastic oscillator corroborates this scenario, with its signal line above the 80 mark and preparing to drop to 50.
Disclaimer
Any forecasts contained herein are based on the author’s particular opinion. This analysis may not be treated as trading advice. RoboForex bears no responsibility for trading results based on trading recommendations and reviews contained herein.
Artificial intelligence’s capacity to process and analyze vast amounts of data has revolutionized decision-making processes, making operations in health care, finance, criminal justice and other sectors of society more efficient and, in many instances, more effective.
With this transformative power, however, comes a significant responsibility: the need to ensure that these technologies are developed and deployed in a manner that is equitable and just. In short, AI needs to be fair.
The pursuit of fairness in AI is not merely an ethical imperative but a requirement in order to foster trust, inclusivity and the responsible advancement of technology. However, ensuring that AI is fair is a major challenge. And on top of that, my research as a computer scientist who studies AI shows that attempts to ensure fairness in AI can have unintended consequences.
Ethically, fairness is a cornerstone of building trust and acceptance of AI systems. People need to trust that AI decisions that affect their lives – for example, hiring algorithms – are made equitably. Socially, AI systems that embody fairness can help address and mitigate historical biases – for example, those against women and minorities – fostering inclusivity. Legally, embedding fairness in AI systems helps bring those systems into alignment with anti-discrimination laws and regulations around the world.
Unfairness can stem from two primary sources: the input data and the algorithms. Research has shown that input data can perpetuate bias in various sectors of society. For example, in hiring, algorithms processing data that reflects societal prejudices or lacks diversity can perpetuate “like me” biases. These biases favor candidates who are similar to the decision-makers or those already in an organization. When biased data is then used to train a machine learning algorithm to aid a decision-maker, the algorithm can propagate and even amplify these biases.
Why fairness in AI is hard
Fairness is inherently subjective, influenced by cultural, social and personal perspectives. In the context of AI, researchers, developers and policymakers often translate fairness to the idea that algorithms should not perpetuate or exacerbate existing biases or inequalities.
However, measuring fairness and building it into AI systems is fraught with subjective decisions and technical difficulties. Researchers and policymakers have proposed various definitions of fairness, such as demographic parity, equality of opportunity and individual fairness.
Why the concept of algorithmic fairness is so challenging.
These definitions involve different mathematical formulations and underlying philosophies. They also often conflict, highlighting the difficulty of satisfying all fairness criteria simultaneously in practice.
In addition, fairness cannot be distilled into a single metric or guideline. It encompasses a spectrum of considerations including, but not limited to, equality of opportunity, treatment and impact.
Unintended effects on fairness
The multifaceted nature of fairness means that AI systems must be scrutinized at every level of their development cycle, from the initial design and data collection phases to their final deployment and ongoing evaluation. This scrutiny reveals another layer of complexity. AI systems are seldom deployed in isolation. They are used as part of often complex and important decision-making processes, such as making recommendations about hiring or allocating funds and resources, and are subject to many constraints, including security and privacy.
Research my colleagues and I conducted shows that constraints such as computational resources, hardware types and privacy can significantly influence the fairness of AI systems. For instance, the need for computational efficiency can lead to simplifications that inadvertently overlook or misrepresent marginalized groups.
In our study on network pruning – a method to make complex machine learning models smaller and faster – we found that this process can unfairly affect certain groups. This happens because the pruning might not consider how different groups are represented in the data and by the model, leading to biased outcomes.
Similarly, privacy-preserving techniques, while crucial, can obscure the data necessary to identify and mitigate biases or disproportionally affect the outcomes for minorities. For example, when statistical agencies add noise to data to protect privacy, this can lead to unfair resource allocation because the added noise affects some groups more than others. This disproportionality can also skew decision-making processes that rely on this data, such as resource allocation for public services.
These constraints do not operate in isolation but intersect in ways that compound their impact on fairness. For instance, when privacy measures exacerbate biases in data, it can further amplify existing inequalities. This makes it important to have a comprehensive understanding and approach to both privacy and fairness for AI development.
The path forward
Making AI fair is not straightforward, and there are no one-size-fits-all solutions. It requires a process of continuous learning, adaptation and collaboration. Given that bias is pervasive in society, I believe that people working in the AI field should recognize that it’s not possible to achieve perfect fairness and instead strive for continuous improvement.
This challenge requires a commitment to rigorous research, thoughtful policymaking and ethical practice. To make it work, researchers, developers and users of AI will need to ensure that considerations of fairness are woven into all aspects of the AI pipeline, from its conception through data collection and algorithm design to deployment and beyond.
As of Tuesday’s stock market close, the Dow Jones Index (US30) was up 0.83%, the S&P 500 Index (US500) added 0.56%, and the NASDAQ Technology Index (US100) closed positive 0.39%.
The Federal Open Market Committee (FOMC) will hold its Wednesday monetary policy meeting today. The Fed had initially planned to begin cutting rates in March. However, stronger than expected US inflation data (primarily producer inflation – PPI) raised concerns that the central bank may delay an interest rate cut further. As a result, the likelihood of a rate cut was pushed back first to May and then to June. Markets currently estimate the probability of a 25 bps rate cut at the March FOMC meeting at 1%, at the next meeting on May 1 at 9%, and at the June 12 meeting at 59%. The rate is expected to remain at 5.5% at the current meeting, but investors’ main focus will be the press conference. Investors will be paying attention to any clues about the prospects for a central bank rate cut, the strength of the US economy, and the possibility of an inflationary rebound. If Jerome Powell begins to back away from a rate cut this summer, it could put further pressure on the indices.
Semiconductor stocks came under pressure Tuesday after Nvidia (NVDA) unveiled new, more powerful chips for artificial intelligence. As a result, Advanced Micro Devices (AMD) shares fell more than 4%. In addition, shares of Marvell Technology (MRVL) are down more than 3%, and Intel (INTC) is down more than 1%.
Canada’s annual inflation rate slowed to 2.8% in February 2024 from 2.9% in January 2024 and was the lowest since June 2023. This result also contradicts market expectations of 3.1%, giving the Bank of Canada (BoC) more room to start easing monetary policy in the year’s second half. The Canadian dollar fell below 1.36 per dollar, hitting a nearly four-month low.
Equity markets in Europe were mostly up on Tuesday. Germany’s DAX (DE40) added 0.31%, France’s CAC 40 (FR40) gained 0.65%, Spain’s IBEX 35 (ES35) rose 0.99%, and the UK’s FTSE 100 (UK100) closed positive 0.20%. European indices rose yesterday, helped by positive Eurozone wage data. Labor costs rose slowly over a year, spurring speculation that the ECB may consider cutting interest rates later this year.
The ZEW survey of German economic growth expectations rose 11.8 to a two-year high of 31.7, beating expectations of 20.5. The German Economic Sentiment Index (ZEW) gauges the sentiment of institutional investors. It is a key indicator of business conditions. A reading above expectations is seen as positive for the European economy.
ECB Vice President Gindos said, “The ECB hasn’t yet discussed anything about future rate moves. The evolution of wages is key, and in June, we will also have our new projections and be ready to decide when to adjust our policy stance based on the data we see.” Swaps put the odds of a 25 bps ECB rate cut at 6% for the next meeting on April 11 and 82% for the June 6 meeting.
WTI crude prices fell to $82.5 a barrel on Wednesday, retreating slightly from recent highs, as investors closed some of their gains after a strong rally in oil prices ahead of the US Federal Reserve’s decision. Iraq announced plans to cut oil exports to 3.3 million bpd in the coming months to meet its OPEC+ quota, while Saudi Arabia cut crude exports for the second consecutive month. At the same time, economic data from China, including strong industrial production and retail sales figures, reinforced expectations of rising demand from the world’s largest oil importer.
Asian markets were predominantly rising yesterday. Japan’s Nikkei 225 (JP225) ended the day up 0.66%, China’s FTSE China A50 (CHA50) rose by 0.23% on Tuesday, Hong Kong’s Hang Seng (HK50) ended the day down 1.24%, and Australia’s ASX 200 (AU200) was positive 0.36%.
On Wednesday, the People’s Bank of China (PBoC) left the one-year and five-year prime rates unchanged at 3.45% and 3.95% respectively. The one-year LPR is the benchmark for most residential and corporate loans, while the five-year LPR determines most real estate mortgages. Both rates are at record lows as China’s central bank seeks to stimulate an economic turnaround amid adversity in the real estate sector and record-low consumer confidence.
S&P 500 (US500) 5,178.51 +29.09 (+0.56%)
Dow Jones (US30) 39,110.76 +320.33 (+0.83%)
DAX (DE40) 17,987.49 +54.81 (+0.31%)
FTSE 100 (UK100) 7,738.30 +15.75 (+0.20%)
USD Index 103.80 +0.37 (+0.36%)
Important events today:
– China PBoC Loan Prime Rate at 03:15 (GMT+2);
– UK Consumer Price Index (m/m) at 09:00 (GMT+2);
– UK Producer Price Index (m/m) at 09:00 (GMT+2);
– Eurozone ECB President Lagarde Speaks at 10:45 (GMT+2);
This article reflects a personal opinion and should not be interpreted as an investment advice, and/or offer, and/or a persistent request for carrying out financial transactions, and/or a guarantee, and/or a forecast of future events.
A shortage of cocoa beans has led to a near shutdown of processing plants in Côte d’Ivoire and Ghana, the two countries responsible for 60% of global production. With chocolate makers around the world reliant on west Africa for cocoa, there is significant concern about the impact on the prices of chocolate and the livelihood of farmers. Cocoa researcher Michael Odijie explains the reasons for the shortage.
Why has cocoa production declined sharply in west Africa?
Three factors are at play: environmental, economic cycle related and human.
One environmental factor is the impact of the El Niño weather phenomenon, which has caused drier weather in west Africa. It has contributed to problems on farms, such as the swollen shoot virus disease. As a result, Ghana has lost harvests from nearly 500,000 hectares of land in recent years.
The economic cycle of cocoa production refers to the inherent patterns of expansion and contraction in cocoa farming. For example, as cocoa trees age, they become susceptible to diseases, requiring high maintenance costs. Historically, farmers have tended to abandon old farms and start anew in fresh forests. Unfortunately, finding new forests is now increasingly difficult. Perhaps the most severe issue of all is the lack of fair compensation for sustainable cocoa production
The human factor includes challenges such as illegal mining, which has overtaken numerous farms in Ghana. Sometimes, farmers lease their land to illegal miners in exchange for payment. These mining activities degrade the quality of the land, making it unsuitable for cocoa cultivation.
The global market for chocolate and chocolate products is on the rise. It is projected to grow faster than 4% annually over the next few years. This growing demand for cocoa underscores the urgency in addressing the intertwined issues that relate to the industry’s sustainability.
Have west African governments intervened to help cocoa farmers?
In February 2024, the Ghana Cocoa Board (Cocobod), regulator of the country’s cocoa sector, secured a World Bank loan of US$200 million to rehabilitate plantations affected by the cocoa swollen shoot virus. The board will take over the disease-ridden farms, remove and replace the afflicted cocoa trees, and nurture the new plantings to the fruiting stage before returning them to the farmers.
This practice of Cocobod taking out loans to assist farmers is a longstanding one in Ghana. For instance, in 2018, Cocobod used part of a $600 million loan from the African Development Bank to rehabilitate aging plantations and those hit by diseases. And at the start of the current harvest season in October, the producer price was raised: farmers are paid more, a move made inevitable by the surge in global prices. Also, Ghana Cocobod has established a task force to shield cocoa farms from the harmful impacts of mining. It has cooperated with police to stem the smuggling of cocoa to neighbouring countries, particularly those that offer a stronger currency.
In Côte d’Ivoire, relatively little action has been taken. It appears the government is still assessing the situation. But there have been measures to curb smuggling of cocoa, prompted by the fact that the shortage is driving up prices in neighbouring countries. Côte d’Ivoire does benefit from numerous sustainability programmes initiated by multinational corporations. The current shortage has accelerated these initiatives. Regrettably, some of the programmes do not disclose their data, making it difficult for academics to access and analyse their information.
African governments have yet to address significant structural issues in their interventions.
How have cocoa farmers and cocoa-producing countries’ economies been affected?
At the farm level, although the rise in prices may initially appear beneficial to farmers, the reality is not straightforward. A decrease in output leads to fewer harvests on average, which means that, overall, farmers are not earning more. This issue is compounded by recent economic challenges in west Africa, such as high inflation and currency devaluation, particularly in Ghana. These factors have resulted in farmers becoming poorer.
Another impact of the output decline is a reduction in local processing. Major African processing facilities in Côte d’Ivoire and Ghana have either ceased operations or reduced their processing capacity because they cannot afford to purchase beans. This likely means that chocolate prices worldwide will surge. This, in turn, adversely affects the local production units that have been emerging in recent years.
However, the bargaining power of west African cocoa-producing countries seems to have increased. Now is an opportune moment for these nations to unite and negotiate more favourable terms for their cocoa farmers.
Will chocolate makers eventually turn to cocoa alternatives?
It’s inevitable because continuing to cultivate cocoa under current conditions is unsustainable. I don’t perceive this negatively; I hope it occurs sooner rather than later. In fact, it is already underway with the rise of cocoa butter equivalents, cocoa extenders and artificial flavours (synthetic or nature-identical flavours that mimic the taste of chocolate without the need for cocoa).
The German company Planet A Foods is a leader in this area. It produces cocoa-free chocolate, using technology to transform ingredients such as oats and sunflower seeds into substitutes for cocoa mass and butter.
Overall, this is beneficial for everyone. The demand for cocoa has resulted in mass deforestation and significant carbon emissions, issues that are likely to worsen due to climate change. Moreover, the push for cultivation has led to various forms of labour abuses. Exploring cocoa alternatives is certainly part of the solution.
Our focus falls on US crude oil which is currently hovering around levels not seen in over four months!
The global commodity is up almost 2% this week thanks to geopolitical tensions, Iraq’s pledge to cut crude exports, and the American Petroleum Institute (API) reporting a fall in US crude stockpiles.
Watch this space because more volatility could be on the cards due to the incoming Energy Information Administration (EIA) report and highly anticipated Fed rate decision.
While the central bank is widely expected to leave rates unchanged, all eyes will be on the dot projection and Powell’s press conference for clues on rate cut timings.
Oil prices could extend gains if the central bank strikes a dovish tone and signals that three rate cuts are still on the cards in 2024.
However, if the Fed sounds more hawkish than expected, signaling that US rates will remain higher for longer – oil bears may enter the scene as the dollar appreciates.
Looking at the technical picture, crude oil is currently busy with a strong impulse wave that exploded out of a previous slow and steady uptrend.
The price almost reached a weekly resistance level. This might create a short opportunity on the lower time frames.
On the 4-hour chart, an extended uptrend can be seen with a correction wave in progress. The price is close to the weekly resistance level and the manual trendline has been broken. The longer price cycle Moving Average Convergence Divergence (MACD) Oscillators is still bullish, but the signal line has been broken and this might hint at a possible overbought scenario. A market that is in an overbought state may well slow down and then a possible reversal can be on the books.
This will need to be confirmed by a lower top and then a lower bottom.
If this does happen, a possible scenario can be seen in the chart below.
When the price reaches the $81.25 level, a possible short scenario will become feasible.
Attaching a modified Fibonacci tool to the trigger level at $81.25 and dragging it above the weekly resistance level at $83.80, four conservative targets can be established:
First target at $80.22
Second target at $79.71
Third price target at $78.69
Fourth and last price target at $77.41
If the price breaks past $83.80, this opportunity is no longer valid.
The Dow Jones Index (US30) was up 0.20% at Monday’s stock market close. The S&P 500 Index (US500) added 0.63%. The NASDAQ Technology Index (US100) closed positive 0.82%. Tesla (TSLA) stock price rose more than 6% and led the S&P 500 and Nasdaq 100 stocks higher after the company announced on website X that it would raise the price of all US Model Y vehicles by $1,000 on April 1. Alphabet (GOOGL) stock is up more than 4% after it was reported that Apple is in talks to embed Google’s Gemini artificial intelligence search engine into the iPhone.
Canada’s inflation report will be released today. No changes in the figures are expected, so the Canadian dollar will likely be affected by volatility. However, any deviations from the consensus forecast could trigger a strong rally. Remember that when inflation rises, the domestic currency tends to strengthen on expectations of a more hawkish central bank stance.
Equity markets in Europe were mostly down on Monday. Germany’s DAX (DE40) was down 0.02%, France’s CAC 40 (FR40) fell by 0.20% yesterday, Spain’s IBEX 35 (ES35) decreased by 0.01% and the UK’s FTSE 100 (UK100) closed negative 0.06%.
ECB Governing Council spokesman de Kos said yesterday that the ECB has achieved its goal of bringing inflation to 2%, which is compatible with an interest rate cut in the near term. Swaps put the odds of a 25 bps ECB rate cut at 7% at the next meeting on April 11 and 80% at the June 6 meeting.
Silver gained support yesterday on the back of global economic news on Monday. This news showed that February industrial production in China rose more than expected and that the March NAHB housing market index in the US unexpectedly rose, which is favorable for industrial metals demand.
Asian markets were up yesterday. Japan’s Nikkei 225 (JP225) ended the day up 2.67%, China’s FTSE China A50 (CHA50) added 0.57%, Hong Kong’s Hang Seng (HK50) jumped by 0.97% on the day, and Australia’s ASX 200 (AU200) was positive 0.07%. Chinese stocks rose on Monday as data showed that retail sales, industrial production, and fixed asset investment in China rose more than expected in the year’s first two months. Traders now await tomorrow’s People’s Bank of China’s (PBoC) decision on one-year and five-year loans. No changes are expected, but volatility on Asian indices could rise markedly.
The Bank of Japan (BoJ) raised interest rates to 0% from 0.1% for the first time since 2007, ending eight years of negative rates amid rising wages and high inflation. The central bank also abandoned its policy of controlling the yield curve, no longer targeting 10-year bond yields. In addition, the board agreed to stop buying ETFs and J-REITs and to gradually reduce its purchases of commercial paper and corporate bonds, with plans to stop buying bonds completely in about a year.
The Reserve Bank of Australia (RBA) left rates unchanged at 4.35%, as expected, but retracted its previous warning that further rate hikes were not ruled out. This indicates confidence that inflation will continue to fall and raises bets that the RBA may start cutting rates later this year. Markets are pricing in the first rate cut in August, predicting 40 basis points of overall easing this year.
S&P 500 (US500) 5,149.42 +32.33 (+0.63%)
Dow Jones (US30) 38,790.43 +75.66 (+0.20%)
DAX (DE40) 17,932.68 −3.97 (−0.02%)
FTSE 100 (UK100) 7,722.55 −4.87 (−0.06%)
USD Index 103.58 +0.15 (+0.15%)
Important events today:
– Japan BoJ Interest Rate Decision at 04:30 (GMT+2);
– Japan BoJ Monetary Policy Statement at 04:30 (GMT+2);
– Australia RBA Interest Rate Decision at 05:30 (GMT+2);
– Australia RBA Rate Statement at 05:30 (GMT+2);
– German ZEW Economic Sentiment (m/m) at 12:00 (GMT+2);
– Eurozone ZEW Economic Sentiment (m/m) at 12:00 (GMT+2);
– US Building Permits (m/m) at 14:30 (GMT+2);
– Canada Consumer Price Index (m/m) at 14:30 (GMT+2).
This article reflects a personal opinion and should not be interpreted as an investment advice, and/or offer, and/or a persistent request for carrying out financial transactions, and/or a guarantee, and/or a forecast of future events.
SG20 has highest dividend yield of all FXTM stock indices
SG20: most stable Asian stock index within FXTM universe
SG20 has strong positive correlation with spot gold
Wall Street forecasts that this stock index could rise by another 14%
FXTM’s new SG20 index may be enticing for range traders who enjoy consistent cash payouts.
What is a stock index?
Imagine a stock index being a basket of many different stocks.
The index measures the overall performance of those stocks inside that “basket”.
What does the SG20 stock index track?
FXTMs SG20 stock index tracks the performance of the MSCI Singapore Index.
Note that this MSCI Singapore index is not the same as the benchmark Straits Times index, which is maintained by the FTSE.
This MSCI Singapore index aims to capture the overall performance of 22 different large- and mid-cap stocks in Singapore.
Together, those 22 stocks make up about 85% of the entire Singaporean stock market.
3 key things to know about the SG20 index:
1) Singaporean banks are the largest members of this index
Singapore is a city-state that is also known for its status as a “safe haven”, especially for the Asian region.
As a result, its financial sector tends to attract outsized fund inflows, benefitting its banks.
No surprise then that DBS Group, OBCB Bank, and UOB, combine to make up nearly half (48.17%) of the entire SG20 index.
2) Least volatile Asian stock index within FXTM universe
Of the 6 different Asian stock indices, the SG20 index has the lowest 30-day volatility figure, as of today (Tuesday, March 19th).
SDG20: 10.9
TWN: 13.2
JP225: 15.8
CN50: 17.1
HK50: 23.6
CHINAH: 27.5
Here are more data points to showcase the SG20 index’s relative stability:
SG20 index is faring better than Singapore’s benchmark Straits Times index
The SG20 index is up 1.25% so far in 2024.
Compare that to Singapore’s benchmark stock index (FTSE Straits Times index), which has dropped by by more than 2% so far in 2024.
While the performance of Singaporean stocks are in stark contrast to the many stock indices around the world that have printed fresh record highs this year …
SG20 index appears to putting in a relatively steady shift so far this year.
SG20 index has a strong correlation with gold
To buffer the notion of Singapore as a “safe haven”, this SG20 index tends to mirror the performance of another famed “safe haven” asset: gold.
Over any given 5-day period from the past 20 years, both XAUUSD (gold) and this SG20 index have moved in the same direction 51% of the time (positive correlation.
NOTE: According to Bloomberg data, gold and SG20 have a positive correlation of 0.51, over a rolling 5-day period from the past 20 years. A number of 0.5 or higher indicates a strong correlation.
3) SG20 has highest dividend yield of all FXTM Stock Indices
Over the past 12 months, this SG20 index has paid out a dividend yield of 4.7% (based on current prices).
That’s significantly higher than the dividend yields currently offered by other popular stock indices (based on current prices):
UK100: 4%
EU50: 2.9%
JP225: 1.6%
US500: 1.4%
NAS100: 0.8%
But wait, there’s more!
Over the next 12 months, Wall Street analysts forecast that members of the SG20 index will pay out EVEN MORE dividends.
This is expected to bring the forward 12-month yield up to 4.9%.
What is a “dividend yield”?
Dividend yield is a % number representing how much money an investor gets for buying and holding an asset.
The higher the yield, the more dividends the investor receives, as a ratio of what was originally invested.
Dividends are cash rewards that are given by companies (in this case, companies that are included in the SG20 index) to its shareholders.
Hence, holders of assets linked to the SG20 index, such as Exchange-Traded Funds (ETF) or even Contracts for Differences (CFD), often are entitled to similar dividends as well.
Where’s SG20 headed next?
Over the next 12 months, Wall Street analysts predict this SG20 index could return to the 330 mark.
From current prices, this implies about 14% in potential gains.
For proper context, a number around 330 would only restore the SG20 index to levels not seen since 2022.
That would still pale in comparison to the SG20 index’s all-time intraday high of 481.23 posted 10th October 2007, before the Global Financial Crisis.
SG20 bulls (those hoping that prices will rise) will be hoping that the Asian “safe haven” economy can continue registering steady growth, benefitting the city-state’s financial sector along the way.
If such an outlook proves true, then …
Traders and investors may yet enjoy more gains amid less-volatile prices, while collecting healthy dividends along the way.
Brent crude oil continues its rally, reaching peak values since early November 2023, with prices around USD 87.00 per barrel. Investor concerns over commodity supply, particularly due to tensions in several oil-producing countries, significantly influence quotes by incorporating potential supply disruptions.
Iraq has announced a reduction in crude oil exports to 3.300 million barrels per day soon to compensate for OPEC+ quota implementations. This reduction marks the second consecutive month of export decreases, including in Saudi Arabia, where exports dropped to 6.297 million barrels per day from the previous 6.308 million.
Despite these cuts, global demand for energy remains high. Recent statistics from China have shown a confident retail sales and industrial production sector and a stable outlook for oil demand this year.
It is important to note that a five-session rally of the US dollar could act as a headwind for the oil market. The American currency is at a two-week high against its major counterparts, making commodity purchases more expensive for investors holding other currencies.
Market projections concerning demand for aviation fuel during the summer season are not very confident at this time. There is a risk this could affect the global upward trend in oil. Due to increased summer travel activity, world prices for aviation fuel in Q3 2024 are expected to be 5-6% higher than previous forecasts, reaching around USD 111.00 per barrel. However, the number of flights remains low due to the global economic situation, which could pressure the market and the cost of aviation fuel.
Brent Technical Analysis
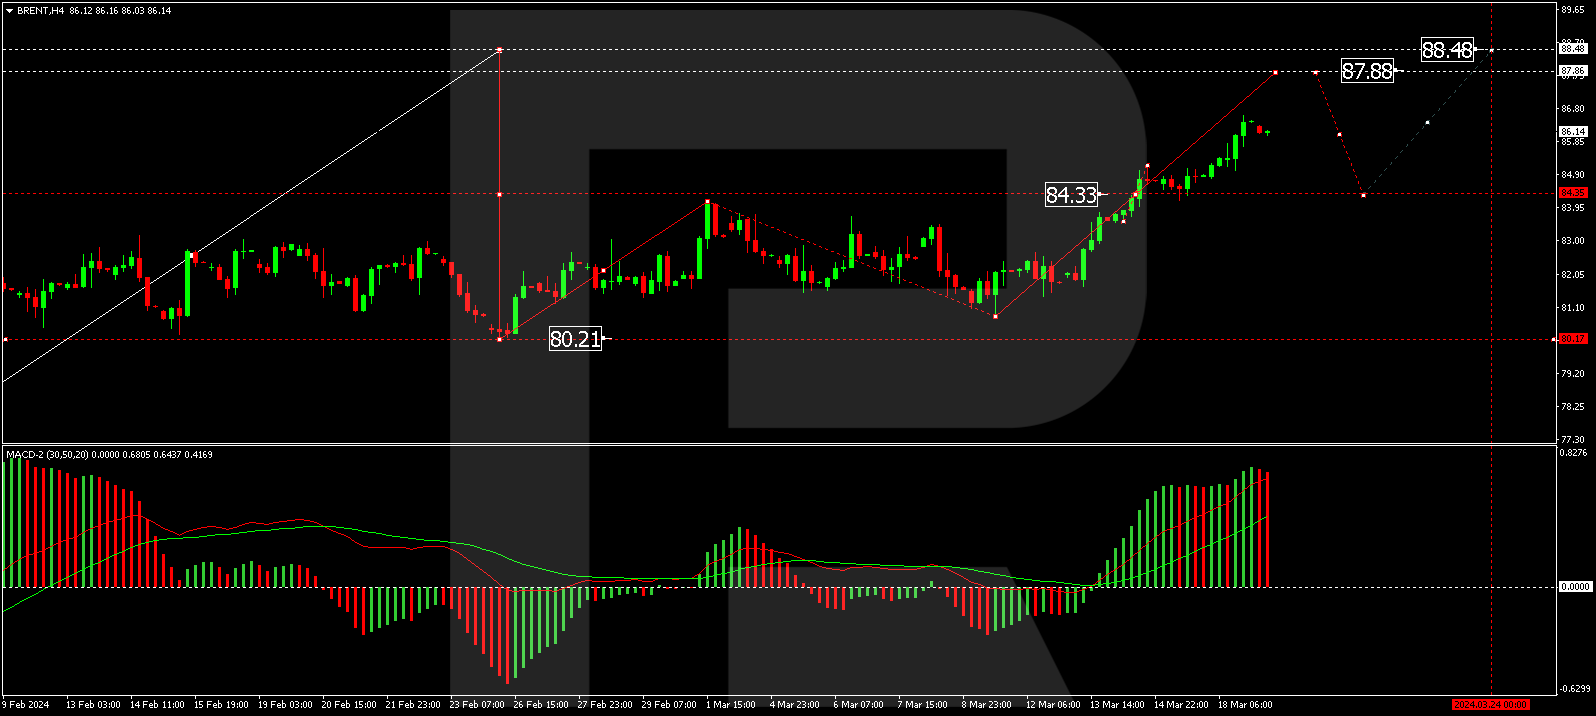
The H4 Brent chart has formed a consolidation range around 84.33, with the market breaking upward to 86.60. A decrease to 85.70 could occur today, followed by a new growth structure towards 87.87, a local target. A correction back to 84.33 might follow, then an increase to 88.48 as the first target. The MACD indicator supports this scenario, with its signal line above zero and poised to reach new highs.
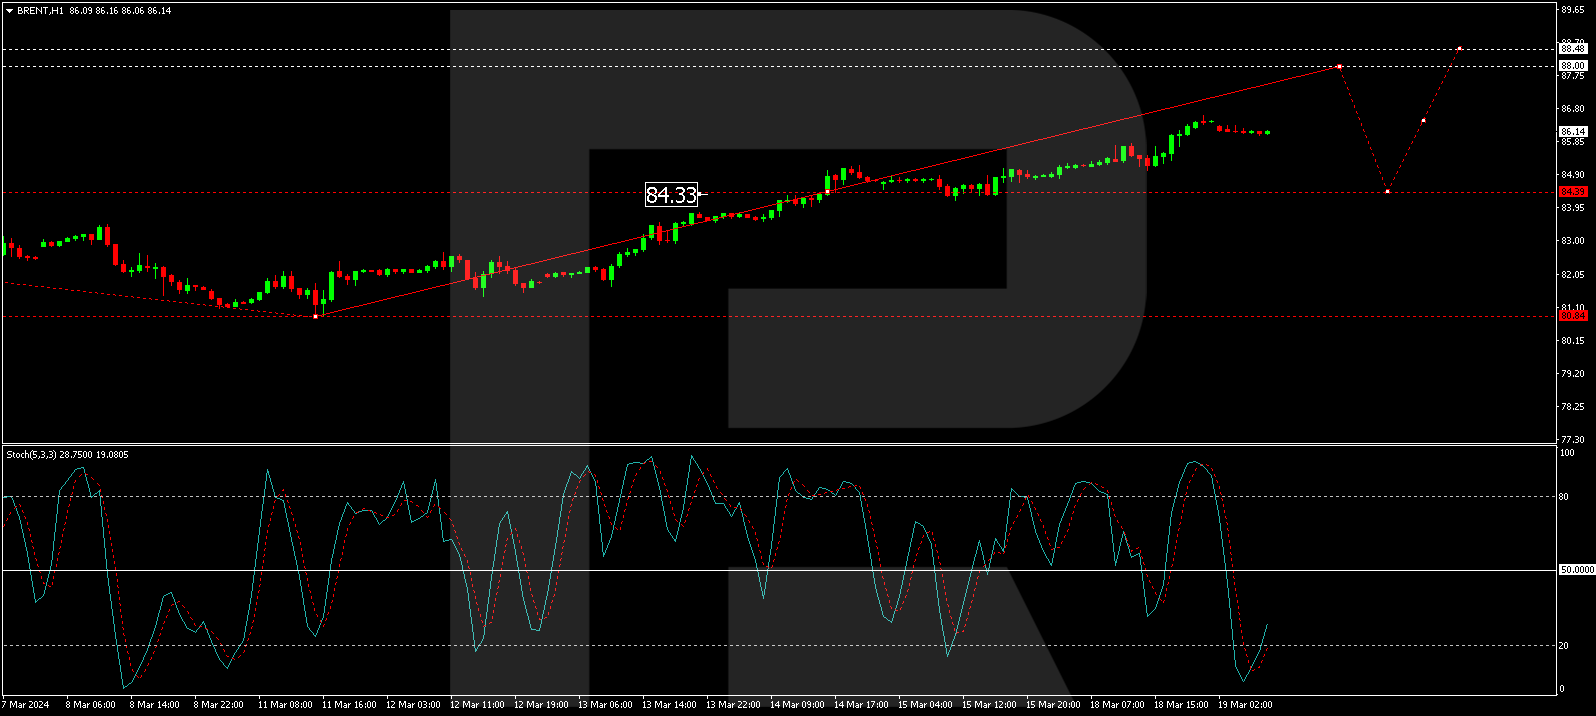
On the H1 Brent chart, a growth wave structure towards 88.00 is forming. This is a local target, following which a correction to 84.40 (testing from above) is considered, with expectations for the continuation of the growth wave to 88.50. This scenario is technically supported by the Stochastic oscillator, whose signal line is below 20, indicating the start of a rise towards 50 with the potential to continue to 80.
Disclaimer
Any forecasts contained herein are based on the author’s particular opinion. This analysis may not be treated as trading advice. RoboForex bears no responsibility for trading results based on trading recommendations and reviews contained herein.
Our focus falls on the EURCHF which could be rocked by the EU data dump and Swiss National Bank (SNB) rate decision this week.
The minor currency pair remains bullish on the daily/weekly timeframe with prices approaching a key resistance level at 0.9700.
Note: The last time the EURCHF secured a weekly close above 0.9700 was back in July 2023.
With volatility likely to remain the name of the game for the EURCHF, a major breakout could be on the horizon.
Here are 3 factors to keep an eye on:
SNB rate decision
The SNB is widely expected to keep interest rates unchanged at 1.75% on Thursday. So, investors will direct their attention towards the policy statement, news conference, and CPI projections for clues on the central bank’s next move.
Given how economic growth held steady and 0.3% in Q4 and inflation edged down to 1.2% in February, the SNB is expected to move ahead with its first rate cut at the next policy meeting in June.
Traders are currently pricing in a 25% probability of a 25-basis point SNB cut in March with a cut fully priced in by June 2024.
The CHF could weaken if the SNB strikes a dovish note and signals that the next move will be a rate cut. Such an outcome may push the EURCHF higher.
Should the SNB sound more hawkish than expected and offer no fresh clues on rate cuts, this may support the Swiss Franc, dragging the EURCHF lower as a result.
Key EU data
This is a week packed with top-tier economic data from Europe which could impact bets around when the ECB will start cutting interest rates in 2024.
On Monday, the Eurozone inflation in February was confirmed at 2.6% year-on-year, down from the 2.8% seen in January. While this was the lowest rate in three months, it’s still above the ECB’s target of 2%. It will be wise to keep a close eye on the Eurozone consumer confidence and PMIs along with top data on Germany, the largest economy in Europe.
Traders are currently pricing in an 80% probability of a 25-basis point ECB cut by June with a cut fully priced by July 2024.
Should overall data from Europe support expectations around the ECB cutting interest rates by Summer, this is likely to weaken the euro – sending the EURCHF lower.
A positive set of economic reports that push back rate cut bets may support the EUR, sending the EURCHF towards the 0.9700 resistance.
Technical forces
The EURCHF is respecting a bullish channel on the daily timeframe and trading above the 50, 100 and 200-day SMA.
A solid breakout and daily close above 0.9640 may open a path towards 0.9700 – a level not seen since July 2023.
Should prices slip below 0.9590, this could trigger a selloff towards the 200-day SMA at 0.9558 and 0.9530.
Bloomberg’s FX model points to a 76% chance that EURCHF will trade within the 0.95270 – 0.97098 range over the next week.
As of Friday’s stock market close, the Dow Jones Index (US30) decreased by 0.49% (for the week +0.12%). The S&P 500 Index (US500) lost 0.65% (for the week +0.10%). The NASDAQ Technology Index (US100) closed negative 0.96% (for the week -0.49%). Last week, the real estate, health care, and technology sectors were the biggest laggards, while energy, communication services, and commodities outperformed the market. The moves came as stronger-than-expected US inflation data raised concerns that the central bank may further delay interest rate cuts. The Fed had initially planned to start cutting rates in March, but that deadline was then pushed back to June and could now be pushed back even further. The rate is expected to remain at 5.5%, but the real factor could be the conference call after the meeting. If Powell begins to back away from cutting rates this summer, it could put further pressure on the indices.
Friday saw a huge quarterly derivatives expiration in the US market, accounting for $5.1 trillion in index and equity options. Since the consensus has been bullish in equities recently, market makers now have huge hedging long positions open in equities and indices. Once the derivatives expire, market makers will get rid of this hedge and thus put pressure on the stock market. Statistically, corrections in bull markets have often occurred in periods of quarterly expirations. Perhaps now it will help the indices to let off a little steam.
The Nvidia GTC developer conference, which begins today, will be closely watched in anticipation of announcements related to artificial intelligence. Investors will undoubtedly want to hear announcements that keep the company’s stock skyrocketing. CEO Jensen Huang will deliver the keynote address and possibly offer attendees a first look at its newest products, including the next-generation B100 GPU for artificial intelligence and high-performance computing applications. Nvidia’s stock gains over the past year have increased its market value by $1 trillion, putting it at the top of the S&P 500 Index.
In addition to the Fed meeting, internationally, investors’ attention this week will be focused on interest rate decisions from Japan, the UK, Australia, Brazil, Turkey, Switzerland, and Norway. In addition, inflation data from Canada, the UK, South Africa, and Japan will be the focus.
Equity markets in Europe were mostly down on Friday. Germany’s DAX (DE40) was down 0.03% (for the week +1.39%), France’s CAC 40 (FR40) added 0.04% (for the week +2.24%) on Friday, Spain’s IBEX 35 (ES35) was up 1.02% (for the week +3.09%), and the UK’s FTSE 100 (UK100) closed negative 0.20% (for the week +0.88%).
Oil prices rose nearly 4% last week as the International Energy Agency released an optimistic demand outlook and predicted a small deficit this year. WTI crude prices rose above $81 a barrel on Monday, extending last week’s gains, as heightened geopolitical risks raise supply concerns. Ukraine has stepped up drone strikes on Russian refineries over the past week, shutting down about 7% of Russian refining capacity in the first quarter. Israeli Prime Minister Benjamin Netanyahu also said he would press ahead with plans to push into the Rafah enclave in the Gaza Strip, complicating the chances of a peace deal.
Silver prices climbed above the $25 an ounce mark on Friday and were up more than 4% for the week, driven by safe-haven demand as investors sought refuge from increased military and inflation risks. The latest US consumer price index and producer price index data came in stronger than expected. At the same time, geopolitical tensions on the global stage intensified after Russia moved its tactical nuclear weapons closer to NATO.
US natural gas prices fell below $1.7 per Mmbbl on Friday, marking a more than 6% decline for the week. This was driven by forecasts of mild weather that would reduce the demand for gas for heating. Despite the larger-than-expected withdrawals, the latest EIA data shows gas in storage is still 37.1 percent above average for this time of year.
Asian markets traded flat yesterday. Japan’s Nikkei 225 (JP225) was down 1.34% for the week, China’s FTSE China A50 (CHA50) was up 2.04% for the 5 trading days, Hong Kong’s Hang Seng (HK50) was up 1.86% for the week, and Australia’s ASX 200 (AU200) was negative 1.88%. Asian equity markets mostly rose on Monday as investors were cheered by better-than-expected Chinese retail sales and industrial production figures for the first two months of this year. However, China’s urban unemployment rate stood at 5.3% in January-February 2024, up from 5.1% in December. This is the highest rate since July last year.
The all-important Bank of Japan meeting will be held as early as tomorrow. Signs that employers are planning significant wage increases seem to have inclined the central bank to finally abandon the massive monetary easing that has been applied for years to stimulate growth in the country. The last time the rate was raised was 17 years ago. The current meeting has a 56% chance of a +10bp BoJ rate hike.
S&P 500 (US500) 5,117.09 −33.39 (−0.65%)
Dow Jones (US30) 38,714.77 −190.89 (−0.49%)
DAX (DE40) 17,936.65 −5.39 (−0.03%)
FTSE 100 (UK100) 7,727.42 −15.73 (−0.20%)
USD Index 103.45 +0.02 (+0.01%)
Important events today:
– China Industrial Production (m/m) at 04:00 (GMT+2);
– China Retail Sales (m/m) at 04:00 (GMT+2);
– China Unemployment Rate (m/m) at 04:00 (GMT+2);
– Eurozone Consumer Price Index (m/m) at 12:00 (GMT+2);
This article reflects a personal opinion and should not be interpreted as an investment advice, and/or offer, and/or a persistent request for carrying out financial transactions, and/or a guarantee, and/or a forecast of future events.