By InvestMacro
Here are the latest charts and statistics for the Commitment of Traders (COT) data published by the Commodities Futures Trading Commission (CFTC).
The latest COT data is updated through Tuesday March 19th and shows a quick view of how large market participants (for-profit speculators and commercial traders) were positioned in the futures markets. All currency positions are in direct relation to the US dollar where, for example, a bet for the euro is a bet that the euro will rise versus the dollar while a bet against the euro will be a bet that the euro will decline versus the dollar.
Weekly Speculator Changes led by Mexican Peso & Brazilian Real
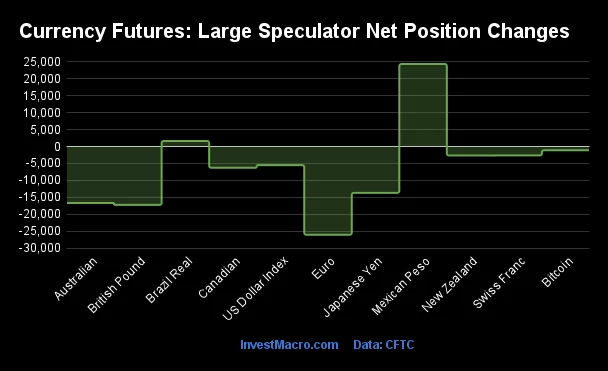
The COT currency market speculator bets were sharply lower this week as just two out of the eleven currency markets we cover had higher positioning while the other nine markets had lower speculator contracts.
Leading the gains for the currency markets was the Mexican Peso (24,378 contracts) with the Brazilian Real (1,627 contracts) also showing a positive week.
The currencies seeing declines in speculator bets on the week were the EuroFX (-26,065 contracts) with the British Pound (-17,251 contracts), the Australian Dollar (-16,698 contracts), the Japanese Yen (-13,690 contracts), the Canadian Dollar (-6,274 contracts), the US Dollar Index (-5,507 contracts), the Swiss Franc (-2,630 contracts), the New Zealand Dollar (-2,654 contracts) and Bitcoin (-1,102 contracts) also registering lower bets on the week.
Speculators drop their Australian Dollar bets to new record low
Highlighting the COT currency’s data this week is the renewed bearishness in the speculator’s positioning for the Australian dollar. Large speculative Aussie currency positions dropped this week by over -16,000 net contracts, the largest weekly decline in twenty-six weeks and the third straight weekly fall. The AUD speculator positions have decreased in nine out of the past ten weeks as well with an overall drop by -75,264 net contracts in that ten-week period.
This rise in bearishness has pushed the speculators bets to the most bearish level on record at a total of -107,538 net contracts. This surpasses the previous record of -96,946 contracts that was hit on September 19th of 2023. The overall Aussie speculator positioning has now been in bearish territory since dropping from a net bullish position to a net bearish position on May 25th of 2021 and this week marks the 148th consecutive week of continuous bearish speculator levels.
Denting the sentiment for the Aussie Dollar was a recent interest rate hold by the Reserve Bank of Australia (RBA) on March 19th. The RBA left its cash rate at 4.35 percent as inflation continues to decrease and with many market watchers feeling this was a dovish meeting and statement.
The Australian dollar is in a downtrend, according to our trend following model, with the Aussie closing out the week against the US Dollar at 0.6531. The AUD/USD currency pair opened the 2024 trading year at the 0.6823 exchange rate and has been trending lower since hitting a multi-year high of approximately 0.8000 in February of 2021.
Currencies Net Speculators Leaderboard
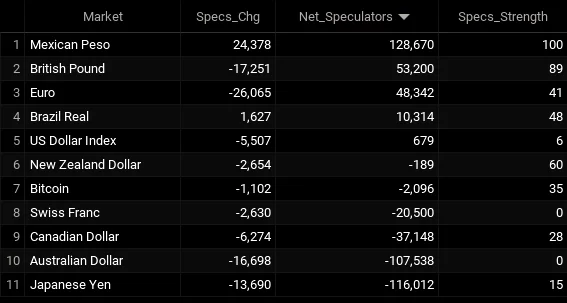
Legend: Weekly Speculators Change | Speculators Current Net Position | Speculators Strength Score compared to last 3-Years (0-100 range)
Strength Scores led by Mexican Peso & British Pound
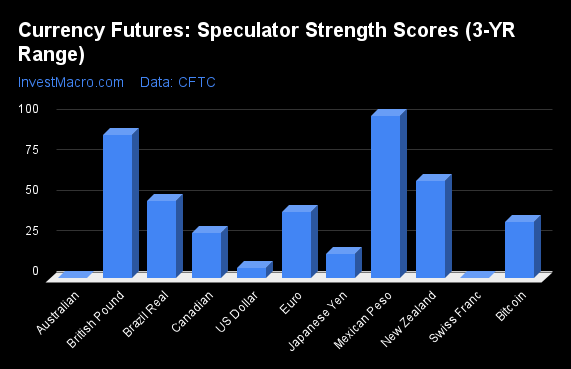
COT Strength Scores (a normalized measure of Speculator positions over a 3-Year range, from 0 to 100 where above 80 is Extreme-Bullish and below 20 is Extreme-Bearish) showed that the Mexican Peso (100 percent) and the British Pound (89 percent) lead the currency markets this week. The New Zealand Dollar (60 percent) comes in as the next highest in the weekly strength scores.
On the downside, the Australian Dollar (0 percent), the Swiss Franc (0 percent), the US Dollar Index (6 percent) and the Japanese Yen (15 percent) come in at the lowest strength levels currently and are in Extreme-Bearish territory (below 20 percent).
Strength Statistics:
US Dollar Index (6.3 percent) vs US Dollar Index previous week (17.9 percent)
EuroFX (40.9 percent) vs EuroFX previous week (52.0 percent)
British Pound Sterling (88.6 percent) vs British Pound Sterling previous week (100.0 percent)
Japanese Yen (14.8 percent) vs Japanese Yen previous week (27.0 percent)
Swiss Franc (0.4 percent) vs Swiss Franc previous week (8.1 percent)
Canadian Dollar (27.9 percent) vs Canadian Dollar previous week (33.2 percent)
Australian Dollar (0.0 percent) vs Australian Dollar previous week (13.9 percent)
New Zealand Dollar (59.8 percent) vs New Zealand Dollar previous week (67.4 percent)
Mexican Peso (100.0 percent) vs Mexican Peso previous week (87.4 percent)
Brazilian Real (47.9 percent) vs Brazilian Real previous week (45.8 percent)
Bitcoin (34.9 percent) vs Bitcoin previous week (51.4 percent)
Mexican Peso & British Pound top the 6-Week Strength Trends
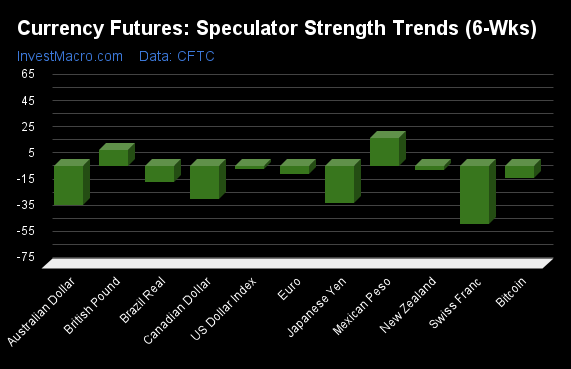
COT Strength Score Trends (or move index, calculates the 6-week changes in strength scores) showed that the Mexican Peso (22 percent) and the British Pound (12 percent) lead the past six weeks trends for the currencies and are the only markets with positive scores.
The Swiss Franc (-44 percent) leads the downside trend scores currently with the Australian Dollar (-30 percent), Japanese Yen (-28 percent) and the Canadian Dollar (-25 percent) following next with lower trend scores.
Strength Trend Statistics:
US Dollar Index (-1.8 percent) vs US Dollar Index previous week (12.3 percent)
EuroFX (-5.9 percent) vs EuroFX previous week (-6.1 percent)
British Pound Sterling (12.4 percent) vs British Pound Sterling previous week (24.1 percent)
Japanese Yen (-28.2 percent) vs Japanese Yen previous week (-19.4 percent)
Swiss Franc (-43.7 percent) vs Swiss Franc previous week (-40.8 percent)
Canadian Dollar (-24.7 percent) vs Canadian Dollar previous week (-23.9 percent)
Australian Dollar (-29.8 percent) vs Australian Dollar previous week (-27.2 percent)
New Zealand Dollar (-2.9 percent) vs New Zealand Dollar previous week (9.9 percent)
Mexican Peso (21.7 percent) vs Mexican Peso previous week (12.4 percent)
Brazilian Real (-12.1 percent) vs Brazilian Real previous week (-12.5 percent)
Bitcoin (-8.6 percent) vs Bitcoin previous week (12.1 percent)
Individual COT Forex Markets:
US Dollar Index Futures:
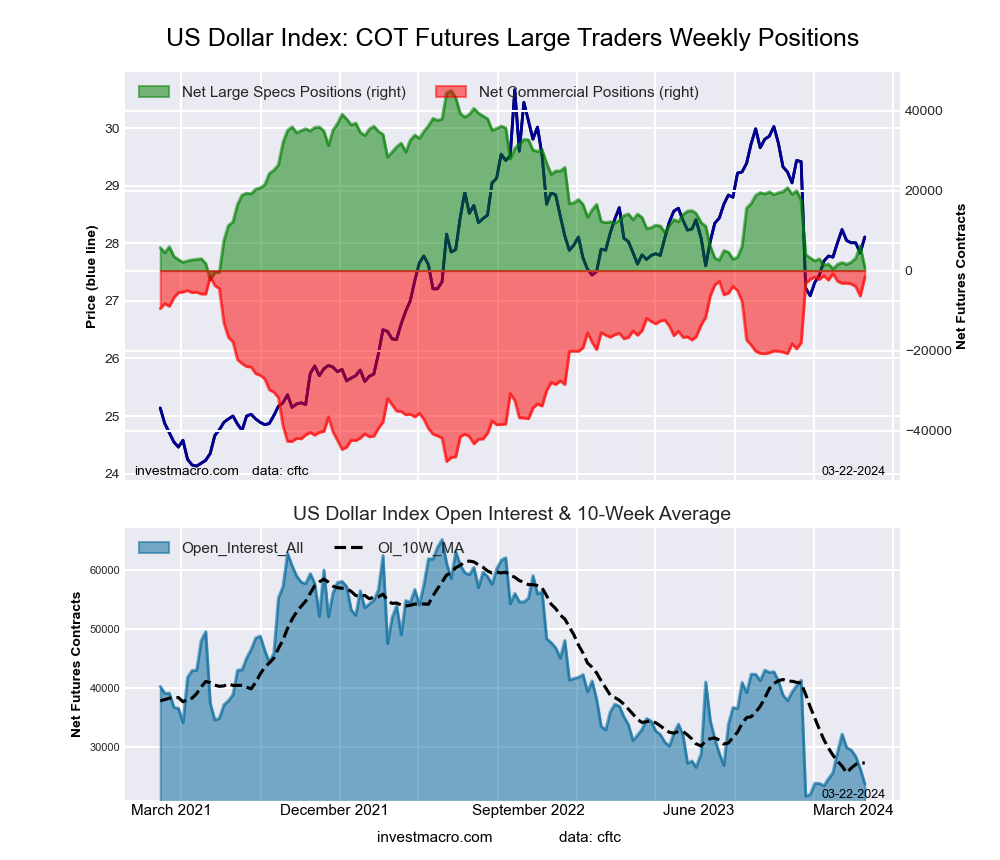 The US Dollar Index large speculator standing this week totaled a net position of 679 contracts in the data reported through Tuesday. This was a weekly fall of -5,507 contracts from the previous week which had a total of 6,186 net contracts.
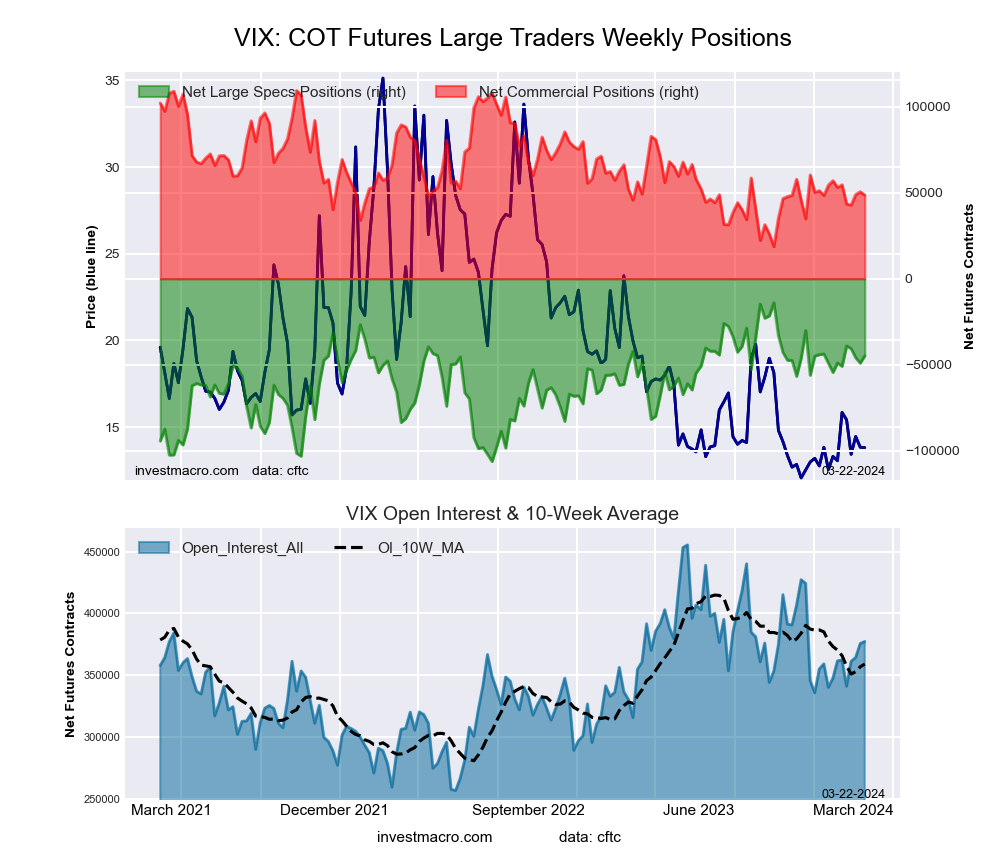
This week’s current strength score (the trader positioning range over the past three years, measured from 0 to 100) shows the speculators are currently Bearish-Extreme with a score of 6.3 percent. The commercials are Bullish-Extreme with a score of 98.0 percent and the small traders (not shown in chart) are Bearish with a score of 22.9 percent.
Price Trend-Following Model: Weak Downtrend
Our weekly trend-following model classifies the current market price position as: Weak Downtrend. The current action for the model is considered to be: Hold – Maintain Short Position.
| US DOLLAR INDEX Statistics | SPECULATORS | COMMERCIALS | SMALL TRADERS |
| – Percent of Open Interest Longs: | 65.4 | 16.2 | 13.0 |
| – Percent of Open Interest Shorts: | 62.5 | 23.3 | 8.7 |
| – Net Position: | 679 | -1,691 | 1,012 |
| – Gross Longs: | 15,573 | 3,861 | 3,091 |
| – Gross Shorts: | 14,894 | 5,552 | 2,079 |
| – Long to Short Ratio: | 1.0 to 1 | 0.7 to 1 | 1.5 to 1 |
| NET POSITION TREND: | | | |
| – Strength Index Score (3 Year Range Pct): | 6.3 | 98.0 | 22.9 |
| – Strength Index Reading (3 Year Range): | Bearish-Extreme | Bullish-Extreme | Bearish |
| NET POSITION MOVEMENT INDEX: | | | |
| – 6-Week Change in Strength Index: | -1.8 | 2.0 | -1.2 |
Euro Currency Futures:
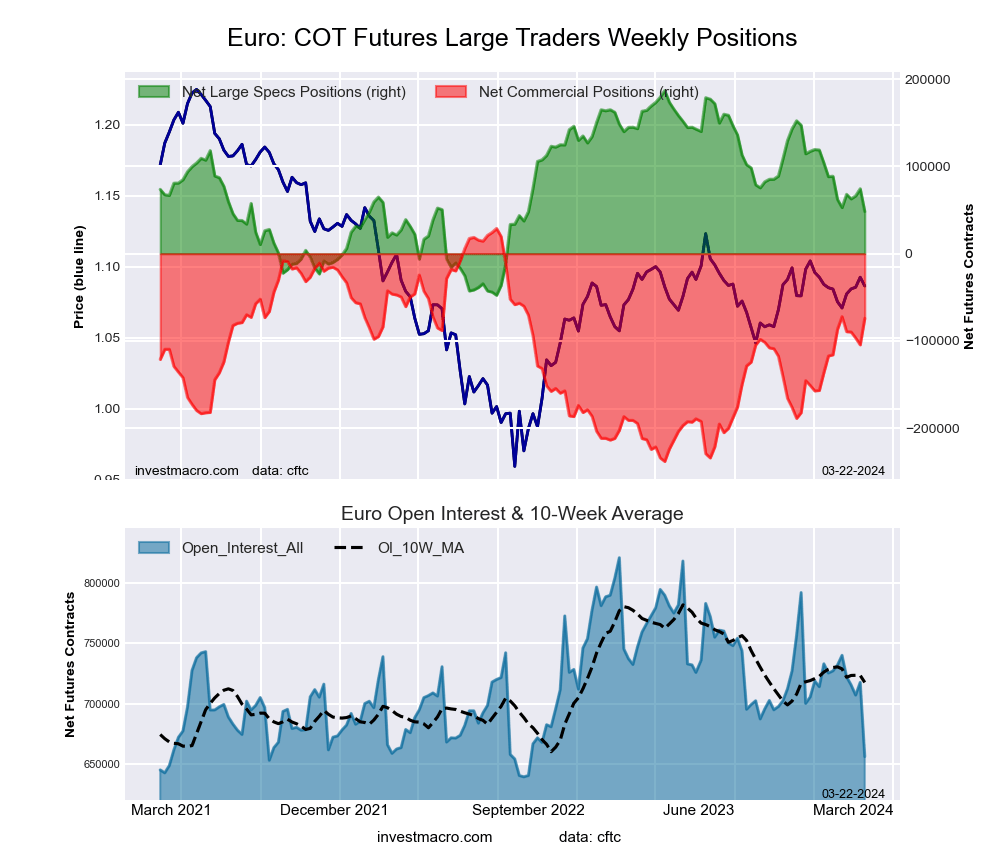 The Euro Currency large speculator standing this week totaled a net position of 48,342 contracts in the data reported through Tuesday. This was a weekly fall of -26,065 contracts from the previous week which had a total of 74,407 net contracts.
This week’s current strength score (the trader positioning range over the past three years, measured from 0 to 100) shows the speculators are currently Bearish with a score of 40.9 percent. The commercials are Bullish with a score of 61.5 percent and the small traders (not shown in chart) are Bearish with a score of 20.1 percent.
Price Trend-Following Model: Strong Downtrend
Our weekly trend-following model classifies the current market price position as: Strong Downtrend. The current action for the model is considered to be: New Sell – Short Position.
| EURO Currency Statistics | SPECULATORS | COMMERCIALS | SMALL TRADERS |
| – Percent of Open Interest Longs: | 27.8 | 59.3 | 11.6 |
| – Percent of Open Interest Shorts: | 20.4 | 70.6 | 7.6 |
| – Net Position: | 48,342 | -74,130 | 25,788 |
| – Gross Longs: | 182,382 | 388,839 | 75,816 |
| – Gross Shorts: | 134,040 | 462,969 | 50,028 |
| – Long to Short Ratio: | 1.4 to 1 | 0.8 to 1 | 1.5 to 1 |
| NET POSITION TREND: | | | |
| – Strength Index Score (3 Year Range Pct): | 40.9 | 61.5 | 20.1 |
| – Strength Index Reading (3 Year Range): | Bearish | Bullish | Bearish |
| NET POSITION MOVEMENT INDEX: | | | |
| – 6-Week Change in Strength Index: | -5.9 | 4.8 | 1.7 |
British Pound Sterling Futures:
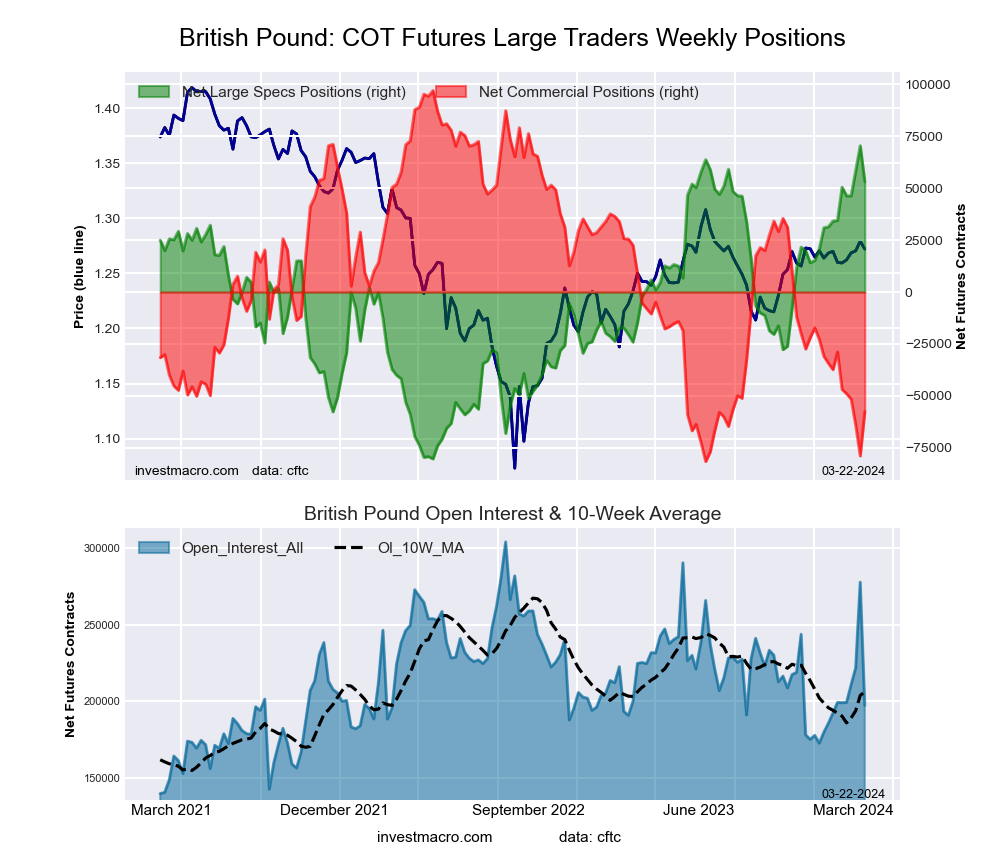 The British Pound Sterling large speculator standing this week totaled a net position of 53,200 contracts in the data reported through Tuesday. This was a weekly fall of -17,251 contracts from the previous week which had a total of 70,451 net contracts.
This week’s current strength score (the trader positioning range over the past three years, measured from 0 to 100) shows the speculators are currently Bullish-Extreme with a score of 88.6 percent. The commercials are Bearish-Extreme with a score of 13.4 percent and the small traders (not shown in chart) are Bullish with a score of 66.7 percent.
Price Trend-Following Model: Weak Uptrend
Our weekly trend-following model classifies the current market price position as: Weak Uptrend. The current action for the model is considered to be: Hold – Maintain Long Position.
| BRITISH POUND Statistics | SPECULATORS | COMMERCIALS | SMALL TRADERS |
| – Percent of Open Interest Longs: | 52.0 | 29.3 | 15.6 |
| – Percent of Open Interest Shorts: | 25.0 | 58.5 | 13.3 |
| – Net Position: | 53,200 | -57,617 | 4,417 |
| – Gross Longs: | 102,605 | 57,898 | 30,742 |
| – Gross Shorts: | 49,405 | 115,515 | 26,325 |
| – Long to Short Ratio: | 2.1 to 1 | 0.5 to 1 | 1.2 to 1 |
| NET POSITION TREND: | | | |
| – Strength Index Score (3 Year Range Pct): | 88.6 | 13.4 | 66.7 |
| – Strength Index Reading (3 Year Range): | Bullish-Extreme | Bearish-Extreme | Bullish |
| NET POSITION MOVEMENT INDEX: | | | |
| – 6-Week Change in Strength Index: | 12.4 | -16.1 | 19.7 |
Japanese Yen Futures:
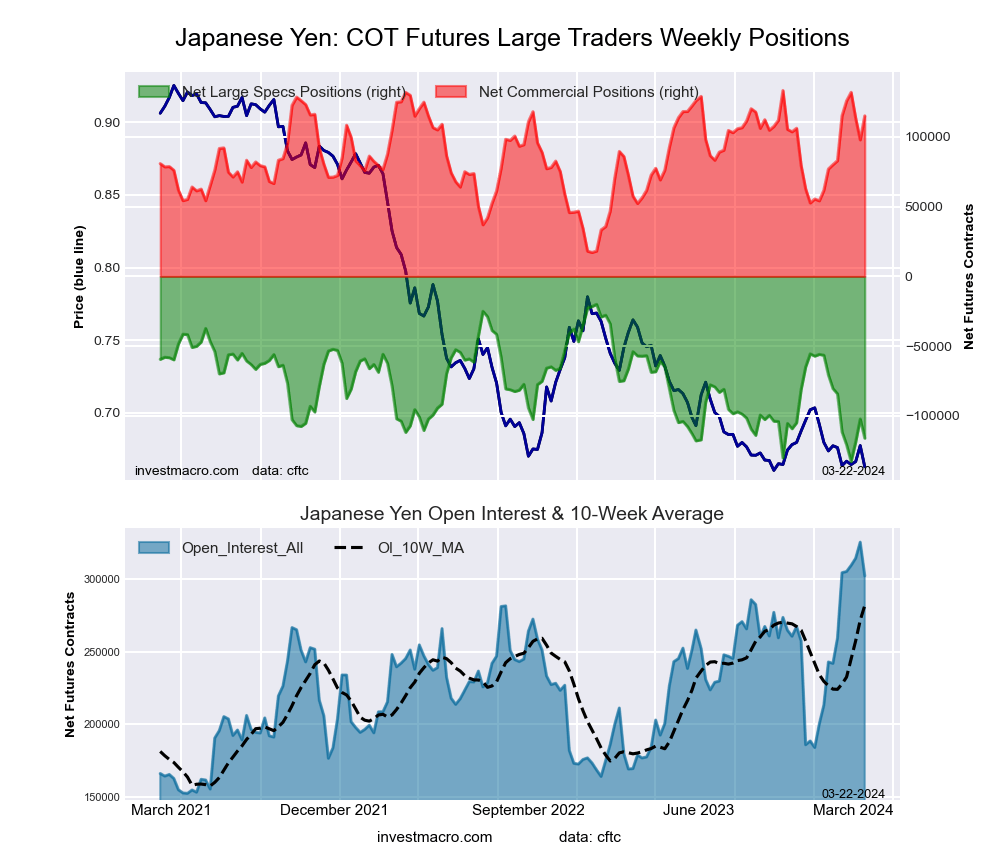 The Japanese Yen large speculator standing this week totaled a net position of -116,012 contracts in the data reported through Tuesday. This was a weekly lowering of -13,690 contracts from the previous week which had a total of -102,322 net contracts.
This week’s current strength score (the trader positioning range over the past three years, measured from 0 to 100) shows the speculators are currently Bearish-Extreme with a score of 14.8 percent. The commercials are Bullish-Extreme with a score of 84.4 percent and the small traders (not shown in chart) are Bullish-Extreme with a score of 85.4 percent.
Price Trend-Following Model: Strong Downtrend
Our weekly trend-following model classifies the current market price position as: Strong Downtrend. The current action for the model is considered to be: Hold – Maintain Short Position.
| JAPANESE YEN Statistics | SPECULATORS | COMMERCIALS | SMALL TRADERS |
| – Percent of Open Interest Longs: | 21.9 | 60.3 | 15.5 |
| – Percent of Open Interest Shorts: | 60.3 | 22.2 | 15.2 |
| – Net Position: | -116,012 | 115,119 | 893 |
| – Gross Longs: | 66,274 | 182,299 | 46,762 |
| – Gross Shorts: | 182,286 | 67,180 | 45,869 |
| – Long to Short Ratio: | 0.4 to 1 | 2.7 to 1 | 1.0 to 1 |
| NET POSITION TREND: | | | |
| – Strength Index Score (3 Year Range Pct): | 14.8 | 84.4 | 85.4 |
| – Strength Index Reading (3 Year Range): | Bearish-Extreme | Bullish-Extreme | Bullish-Extreme |
| NET POSITION MOVEMENT INDEX: | | | |
| – 6-Week Change in Strength Index: | -28.2 | 27.7 | -1.1 |
Swiss Franc Futures:
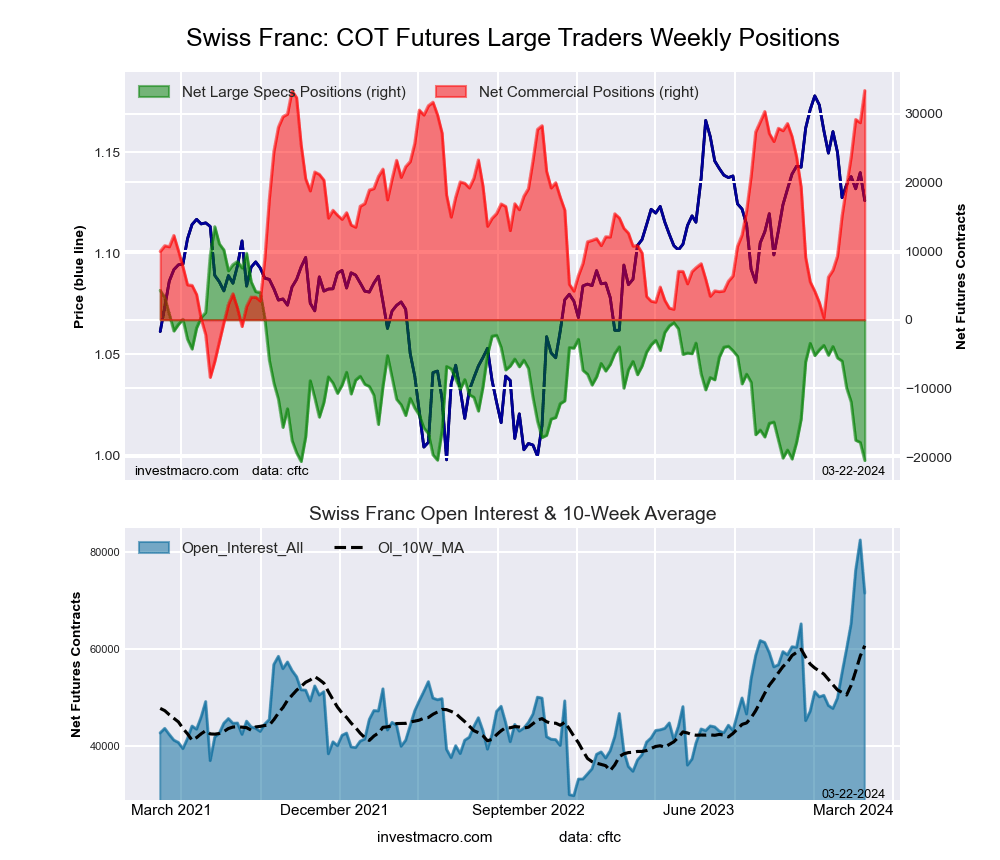 The Swiss Franc large speculator standing this week totaled a net position of -20,500 contracts in the data reported through Tuesday. This was a weekly fall of -2,630 contracts from the previous week which had a total of -17,870 net contracts.
This week’s current strength score (the trader positioning range over the past three years, measured from 0 to 100) shows the speculators are currently Bearish-Extreme with a score of 0.4 percent. The commercials are Bullish-Extreme with a score of 100.0 percent and the small traders (not shown in chart) are Bearish-Extreme with a score of 18.6 percent.
Price Trend-Following Model: Strong Downtrend
Our weekly trend-following model classifies the current market price position as: Strong Downtrend. The current action for the model is considered to be: New Sell – Short Position.
| SWISS FRANC Statistics | SPECULATORS | COMMERCIALS | SMALL TRADERS |
| – Percent of Open Interest Longs: | 18.2 | 68.2 | 13.5 |
| – Percent of Open Interest Shorts: | 46.8 | 21.6 | 31.5 |
| – Net Position: | -20,500 | 33,392 | -12,892 |
| – Gross Longs: | 13,003 | 48,825 | 9,665 |
| – Gross Shorts: | 33,503 | 15,433 | 22,557 |
| – Long to Short Ratio: | 0.4 to 1 | 3.2 to 1 | 0.4 to 1 |
| NET POSITION TREND: | | | |
| – Strength Index Score (3 Year Range Pct): | 0.4 | 100.0 | 18.6 |
| – Strength Index Reading (3 Year Range): | Bearish-Extreme | Bullish-Extreme | Bearish-Extreme |
| NET POSITION MOVEMENT INDEX: | | | |
| – 6-Week Change in Strength Index: | -43.7 | 57.7 | -41.8 |
Canadian Dollar Futures:
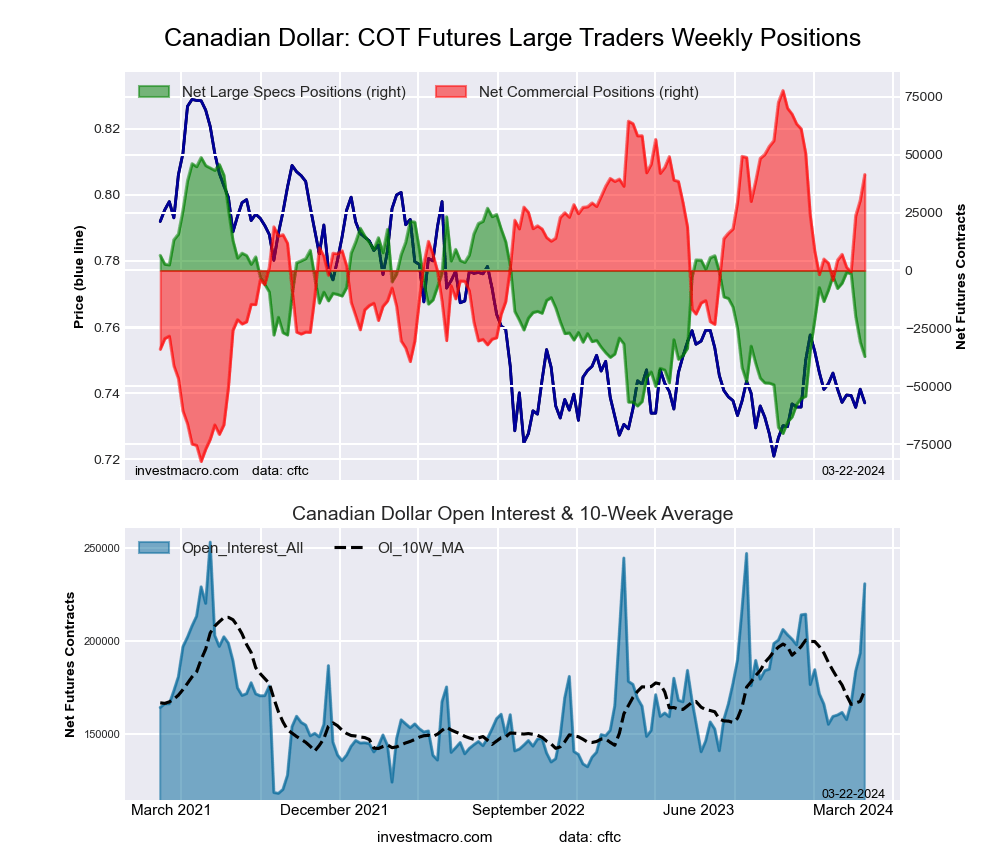 The Canadian Dollar large speculator standing this week totaled a net position of -37,148 contracts in the data reported through Tuesday. This was a weekly lowering of -6,274 contracts from the previous week which had a total of -30,874 net contracts.
This week’s current strength score (the trader positioning range over the past three years, measured from 0 to 100) shows the speculators are currently Bearish with a score of 27.9 percent. The commercials are Bullish with a score of 77.4 percent and the small traders (not shown in chart) are Bearish-Extreme with a score of 13.3 percent.
Price Trend-Following Model: Weak Uptrend
Our weekly trend-following model classifies the current market price position as: Weak Uptrend. The current action for the model is considered to be: Hold – Maintain Long Position.
| CANADIAN DOLLAR Statistics | SPECULATORS | COMMERCIALS | SMALL TRADERS |
| – Percent of Open Interest Longs: | 19.8 | 66.5 | 11.7 |
| – Percent of Open Interest Shorts: | 36.0 | 48.6 | 13.6 |
| – Net Position: | -37,148 | 41,437 | -4,289 |
| – Gross Longs: | 45,761 | 153,407 | 27,007 |
| – Gross Shorts: | 82,909 | 111,970 | 31,296 |
| – Long to Short Ratio: | 0.6 to 1 | 1.4 to 1 | 0.9 to 1 |
| NET POSITION TREND: | | | |
| – Strength Index Score (3 Year Range Pct): | 27.9 | 77.4 | 13.3 |
| – Strength Index Reading (3 Year Range): | Bearish | Bullish | Bearish-Extreme |
| NET POSITION MOVEMENT INDEX: | | | |
| – 6-Week Change in Strength Index: | -24.7 | 23.1 | -16.9 |
Australian Dollar Futures:
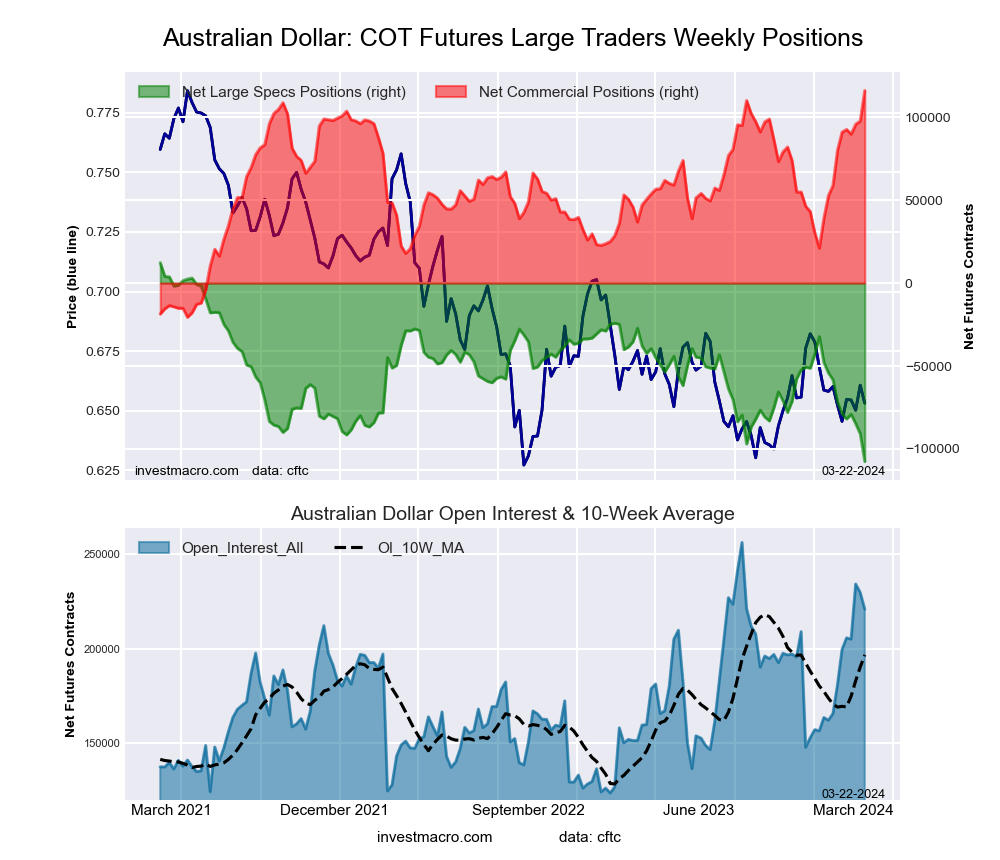 The Australian Dollar large speculator standing this week totaled a net position of -107,538 contracts in the data reported through Tuesday. This was a weekly lowering of -16,698 contracts from the previous week which had a total of -90,840 net contracts.
This week’s current strength score (the trader positioning range over the past three years, measured from 0 to 100) shows the speculators are currently Bearish-Extreme with a score of 0.0 percent. The commercials are Bullish-Extreme with a score of 100.0 percent and the small traders (not shown in chart) are Bearish with a score of 32.7 percent.
Price Trend-Following Model: Strong Downtrend
Our weekly trend-following model classifies the current market price position as: Strong Downtrend. The current action for the model is considered to be: New Sell – Short Position.
| AUSTRALIAN DOLLAR Statistics | SPECULATORS | COMMERCIALS | SMALL TRADERS |
| – Percent of Open Interest Longs: | 17.3 | 71.9 | 8.6 |
| – Percent of Open Interest Shorts: | 66.0 | 19.4 | 12.5 |
| – Net Position: | -107,538 | 116,062 | -8,524 |
| – Gross Longs: | 38,207 | 158,919 | 19,035 |
| – Gross Shorts: | 145,745 | 42,857 | 27,559 |
| – Long to Short Ratio: | 0.3 to 1 | 3.7 to 1 | 0.7 to 1 |
| NET POSITION TREND: | | | |
| – Strength Index Score (3 Year Range Pct): | 0.0 | 100.0 | 32.7 |
| – Strength Index Reading (3 Year Range): | Bearish-Extreme | Bullish-Extreme | Bearish |
| NET POSITION MOVEMENT INDEX: | | | |
| – 6-Week Change in Strength Index: | -29.8 | 26.4 | -0.8 |
New Zealand Dollar Futures:
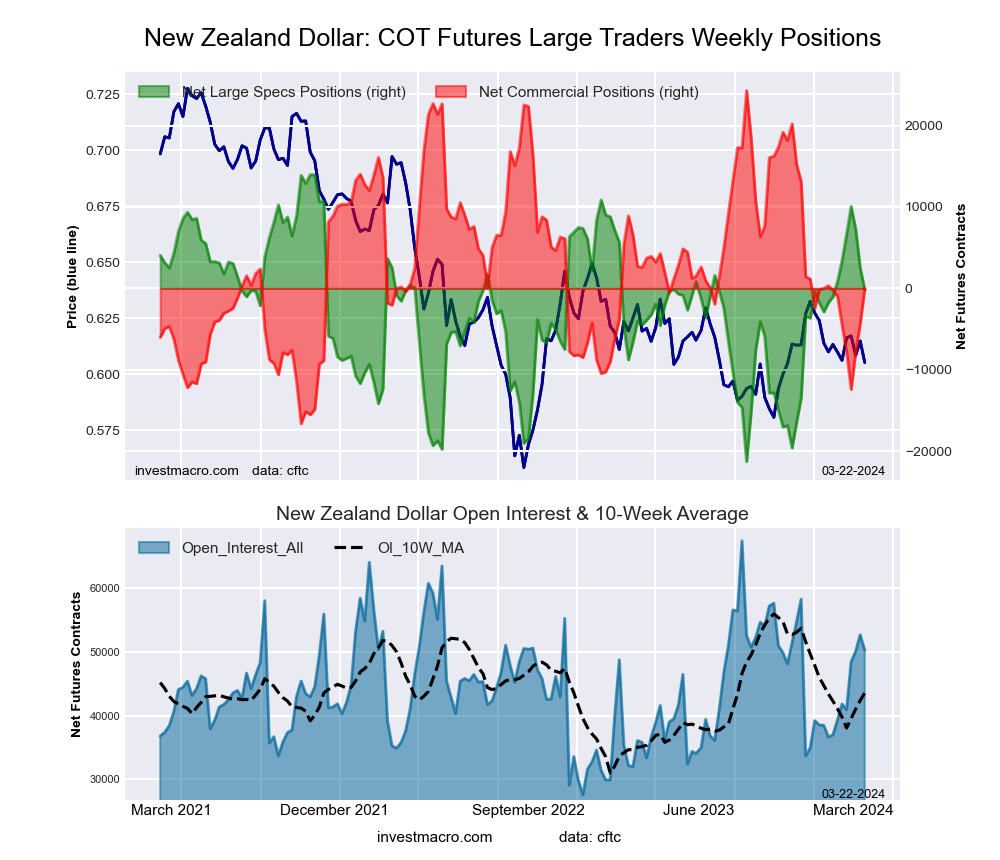 The New Zealand Dollar large speculator standing this week totaled a net position of -189 contracts in the data reported through Tuesday. This was a weekly decrease of -2,654 contracts from the previous week which had a total of 2,465 net contracts.
This week’s current strength score (the trader positioning range over the past three years, measured from 0 to 100) shows the speculators are currently Bullish with a score of 59.8 percent. The commercials are Bearish with a score of 40.6 percent and the small traders (not shown in chart) are Bullish with a score of 56.7 percent.
Price Trend-Following Model: Weak Uptrend
Our weekly trend-following model classifies the current market price position as: Weak Uptrend. The current action for the model is considered to be: Hold – Maintain Long Position.
| NEW ZEALAND DOLLAR Statistics | SPECULATORS | COMMERCIALS | SMALL TRADERS |
| – Percent of Open Interest Longs: | 37.9 | 51.9 | 8.5 |
| – Percent of Open Interest Shorts: | 38.3 | 51.9 | 8.1 |
| – Net Position: | -189 | -7 | 196 |
| – Gross Longs: | 19,064 | 26,118 | 4,278 |
| – Gross Shorts: | 19,253 | 26,125 | 4,082 |
| – Long to Short Ratio: | 1.0 to 1 | 1.0 to 1 | 1.0 to 1 |
| NET POSITION TREND: | | | |
| – Strength Index Score (3 Year Range Pct): | 59.8 | 40.6 | 56.7 |
| – Strength Index Reading (3 Year Range): | Bullish | Bearish | Bullish |
| NET POSITION MOVEMENT INDEX: | | | |
| – 6-Week Change in Strength Index: | -2.9 | 2.4 | 0.7 |
Mexican Peso Futures:
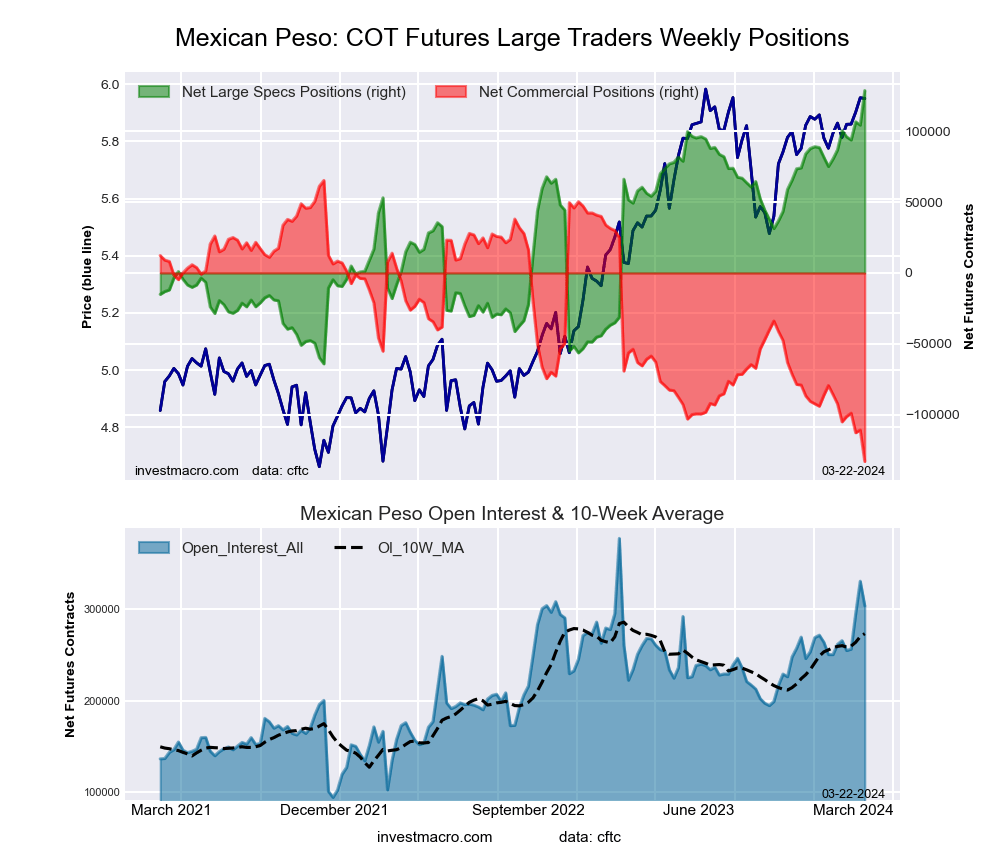 The Mexican Peso large speculator standing this week totaled a net position of 128,670 contracts in the data reported through Tuesday. This was a weekly lift of 24,378 contracts from the previous week which had a total of 104,292 net contracts.
This week’s current strength score (the trader positioning range over the past three years, measured from 0 to 100) shows the speculators are currently Bullish-Extreme with a score of 100.0 percent. The commercials are Bearish-Extreme with a score of 0.0 percent and the small traders (not shown in chart) are Bearish with a score of 38.7 percent.
Price Trend-Following Model: Strong Uptrend
Our weekly trend-following model classifies the current market price position as: Strong Uptrend. The current action for the model is considered to be: Hold – Maintain Long Position.
| MEXICAN PESO Statistics | SPECULATORS | COMMERCIALS | SMALL TRADERS |
| – Percent of Open Interest Longs: | 60.4 | 37.0 | 2.5 |
| – Percent of Open Interest Shorts: | 18.0 | 80.8 | 1.1 |
| – Net Position: | 128,670 | -132,984 | 4,314 |
| – Gross Longs: | 183,182 | 112,132 | 7,548 |
| – Gross Shorts: | 54,512 | 245,116 | 3,234 |
| – Long to Short Ratio: | 3.4 to 1 | 0.5 to 1 | 2.3 to 1 |
| NET POSITION TREND: | | | |
| – Strength Index Score (3 Year Range Pct): | 100.0 | 0.0 | 38.7 |
| – Strength Index Reading (3 Year Range): | Bullish-Extreme | Bearish-Extreme | Bearish |
| NET POSITION MOVEMENT INDEX: | | | |
| – 6-Week Change in Strength Index: | 21.7 | -20.5 | -7.5 |
Brazilian Real Futures:
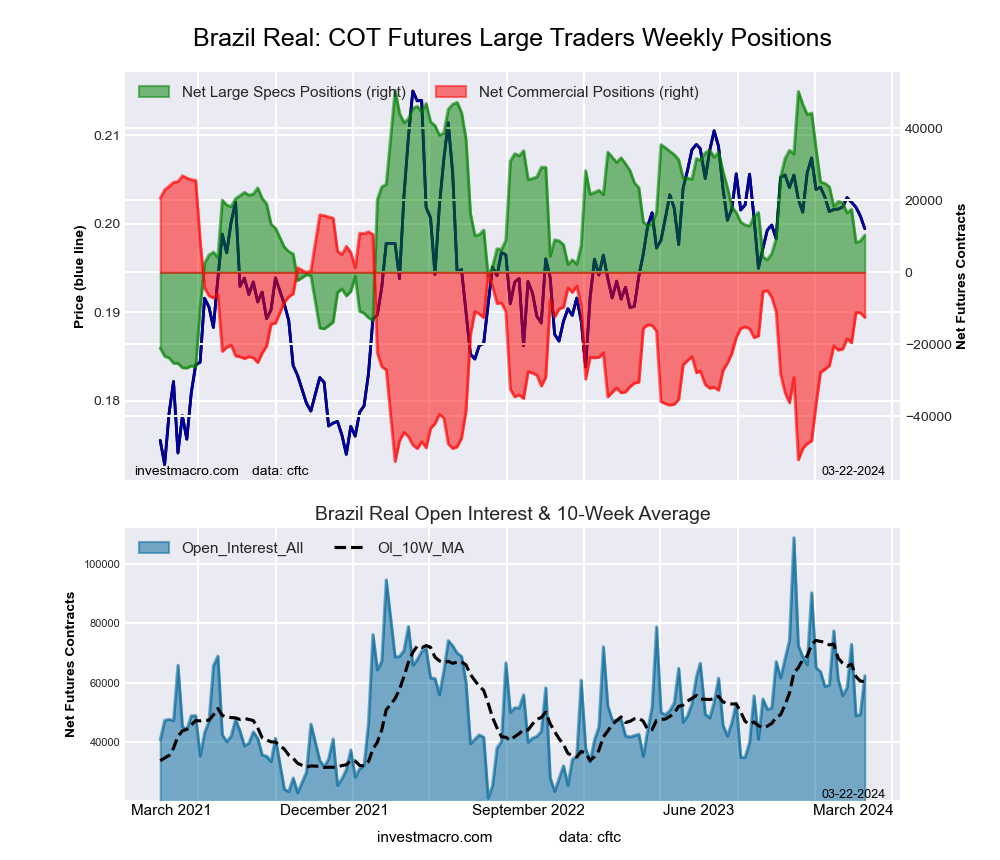 The Brazilian Real large speculator standing this week totaled a net position of 10,314 contracts in the data reported through Tuesday. This was a weekly rise of 1,627 contracts from the previous week which had a total of 8,687 net contracts.
This week’s current strength score (the trader positioning range over the past three years, measured from 0 to 100) shows the speculators are currently Bearish with a score of 47.9 percent. The commercials are Bullish with a score of 50.4 percent and the small traders (not shown in chart) are Bullish with a score of 55.0 percent.
Price Trend-Following Model: Strong Downtrend
Our weekly trend-following model classifies the current market price position as: Strong Downtrend. The current action for the model is considered to be: Hold – Maintain Short Position.
| BRAZIL REAL Statistics | SPECULATORS | COMMERCIALS | SMALL TRADERS |
| – Percent of Open Interest Longs: | 63.3 | 31.0 | 5.7 |
| – Percent of Open Interest Shorts: | 46.7 | 51.1 | 2.1 |
| – Net Position: | 10,314 | -12,526 | 2,212 |
| – Gross Longs: | 39,444 | 19,347 | 3,551 |
| – Gross Shorts: | 29,130 | 31,873 | 1,339 |
| – Long to Short Ratio: | 1.4 to 1 | 0.6 to 1 | 2.7 to 1 |
| NET POSITION TREND: | | | |
| – Strength Index Score (3 Year Range Pct): | 47.9 | 50.4 | 55.0 |
| – Strength Index Reading (3 Year Range): | Bearish | Bullish | Bullish |
| NET POSITION MOVEMENT INDEX: | | | |
| – 6-Week Change in Strength Index: | -12.1 | 11.4 | 2.5 |
Bitcoin Futures:
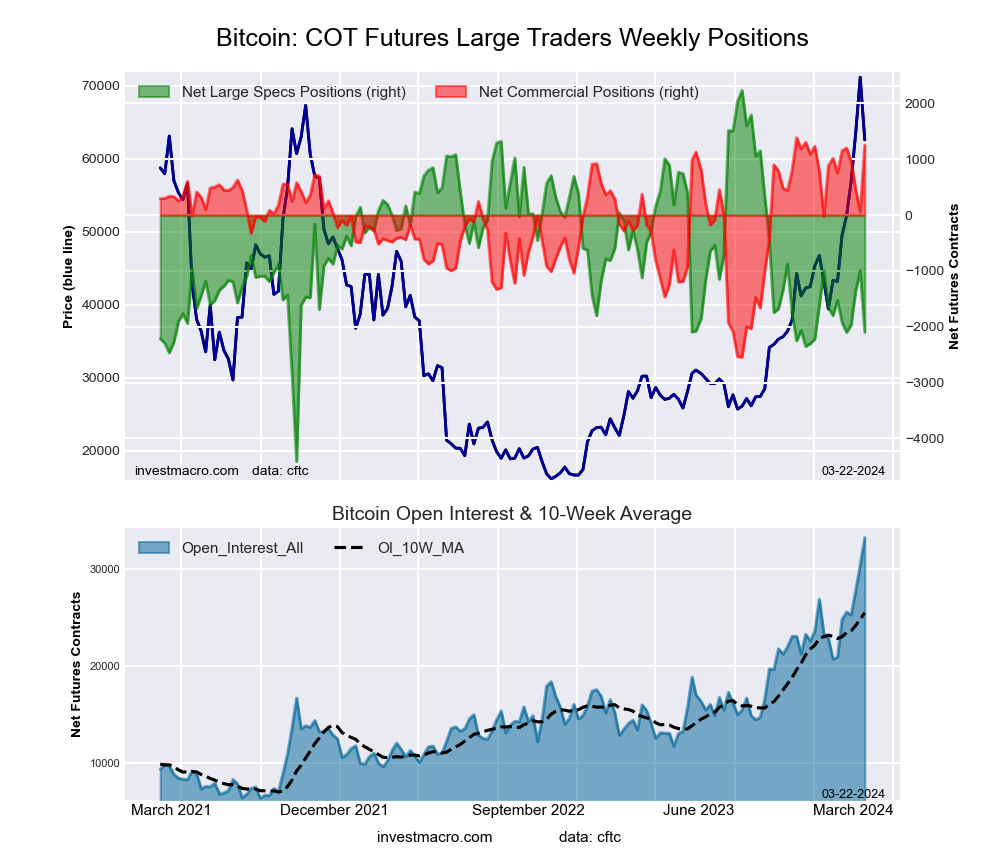 The Bitcoin large speculator standing this week totaled a net position of -2,096 contracts in the data reported through Tuesday. This was a weekly decrease of -1,102 contracts from the previous week which had a total of -994 net contracts.
This week’s current strength score (the trader positioning range over the past three years, measured from 0 to 100) shows the speculators are currently Bearish with a score of 34.9 percent. The commercials are Bullish-Extreme with a score of 96.6 percent and the small traders (not shown in chart) are Bearish with a score of 32.1 percent.
Price Trend-Following Model: Strong Uptrend
Our weekly trend-following model classifies the current market price position as: Strong Uptrend. The current action for the model is considered to be: Hold – Maintain Long Position.
| BITCOIN Statistics | SPECULATORS | COMMERCIALS | SMALL TRADERS |
| – Percent of Open Interest Longs: | 74.4 | 7.8 | 5.0 |
| – Percent of Open Interest Shorts: | 80.7 | 4.0 | 2.5 |
| – Net Position: | -2,096 | 1,253 | 843 |
| – Gross Longs: | 24,683 | 2,580 | 1,663 |
| – Gross Shorts: | 26,779 | 1,327 | 820 |
| – Long to Short Ratio: | 0.9 to 1 | 1.9 to 1 | 2.0 to 1 |
| NET POSITION TREND: | | | |
| – Strength Index Score (3 Year Range Pct): | 34.9 | 96.6 | 32.1 |
| – Strength Index Reading (3 Year Range): | Bearish | Bullish-Extreme | Bearish |
| NET POSITION MOVEMENT INDEX: | | | |
| – 6-Week Change in Strength Index: | -8.6 | 12.6 | 1.8 |
Article By InvestMacro – Receive our weekly COT Newsletter
*COT Report: The COT data, released weekly to the public each Friday, is updated through the most recent Tuesday (data is 3 days old) and shows a quick view of how large speculators or non-commercials (for-profit traders) were positioned in the futures markets.
The CFTC categorizes trader positions according to commercial hedgers (traders who use futures contracts for hedging as part of the business), non-commercials (large traders who speculate to realize trading profits) and nonreportable traders (usually small traders/speculators) as well as their open interest (contracts open in the market at time of reporting). See CFTC criteria here.