
By RoboForex Analytical Department
Gold prices tumbled over 3% to 2650 USD per troy ounce amid a surging US dollar, influenced by Donald Trump’s definitive win in the US presidential election. As of Thursday, gold prices are holding steady near three-week lows, reflecting ongoing pressure from a robust dollar.
Market anticipation has shifted, with investors expecting a more conservative approach from the Federal Reserve to interest rate cuts. Trump’s victory, perceived as pro-inflation due to his protectionist policies, could prompt the Fed to maintain higher lending rates to counter potential inflation spikes, diminishing the appeal of non-yielding assets like Gold.
Today’s focus is squarely on the Fed’s interest rate decision, which is anticipated to bring a 25-basis-point cut. This has been priced into the market, influencing the current Gold prices.
Gold’s future movements will hinge heavily on the Fed’s commentary and subsequent rate decisions. While rates are projected to decrease, the pace and extent of these cuts will be critical for Gold’s appeal.
Technical analysis of XAUUSD
Free Reports:
 Get our Weekly Commitment of Traders Reports - See where the biggest traders (Hedge Funds and Commercial Hedgers) are positioned in the futures markets on a weekly basis.
 Download Our Metatrader 4 Indicators – Put Our Free MetaTrader 4 Custom Indicators on your charts when you join our Weekly Newsletter
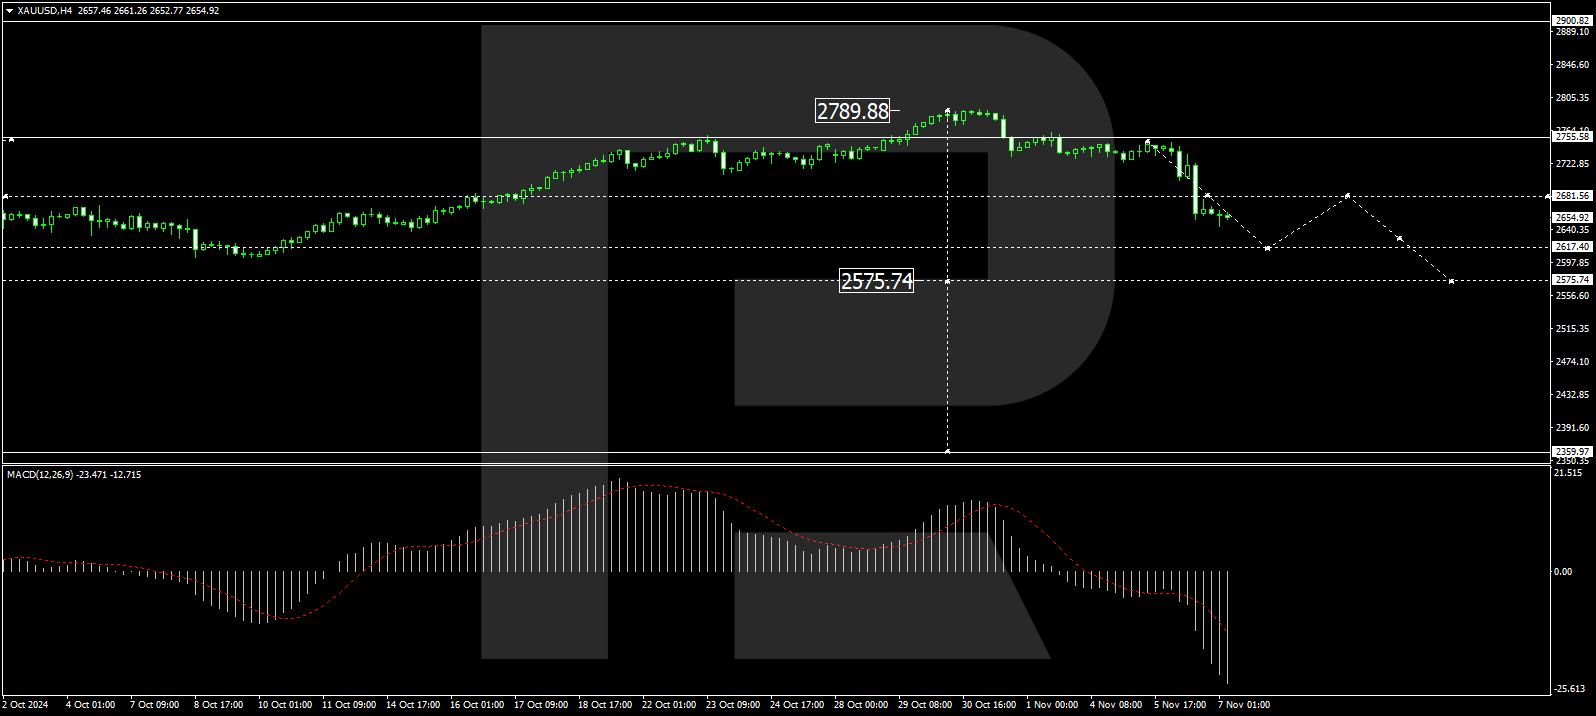
Gold’s market dynamics recently peaked at 2790.00, after which a consolidation range formed below this level. Exiting this range downward opened the pathway for a significant correction, with Gold forming its initial corrective wave. The immediate downside target is 2617.40, potentially extending to 2575.75 if the downward trajectory persists. The MACD indicator supports this bearish outlook, with its signal line trending sharply downward below zero, suggesting further declines.
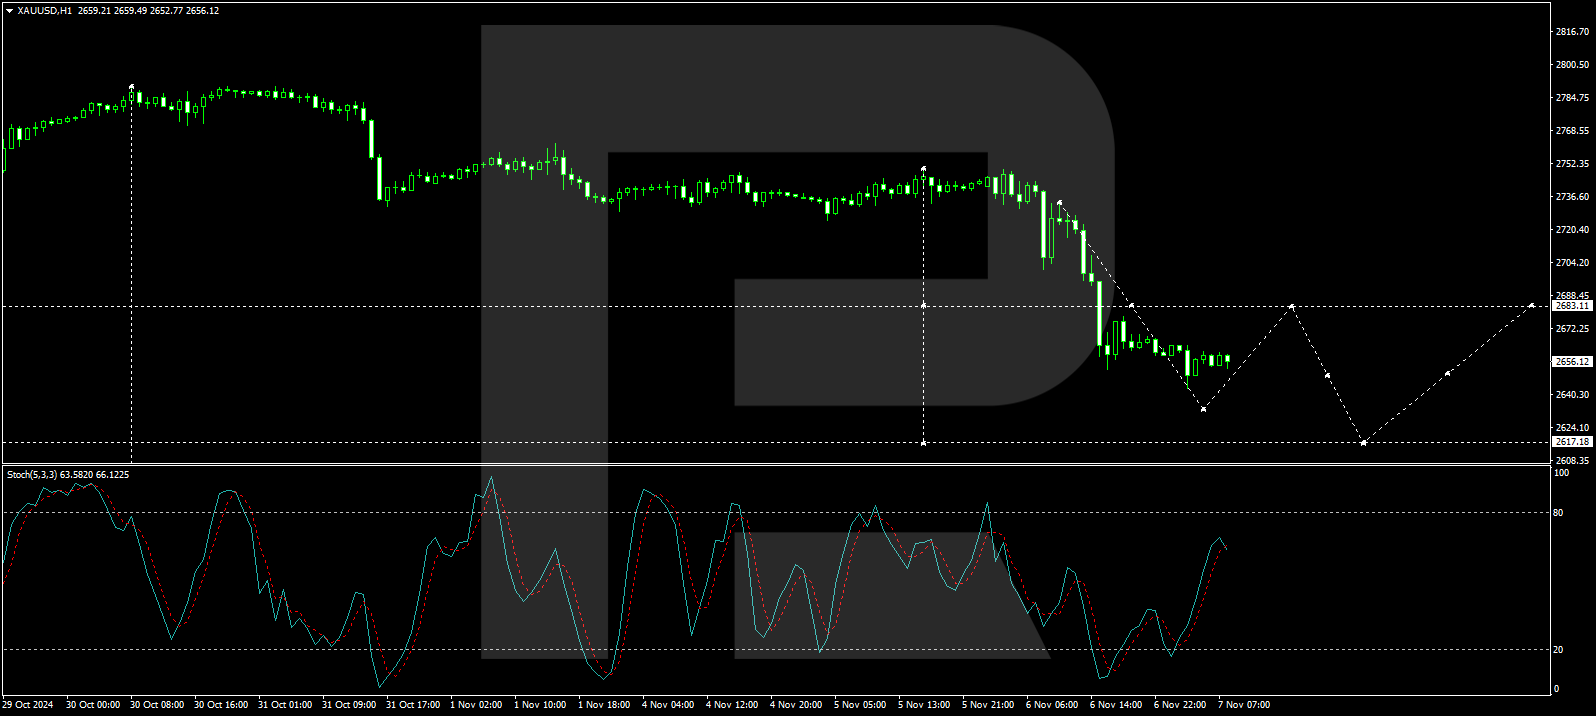
The hourly chart outlines a developing downward wave aiming for 2635.65. Should this target be met, a corrective rally to 2683.11 could occur before further declines resume towards 2617.17, marking the primary target in this bearish phase. The Stochastic oscillator indicates potential for short-term upside, with its signal line approaching the 80 level, suggesting a brief corrective uptick before continuing its descent.
Disclaimer
Any forecasts contained herein are based on the author’s particular opinion. This analysis may not be treated as trading advice. RoboForex bears no responsibility for trading results based on trading recommendations and reviews contained herein.

- GBP/USD at Month’s Lows: The Outlook Remains Weak Jul 29, 2026
- Crude oil falls below $80 per barrel. Australia sees inflation slowdown Jul 29, 2026
- The US Tech sector hit by sell‑off. Oil prices decline on renewed negotiations Jul 28, 2026
- Gold Declines, Focus on Fed and Falling Oil Prices Jul 28, 2026
- This week will be one of the most crowded for central‑bank meetings Jul 27, 2026
- EUR/USD Ahead of a Key Week: Holding Near Lows Jul 27, 2026
- COT Metals Charts: Weekly Speculator Changes led by Copper Jul 26, 2026
- COT Bonds Charts: Speculator Bets led by SOFR 3-Months & 5-Year Bonds Jul 26, 2026
- COT Energy Charts: Weekly Speculator Bets led by WTI Crude & Natural Gas Jul 26, 2026
- COT Soft Commodities Charts: Weekly Speculator Bets led by Corn & Soybeans Jul 26, 2026
