
By JustMarkets
On Monday, the US stock indices showed mixed dynamics, with the technology sector beginning to actively recover after Friday’s devastating sell‑off. By the end of the day, the Dow Jones Index (US30) fell by 0.06%. The S&P 500 Index (US500) rose by 0.30%. The NASDAQ Technology Index (US100) closed higher by 1.58%. The main driver of the rebound was the return of optimism regarding AI infrastructure and massive buying of cheaper semiconductor assets. Additional support for sentiment came from signs of de‑escalation in the Middle East: reports of halted mutual strikes between Iran and Israel, as well as Donald Trump’s statement about continued negotiations, allowed WTI oil prices to correct downward, losing their morning gains.
In the chipmaker sector, the leaders of the previous session’s decline moved to confident growth: Micron Technology shares jumped 9.9%, AMD rose 5.1%, Broadcom recovered part of its losses, rising 2.8%, and Nvidia gained 1.7%. Tesla shares also had a strong session, rising 4.6%.
European indices closed mixed. By the end of the day, Germany’s DAX (DE40) fell by 0.58%, France’s CAC 40 (FR40) closed down 0.23%, Spain’s IBEX 35 (ES35) declined by 0.66%, while the UK’s FTSE 100 (UK100) ended the trading session slightly higher at 0.05%. A positive driver for the stock market was the temporary easing of geopolitical tensions: Iran announced the end of its current military operation against Israel, and Tel Aviv paused its retaliatory strikes, allowing the US to resume mediation talks with Tehran. Against this backdrop, yields on European government bonds declined, supporting a rebound in industrial and cyclical stocks.
The oil market saw large‑scale intraday volatility. During Asian trading, futures for US light crude WTI surged to 95 dollars per barrel amid news that Iran’s missile strikes on Israel had disrupted a fragile ceasefire. However, by the end of the session, prices sharply corrected downward, falling to 91 dollars per barrel after Tehran’s official statement announcing the cessation of military operations against Israel. The market was further cooled by comments from US President Donald Trump, who reported progress in dialogue with Iran and the proximity of a new agreement. In addition to diplomatic de‑escalation, prices were pressured by fundamental supply‑and‑demand factors. OPEC+ ministers approved a planned increase in production quotas in July by 188,000 barrels per day, ignoring local geopolitical risks. At the same time, the market absorbed weak statistics from Asia: China sharply reduced imports of raw materials from abroad. Due to high prices and risks in the Strait of Hormuz, the largest Asian consumer shifted to using its own strategic oil reserves, which significantly limited purchases on the spot market and eased pressure on global hydrocarbon supply.
On Friday, Japan’s Nikkei 225 (JP225) fell by 3.85%, China’s FTSE China A50 closed down 1.59%, Hong Kong’s Hang Seng (HK50) declined by 1.22%, and Australia’s ASX 200 (AU200) did not trade yesterday.
The offshore yuan (CNY) exchange rate showed remarkable stability, holding near 6.78 per US dollar. The national currency was supported by strong fresh data. China’s export sector demonstrated phenomenal resilience: in May, export volume jumped 19.4% year‑over‑year, reaching a historic high of 376.8 billion dollars. On the other hand, China’s imports in May also surprised, soaring by 27.4% to 271.4 billion dollars, significantly exceeding analysts’ conservative expectations of around 25%.
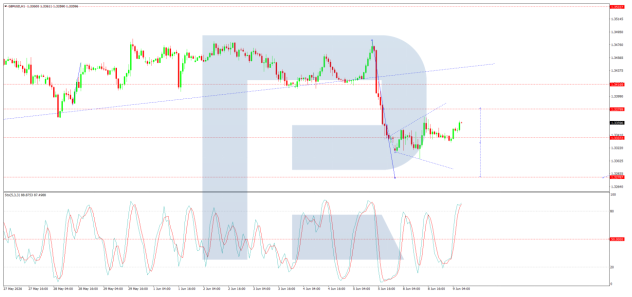
The Australian dollar (AUD) managed to rise above 0.705 US dollars, but this local move did not help the currency break out of its two‑month low zone. The “aussie” received some upward momentum amid overall improvement in global sentiment following news that Iran and Israel had announced a halt to mutual strikes. However, this moderate optimism is fully offset by harsh domestic economic realities and the persistent strength of the US dollar. According to fresh data from Westpac and the Melbourne Institute published on Tuesday, Australia’s Consumer Confidence Index fell by 2.9% (or almost 3%) in June, dropping to 80.6 points. This marked the fourth decline in the indicator since the beginning of the year.
S&P 500 (US500) 7,405.73 +21.99 (+0.30%)
Dow Jones (US30) 50,786.01 -80.77 (-0.16%)
DAX (DE40) 24,616.22 -142.83 (-0.58%)
FTSE 100 (UK100) 10,373.20 +5.15 (+0.05%)
USD Index 100.01 -0.06 (-0.06%)
News feed for: 2026.06.09
- Australia Westpac Consumer Confidence (m/m) at 03:30 (GMT+3) – AUD (LOW)
- Australia NAB Business Confidence (m/m) at 04:30 (GMT+3) – AUD (LOW)
- China Trade Balance (m/m) at 06:00 (GMT+3) – CHA50, HK50 (MED)
- German Trade Balance (m/m) at 09:00 (GMT+3) – EUR (LOW)
- German Industrial Production (m/m) at 09:00 (GMT+3) – EUR (LOW)
- Mexico Inflation Rate (m/m) at 15:00 (GMT+3) – MXN (MED)
- US Trade Balance (m/m) at 15:30 (GMT+3) – USD (MED)
- Canada Trade Balance (m/m) at 15:30 (GMT+3) – CAD (MED)
- US Existing Home Sales (m/m) at 17:00 (GMT+3) – USD (MED)
By JustMarkets
This article reflects a personal opinion and should not be interpreted as an investment advice, and/or offer, and/or a persistent request for carrying out financial transactions, and/or a guarantee, and/or a forecast of future events.


 Future missions may sample environments that could host life, such as Saturn’s moon Enceladus.


