🚨 HCI – HCI Group, Inc. has been added to our data-driven Watchlist.
Here are the details:
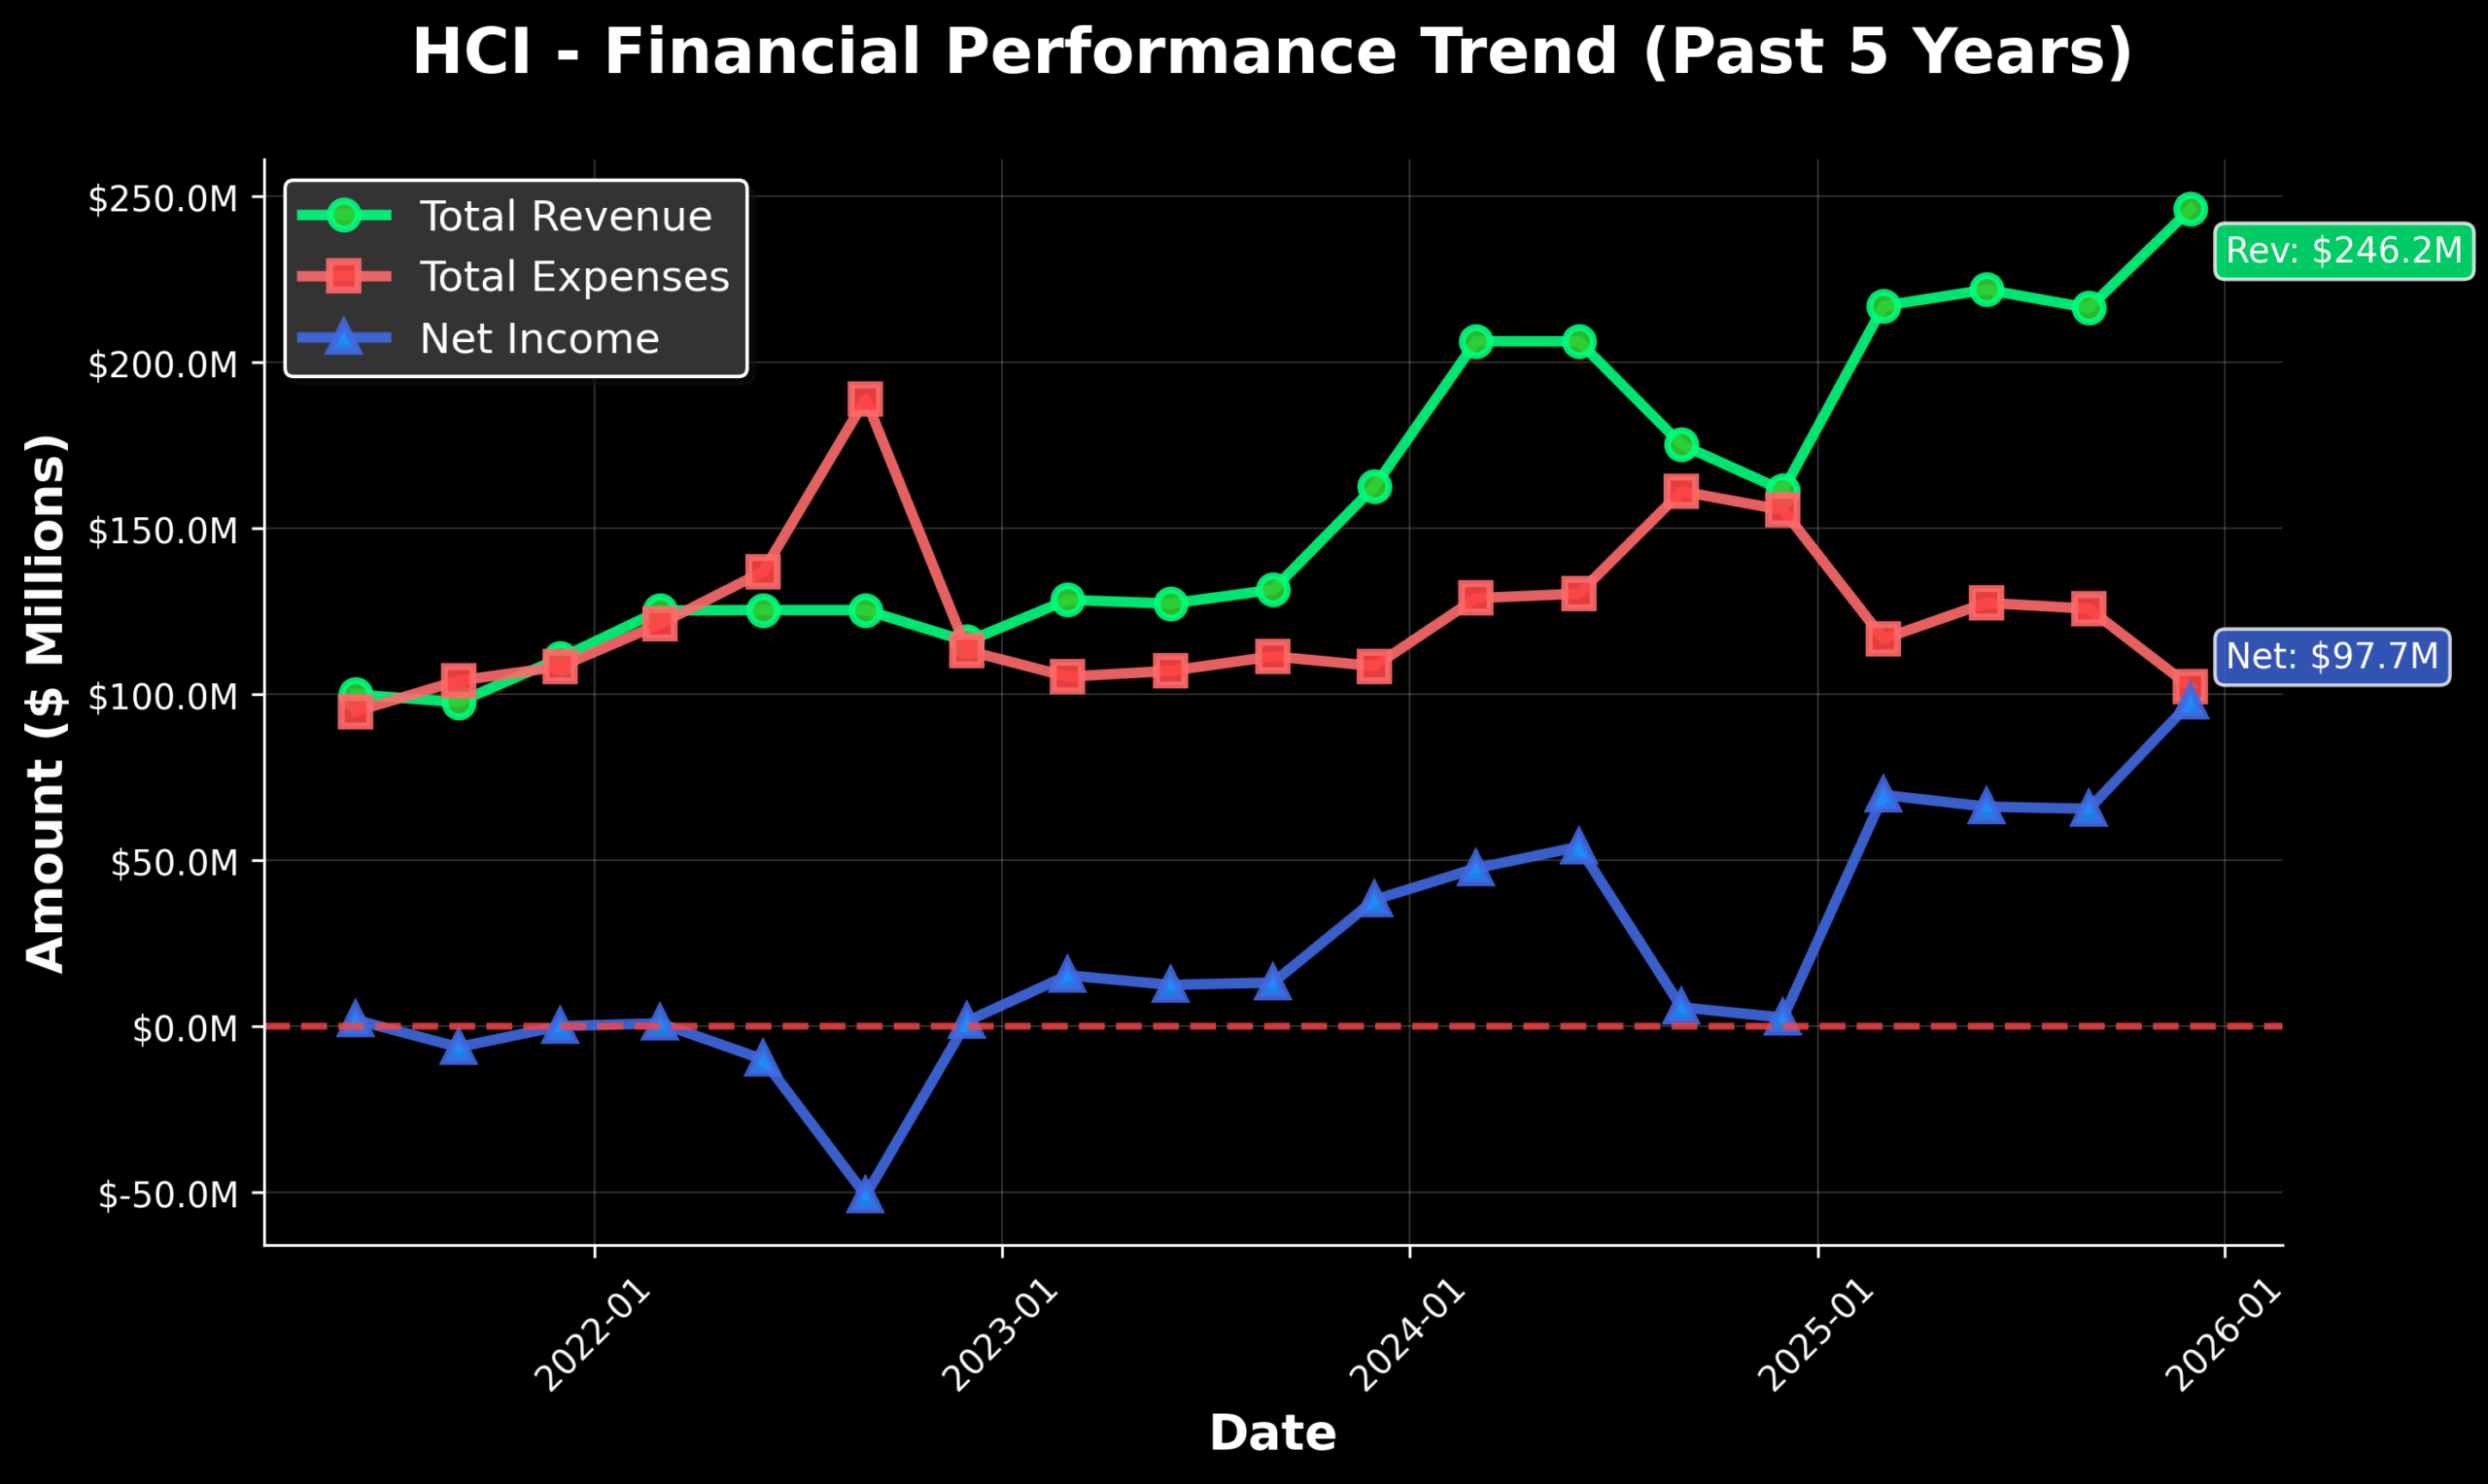
📈 HCI – HCI Group, Inc.
🏭 Sector: Financial Services (Insurance)
📊 Market Cap: Small / Micro Cap
⚡ Beta: 1.21 (High Risk)
📈 52W Performance: +11.09%
📊 Quant Score: 59/100 (Watchlist)
HCI Group has beaten its earnings-per-share estimates for four consecutive quarters. Currently, it has a dividend slightly above 1.00 percent, with a payout ratio of approximately just 7%. The current TTM P/E ratio is slightly above 6.50 with a 5-year average P/E around 12.33. The HCI earnings yield measures approximately 14.74 percent at time of writing
The price trend for HCI has been moving higher over the long-term with a sustained uptrend since a low of $27.65 in October of 2022. However, the stock has been retreating since a recent high in October 2025 at $210.50. Currently, the stock is hovering around the $153.85 per share level. The weekly Relative Strength Index (RSI) is currently at around 44.1 level and our trend-following model labels the current situation as bearish.
Full Disclosure: I do not currently own this stock. Disclaimer: Content is educational purposes and not intended as investment advice.
These stock selections are data-driven based on a number of financial metrics and ratios every quarter when earnings are released. These selections are intended to be a step one idea (not a buy signal) but to spur further research into the stock, its competitors and its industry.