BBY – Best Buy has been added to our data-driven Watchlist.
Here are the details:
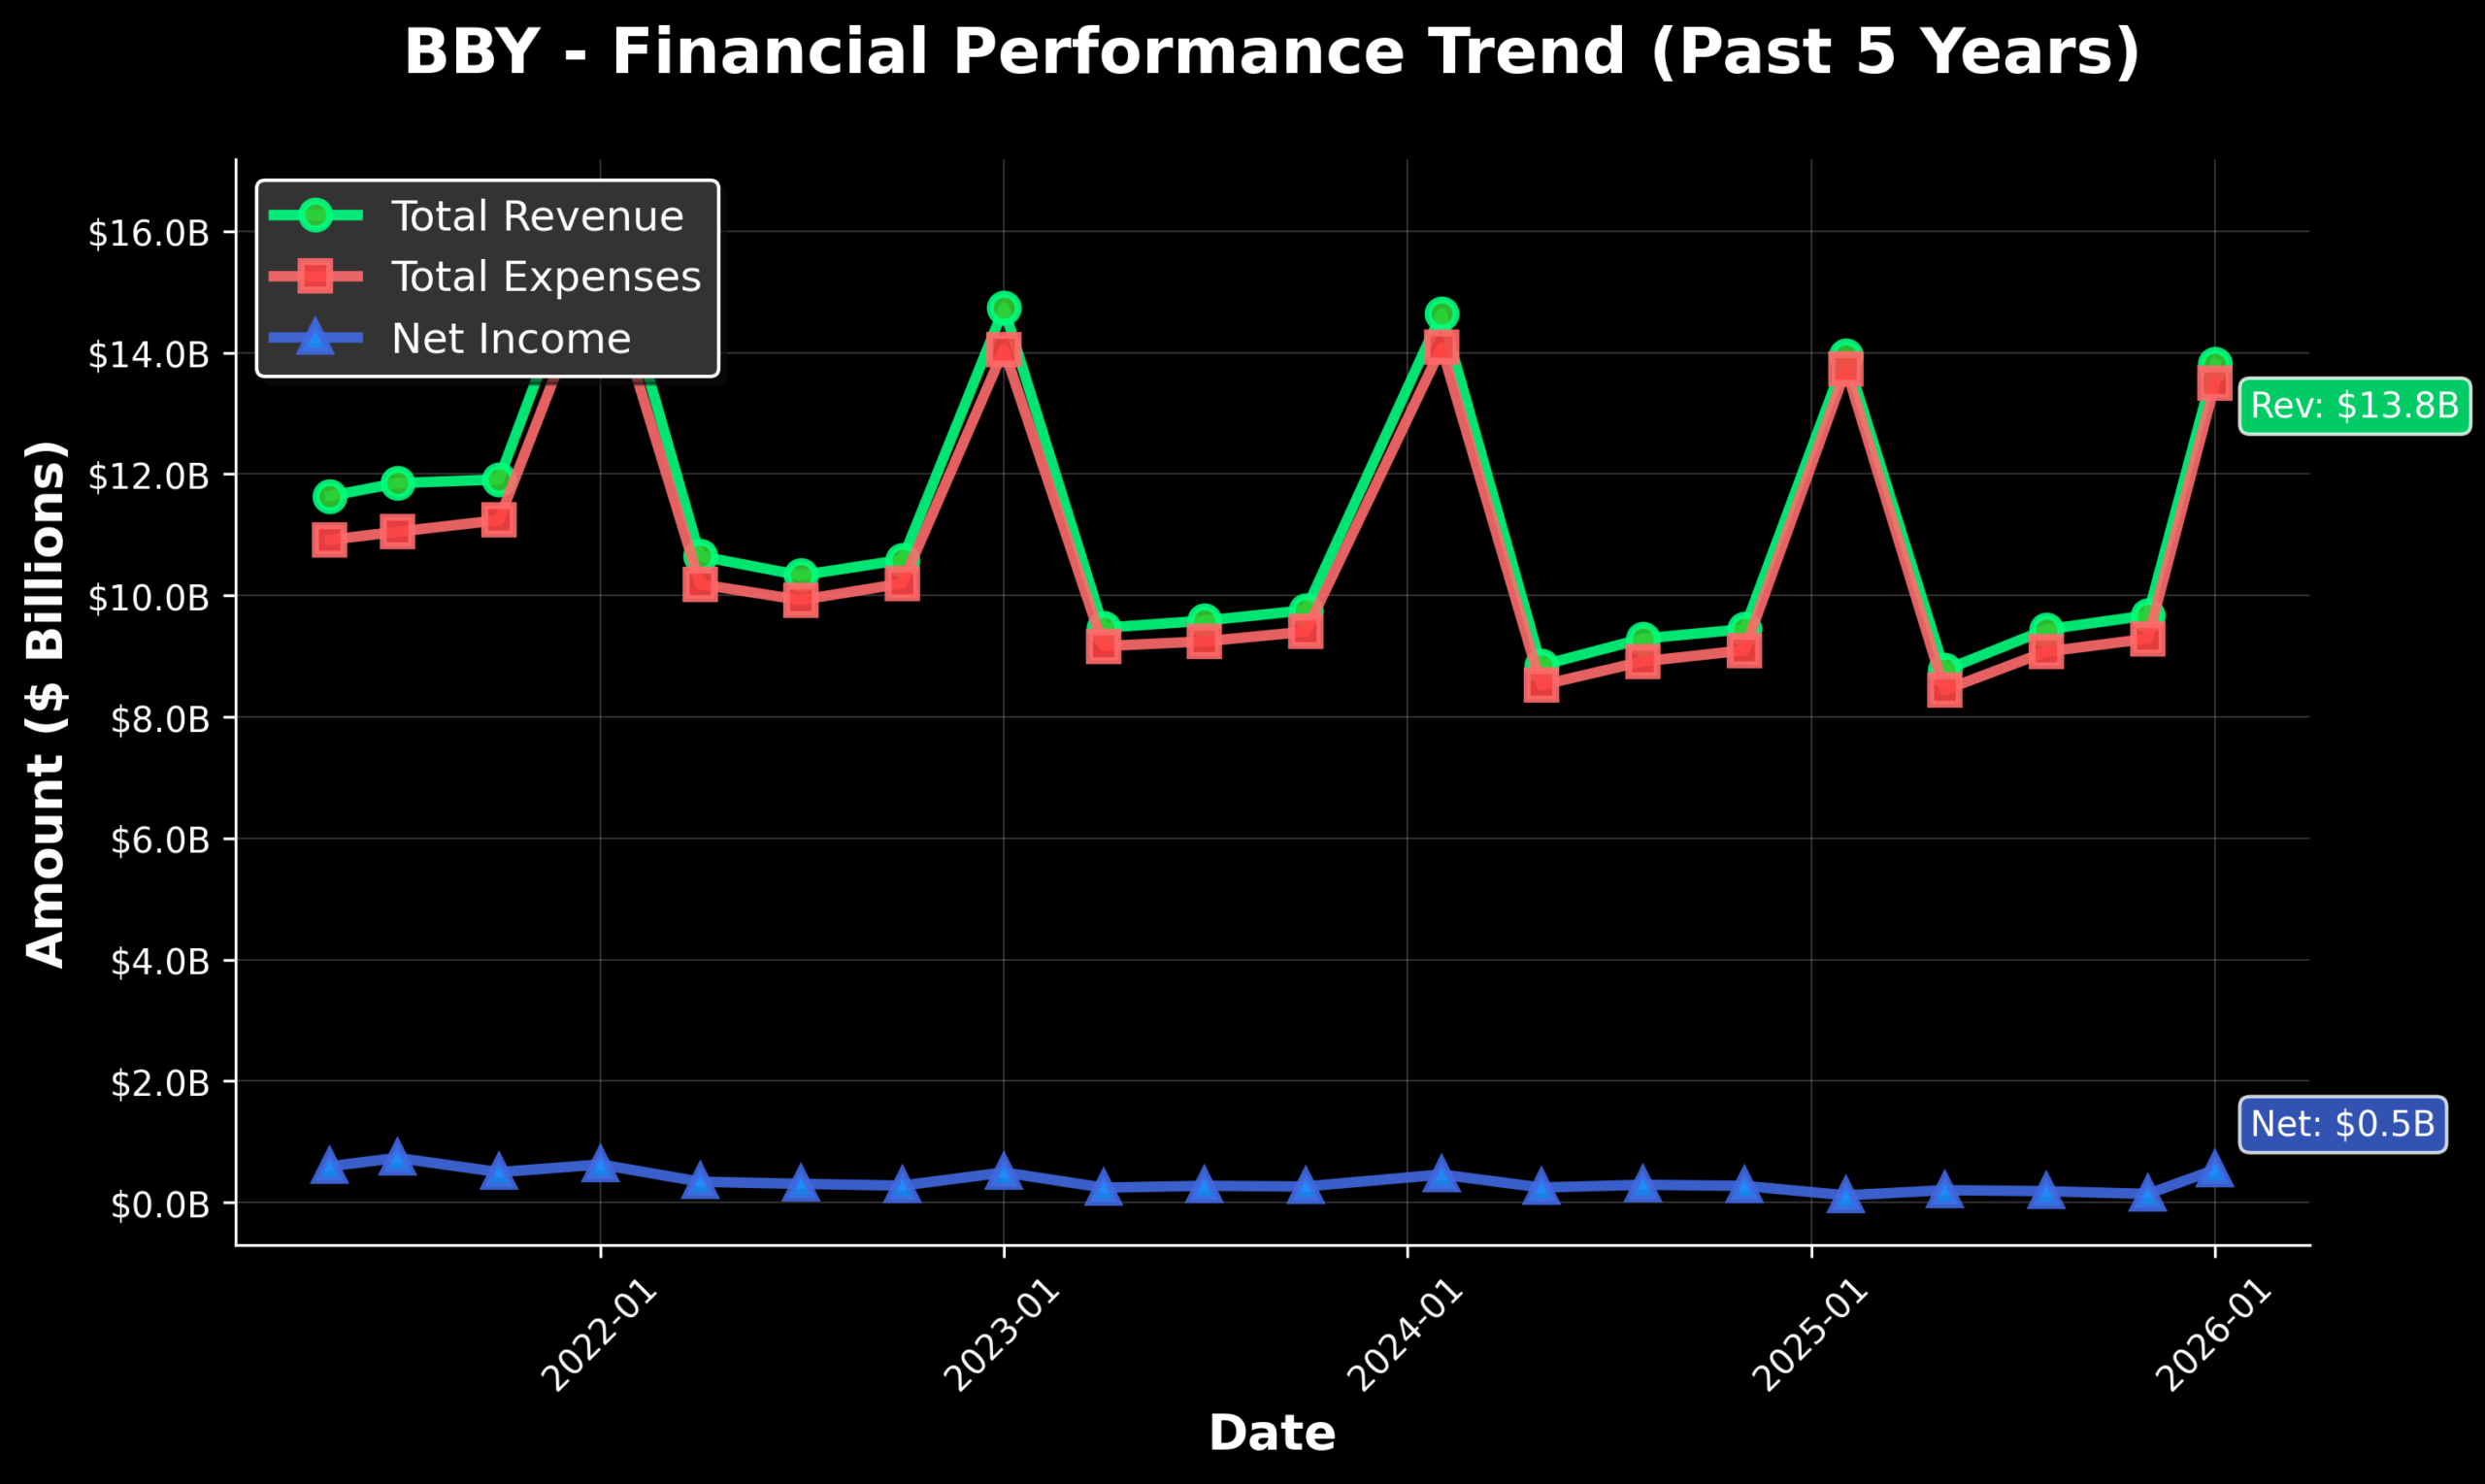
📈 BBY – Best Buy Co., Inc.
🏭 Sector: Consumer Cyclical
📊 Market Cap: Medium Cap
⚡ Beta: 1.44 (High Risk)
📉 52W Performance: -18.2%
👍 Quant Score: 69/100 (Fair)
Best Buy Co. has beaten its earnings-per-share estimates for four consecutive quarters. Currently, it has a high dividend above 6.00 percent, with a payout ratio of approximately 76%. The current TTM P/E ratio is slightly above 12 with a 5-year average P/E around 14.03. The BBY earnings yield measures 8.35 percent at time of writing
The price trend for BBY has been moving lower since a recent high in October, and currently, the stock is hovering around the $60 per share support level. The weekly Relative Strength Index (RSI) is currently at around 40.0 level and our trend-following model considers the current situation as bearish.
Full Disclosure: I do not currently own this stock. Disclaimer: Content is educational purposes and not intended as investment advice.