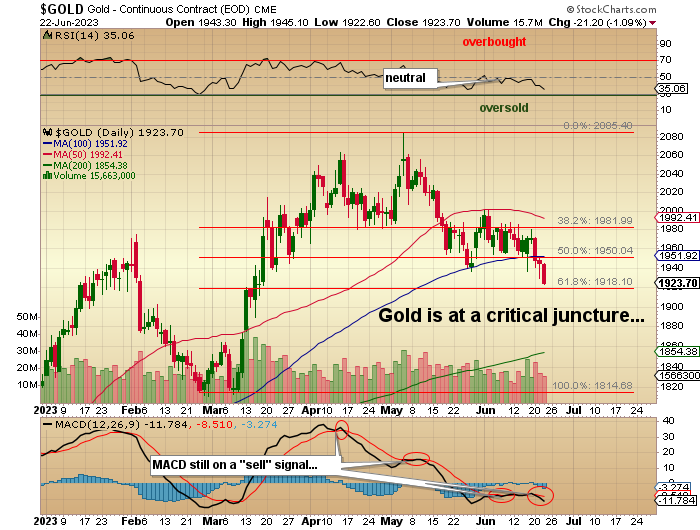
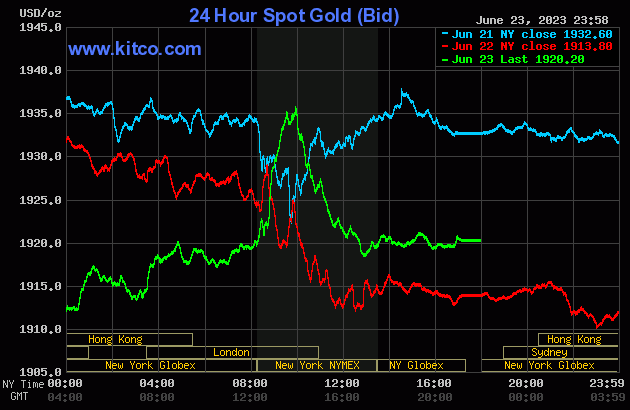
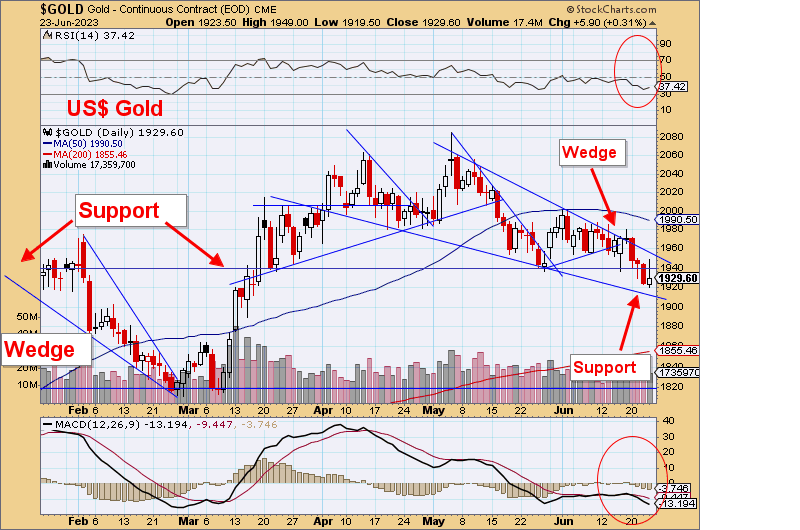
As I begin to write this week’s missive, gold bullion prices are ahead US$17.50. After trading down to a low of US$1,919.85, which is a couple of dollars above the 61.8% Fibonacci retracement level, gold has since recovered nearly US$50/ounce, which has the Twitter gold bugs aflutter in expectation of US$10,000 gold and US$400 silver. (Surely, he jests!)
In earlier times, I would also be one of those afluttering at the sharp price jump with the absolute certainty that the “powers that be” had finally seen the light and were finally embracing gold for its rightful role as “protector of savings” from the ravages of government waste and corruption. The duty of all governments should be to protect the purchasing power of people’s savings through responsible stewardship of sovereign finances. Still, over the past fifty years, re-election to the office by spending taxpayer money on prospective voters has replaced fiscal prudence, and that led to massive, global currency debasement.
With gold up US$17.50 an ounce, is it not proof positive that global attitudes have finally shifted? (Surely, he jests again!)
The Younger Generations and Gold
We, old people, tend to look at this younger breed of investors as if they are clueless, uneducated, ADHD-afflicted videogame junkies that are far more sheep than shepherds and prone to mass mania susceptibility due to their obsessions with social media trends.
Nothing could be farther from the truth. From what I have learned in recent weeks delving into the world of Millennials and Generation X-ers’ investment trends, these two demographics are distinctly more pragmatic than their predecessor generation — the Baby Boomer Generation — and as such, take a “Buy what’s working” attitude to investing as opposed to “Buy what isn’t working now but will work when the world wakes up” investment style.
History would prove that the North American investor has been riding a wave of bullish enthusiasm that began post-WII and which stalled in the 1970s just as the children of the recently-returned soldiers were reaching young adulthood.
The Baby Boomer Generation stopped the Viet Nam war through protests in the 1970s, and once they put away their bell-bottomed jeans and love beads for pin-striped suits and Brooks Brothers shoes, markets have not looked back.
The maturation of the largest generation of people ever created in the history of mankind brought about an ever-increasing demand for new products and new technology.
And it was largely to thank for a growth era that went largely uninterrupted for almost twenty years.
The problems started to creep up when the internet bubble imploded in 2001.
Ever since, the incessant demands of the boomers created an unhealthy creep of political malfeasance and fiscal compromise.
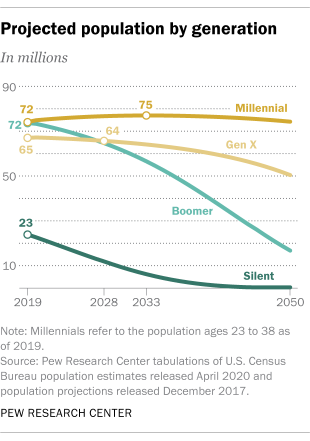
The boomers sucked the air out of any room they entered, and it did not go unnoticed by the younger generations, the largest of which is now the Millennials and will be joined by the Generation-Xer’s by the end of the decade.
I find it fascinating that these younger, more pragmatic souls refuse to enter into intelligent speculations on precious metals but move hog-wild on cryptocurrencies as the replacement for fiat currencies despite growing regulatory scrutiny and a distinctly hostile disposition by government regulators.
Boomers such as this author have long been enraged by similar interference in the metals markets through coordinated interventions in the paper markets like the Chicago Board of Trade or the Crimex.
And yet we still invest in gold and silver thinking (perhaps erroneously) that 5,000 years of safe haven replacements for hoarding cash representing the “full faith and credit of government” is sufficient justification for ownership, not to mention amassing, hoarding, and shameless stacking.
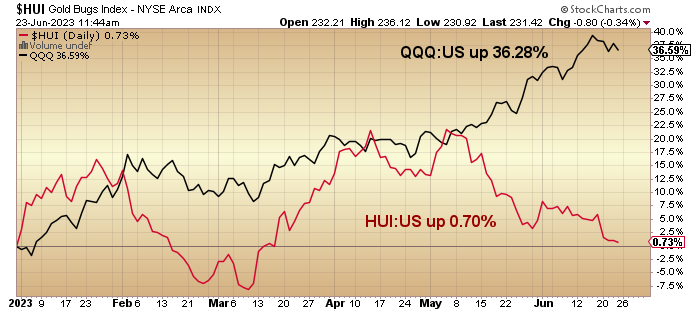
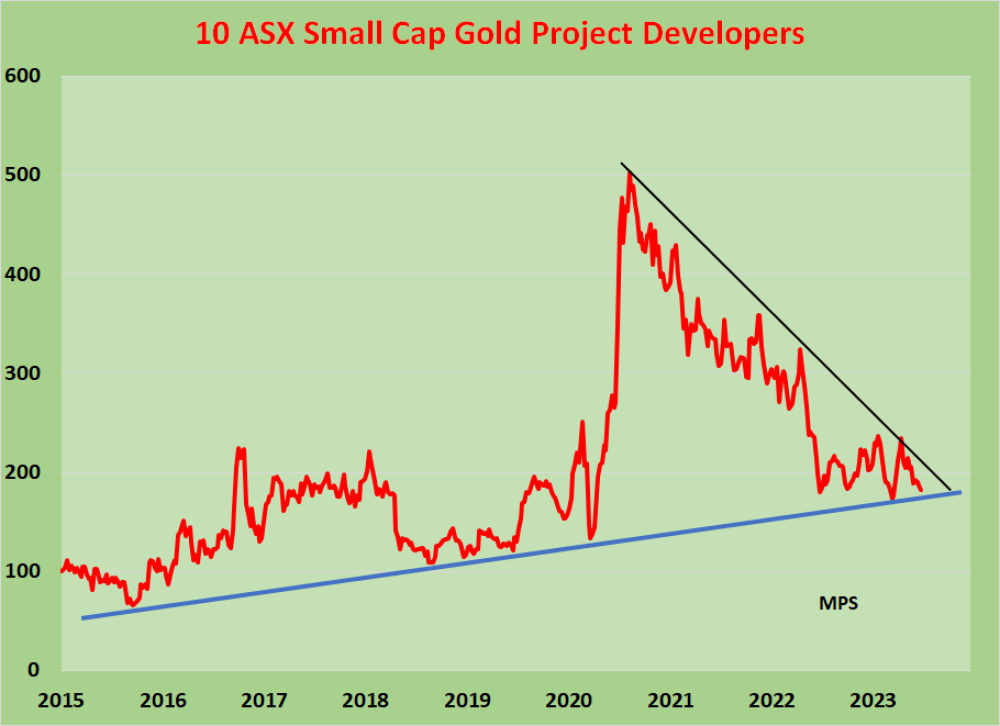
The “kiddies” (as I love to call them), many of which are now in their 40s and certainly not babies anymore, have learned over time that to own “what is working” means that they can buy Bitcoin (circa 2018) and a few tech stocks (through the QQQ’s) and let Zayde and Bubbe (Yiddish for Grandpa and Grandma) buy “what is NOT working (and hasn’t been since August/2020) like Newmont Gold and Foofoo Mines. The result shown above might be considered unfair because it excludes 2022 when crypto and tech got slaughtered, but then again, gold and silver did nothing then either.
I have been writing about gold and silver since the 1980s. Still, rather than evolving into a card-carrying gold bug complete with a megaphone, tinfoil hat, and multiple crying towels, I evolved into a pragmatist that has been able to sidestep the PMs from time to time in favor of other resource plays.
From what I have learned in recent weeks delving into the world of Millennials and Generation X-ers’ investment trends, these two demographics are distinctly more pragmatic than their predecessor generation — the Baby Boomer Generation — and as such, take a “Buy what’s working” attitude to investing as opposed to “Buy what isn’t working now but will work when the world wakes up” investment style.
Unfortunately, I was too incredibly smart to see that the electrification movement was going to benefit lithium over copper as the lithium stocks, despite correcting since 2022, continue to be the darlings of the resource stock universe.
If there is one significant takeaway from my musings this morning, it is that I wish I could find that memory-erasing gadget from Men in Black where Tommy Lee Jones can make entire crowds forget that a giant cockroach just emerged from the body of a tow-truck driver.
I would stand in front of a full-length mirror and ZAP! myself into forgetting I ever owned Consolidated Stikine, a junior gold explorer that went from CA$0.15 in early 1988 to over CA$70 per share by 1989 after discovering the massive Eskay Creek gold-silver deposit.
Then, I would conger up recollections of the mighty Voisey’s Bay discovery in NE Labrador in 1993, stare into the mirror, and ZAP! erase all vestiges of the move in Diamondfield Resources from pennies to over US$42.50 (after a 4:1 split). Then, and only then, could I return to uncluttered investing where I can buy “what’s working” — you know — hop in the shower and lather up on Nvidia or Tesla or into the hot tub with a tankard full of Microsoft ale or Bitcoin Beer.
Take out my cell phone and get up-to-the-microsecond updates on which pink sheet meme stock is about to be taken up by the flock of Millennials in charge of the pump.
If you all detect a trace of sarcasm in the preceding paragraph, please forgive me. I am a victim of my own success and a prisoner of my sexagenarian memory. As was phrased by one of my all-time favorite comedians of the old Borsht Belt circuit, Rodney Dangerfield, “It ain’t easy bein’ me!” (No jest intended.)
Recession
The decade of the 1980s started off with a stock market that bottomed with the Dow Jones Industrials just under 800 and after a two-year recession brought on by the inflation-fighting antics of Paul (I Hate Gold) Volcker, jump-started one of the truly great growth stock revivals in modern history. Technology stocks included IBM and Digital Electric and were about as exciting in 1985 as Barrick Gold in 2023. It was only in the mid-80s, when Japan’s Sony developed the Nintendo videogame console, that technology exploded.
With the arrival of technology came the downfall of leisure time reading or listening to the phonograph or stereo to the serene incantations of David Gilmour’s guitar in Pink Floyd’s Dark Side of the Moon album, which demanded a “record player” rather than ear buds and a cellphone. “Eliminating bosses” at various levels of RPGs (role-playing games) replaced sandlot games of “workup’s baseball” or road hockey as preadolescent youth embarked on a journey of a cerebral rather than sensual nature of experimentation and discovery.
If every major hedge fund in New York and Connecticut owns Nvidia at 1,100-times sales, then we all better own it before the month-end report goes out to unitholders when all of the career-ending comparisons will be drawn.
When I was in the investment business in the 1980s, a site visit involved going 300 meters down into an old gold mine that had just been de-watered, seeing an old Toronto Telegram front page from 1966 lying beside an older snub-nosed coke bottle at the end of a mine “drift” was quite the experience.
Today, there are no site visits because insurance companies would never allow it. The kids that now run the operations would never allow prospective investors to cross the line of yellow tape as their grampas did. “Turning a blind eye” was commonplace because pragmatism had to supersede policy in order to advance the course of good business.
The art of due diligence is conducted somewhat differently today as the term “liquidity” is now seen as the main driver of stock prices in contrast to “fundamentals” like earnings or debt-to-equity ratios or competition. If every major hedge fund in New York and Connecticut owns Nvidia at 1,100 times sales, then we all better own it before the month-end report goes out to unitholders when all of the career-ending comparisons will be drawn. Same with the QQQ’s or the Russell 2000 (small-caps) as investors scramble to be invested in the “safety-in-numbers” pool rather than in the “out-and-without” pool of “big fat loser” ignonimity.
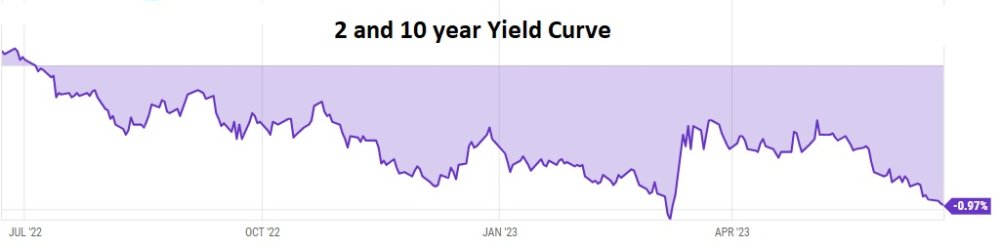
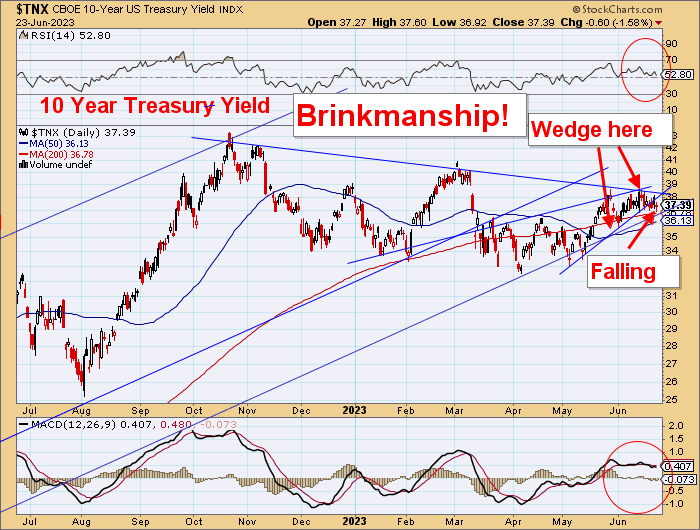
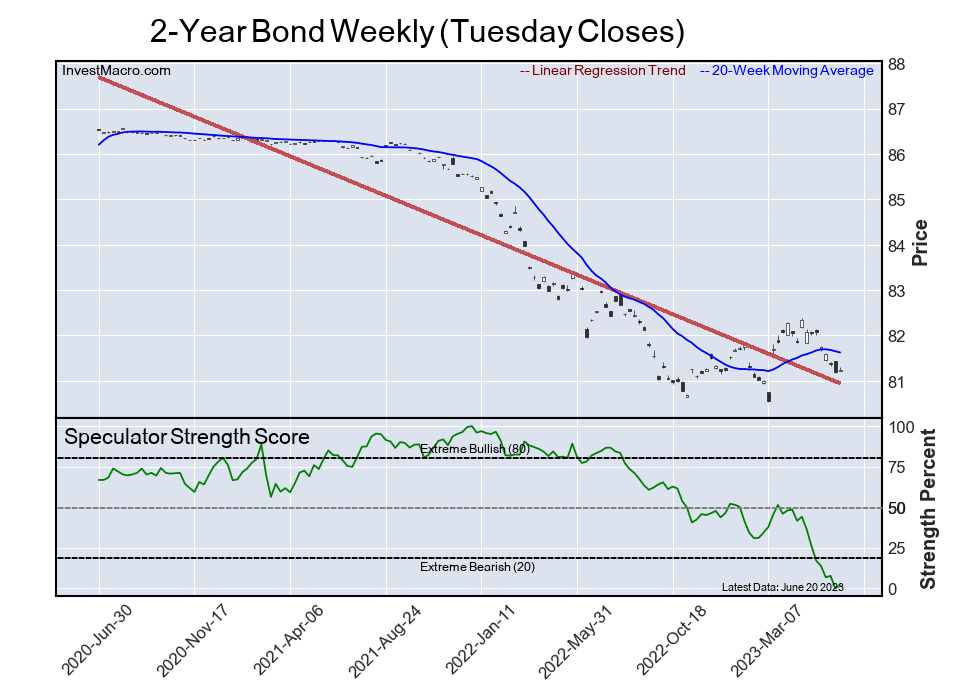
I look at the current 2-and-10-year yield curve, and I have only one thought: RECESSION.
At least from the point of view of historians/economists (like my colleague David Chapman @Davcha12 who has forgotten more than I will ever know about markets), it is certainly noteworthy that this recent spike in the 2-year and 10-year yield spread (the “yield curve”) came on the heels of the 50 basis-point hike by the BOE.
Spreads like this have in the past been a dyed-in-the-wool omen of impending economic recession but, like the current foo-fah-fah over the sudden and unexpected arrival of an “official bull” with the SPX recently printing a 20% advance off the October lows, they are simply “noteworthy,” just as the arrival of the inverted yield curve back in July/22 was screaming recession, here we are nearly a year later and still no signs of a recession. Maybe the recent highs in the SPX confirmed that the “official bull” should be treated as a “sell signal,” just as the arrival of the “official bear” was a near-perfect “buy signal” back on October 14.
The TSX Venture Exchange did the unthinkable this week and closed below the psychological 600 level, once again making it the laughing stock of the global exchanges.
I am today confronted with the dilemma of whether or not to trust the historical predictive powers of the inverted yield curve (where short rates yield more than long rates) because if we are NOT going to see a weaker economy and softer earnings, then stocks are cheap.
However, if the reverse is true and darker times are on the way, then I do not wish to be an owner of stocks or commodities in H2/2023.
In fact, I will be kicking myself for not trusting the fact that the “weighted” SPX is dismally underperforming the “unweighted” SPX, which is a classic case of horrid market breadth which used to be a stalwart in determining whether markets that appeared strong were actually internally weak which always leads to a selloff.
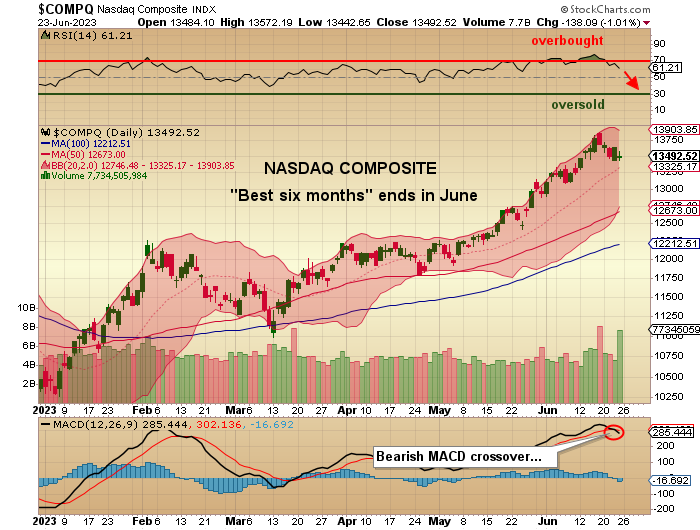
With the inverted yield curve at minus .97 and now approaching the extreme negative 2-10 spread at minus 1.02 from last March, the stage is set for a rollover of the tech sector, and I base that on the “Best Six Months” seasonality for the NASDAQ which typically ends in June and with the MACD Indicator issuing a “sell signal” today, we could be entering not a “summer rally” but rather a “summer correction” that will clip the underpinnings from all of this bullish sentiment that is urging everyone to disregard the Fed as being “no longer relevant.”
Well, they are truly “relevant” when they are cutting rates and buying MBS by the billions in order to resurrect stocks, but only when they are hostile do Wall Street and CNBC enjoy calling them “irrelevant.”
With the NASDAQ now officially rolling over, the QQQ’s are right behind, and since I am short the QQQ via a limited-risk position in the July put options, a 10% correction in these bubbly AI stock would certainly torpedo the summer rejoicing for more than a few of the Muskoka or Hamptons “flock.” However, it makes sense to expect and to benefit from a period of overdue profit-taking (and pain) without disturbing the longer-term positive trend confirmed by the bullish results of the January Barometer.
After all, there was a time not so long ago when 10% corrections were welcomed without hedge fund managers and CNBC anchors breaking into tears while demanding that the Fed “DOES SOMETHING!”
TSX Exchange Does the Unthinkable
The TSX Venture Exchange did the unthinkable this week and closed below the psychological 600 level, once again making it the laughing stock of the global exchanges. The only comparable exchange against which to measure performance is the U.S. Russell 2000, a small-cap index of non-earning corporate “hopefuls” that are in the same speculative category as the resource-based TSXV.
Surprisingly, while AI stocks and the NASDAQ have been dominating the narrative in a positive manner, the majority of higher-risk U.S. stocks have not fared as well as the TSX Venture Exchange. The TSXV is up 5.55% YTD, while the Russell 2000 is up only 3.85% YTD.
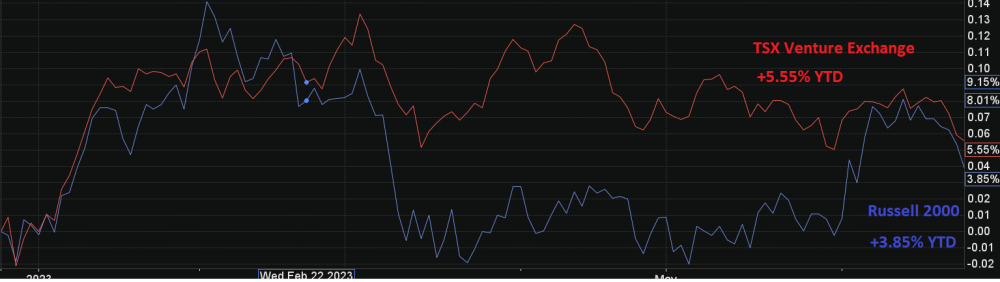
Both are pathetically underperforming relative to the NASDAQ, up 30.79% YTD, and the QQQ’s, up 20.93% YTD. Within the latter two vehicles, the bulk of the gains are narrow and concentrated in AI-related companies. So, for those of you that are feeling left behind by the “big U.S. tech rally,” the Russell 2000 and the blue-chip Dow Jones Industrials are neck-and-neck in performance, with the Russell nose ahead of the Dow, up a paltry 3.47% YTD thus illustrating just how bifurcated the investment landscape has become and how difficult it is to show consistent returns.
From where I sit, all the TSXV needs is a declining U.S. dollar leading to a commodity rally, the source of which can only happen if the trend of “real” interest rates (10-year yield minus CPI) trends negatively. In recent months, rising rates and moderating inflation has the yield on the UST 2-year at 4.71%, with the core CPI now down to 4.1%. In other words, “real” interest rates are trending positively at 0.61%, and if the Fed continues to hike and the U.S. economy continues to slow, the outcome favorable to commodities will be elusive.
You have heard me use the expression, “Never underestimate the replacement power of stocks within an inflationary spiral,” and the reason that works lies in the collateral that underpins the Fed’s beloved banking system.
You have heard me use the expression, “Never underestimate the replacement power of stocks within an inflationary spiral,” and the reason that works lies in the collateral that underpins the Fed’s beloved banking system.
Most of the suspect loans on the banks’ books have commercial real estate as collateral, and with office occupancy rates forcing commercial borrowers to throw back the keys, banks are going to need the replacement value of those empty skyscrapers to get an adrenalin injection from Grandpa Fed, and they are needing it now.
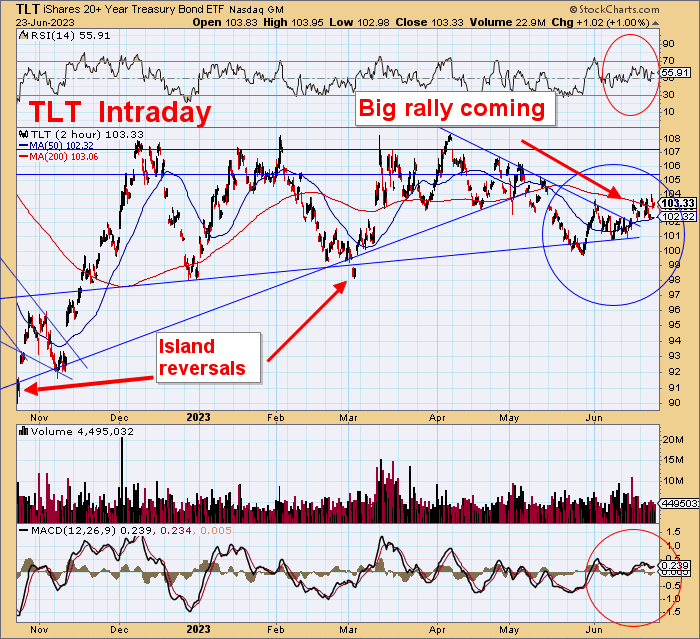
This is why stocks hate “deflation” and why banks are the purveyors of most of the inflation that is needed to shore up collateral and sanitize their loan books. Gold works in a deflationary environment because it has no master; its value is determined outside of the banking system. For this reason, if gold gets a sniff of a Fed initiative to lower interest rates or if it sees a pickup in the CPI without Fed opposition, it will scream to new highs before one can yell “transitory!”
So, given the state of commercial real estate and those dastardly loan books, my money is on an accident in one of the big U.S. cities related to defaults that lead to panic at the Fed that, in turn, leads to a series of emergency rate cuts that flips the interest rate regime from positive back to negative with precious metals the initial beneficiaries, just as they were in the months immediately after the 2008 bank bailouts and after the COVID crash triggered that unprecedented display of fiscal and monetary insanity that has caused the current inflationary mess upon which we are currently impaled.
My list of junior resource stocks is again forcing me to ignore my doctor’s orders and reach for the finely-aged bottle of single malt that, I am told, might kill me if taken to excess, given my age and temperament. However, I had to explain to him that stress is just as lethal as booze, and because I am holding all of these highly-promising junior resource deals as a means of ensuring that his bill will be paid, I might as well down a few belts of Glenfiddick each night to fight off the stress associated with these $%^%$$% juniors. Either that or sell the juniors.
Hmmm, I hadn’t thought of that. . .
Important Disclosures:
- Statements and opinions expressed are the opinions of the author and not of Streetwise Reports or its officers. The author is wholly responsible for the validity of the statements. The author was not paid by Streetwise Reports for this article. Streetwise Reports was not paid by the author to publish or syndicate this article. Streetwise Reports requires contributing authors to disclose any shareholdings in, or economic relationships with, companies that they write about. Streetwise Reports relies upon the authors to accurately provide this information and Streetwise Reports has no means of verifying its accuracy.
- This article does not constitute investment advice. Each reader is encouraged to consult with his or her individual financial professional and any action a reader takes as a result of information presented here is his or her own responsibility. By opening this page, each reader accepts and agrees to Streetwise Reports’ terms of use and full legal disclaimer. This article is not a solicitation for investment. Streetwise Reports does not render general or specific investment advice and the information on Streetwise Reports should not be considered a recommendation to buy or sell any security. Streetwise Reports does not endorse or recommend the business, products, services or securities of any company mentioned on Streetwise Reports.
For additional disclosures, please click here.
Michael Ballanger Disclosures
This letter makes no guarantee or warranty on the accuracy or completeness of the data provided. Nothing contained herein is intended or shall be deemed to be investment advice, implied or otherwise. This letter represents my views and replicates trades that I am making but nothing more than that. Always consult your registered advisor to assist you with your investments. I accept no liability for any loss arising from the use of the data contained on this letter. Options and junior mining stocks contain a high level of risk that may result in the loss of part or all invested capital and therefore are suitable for experienced and professional investors and traders only. One should be familiar with the risks involved in junior mining and options trading and we recommend consulting a financial adviser if you feel you do not understand the risks involved.


