
Source: Michael Ballanger (7/3/23)
With investors scrambling at buzzwords, Michael Ballanger of GGM Advisory Inc. looks at one company he believes is a winner beyond the exciting jargon of the day.
There are moments in my long career that stand out as “watershed” moments where a simple telephone call or a chance meeting at a mining conference created an impression upon me that had a discernible impact on my life at the time. The memories of those conversations are vivid, and they rarely leave me, especially when I am confronted with that eerie feeling that occurs at the precise moment of revelation that something important just happened.
A few years back, I wrote a piece entitled “Serendipity,” where I spoke of events that occurred while boating or playing sports or searching out investment ideas that came literally “out of the blue,” as in totally unexpected occurrences but because the outcomes were always favorable, they stand out over the years as “life lessons” and deserve to be passed along.
I was once in a meeting where one of my partners, a rough-and-tumble prison guard from LaRonge, Saskatchewan, got out of his seat and proceeded to explain in no uncertain terms that since stock certificates are made out of newsprint, they deserve little more value than the paper with which they are printed.
When it is all said and done, these glamorized slabs of altered newsprint are really only worth the people that put their names to the certificate, which is why professional money managers would tell us that of all the bullet points on their “Prerequisites for Investment,” there is only one word that matters, and that is the word “management.”
His crystallizing line came when this strapping Prairie lad told the group that “the last time I looked, newsprint is going for a buck eighty-six a pound!”
That statement, coming from a man with, shall I say, “limited” knowledge of the securities world, enlightened me to the stark reality that not all citizens of this planet look at stock certificates with the same kind of shock and awe envy.
Stock certificates are indeed nearly worthless in and of themselves, and only when they are recognized as “titles” to a share of a venture do they begin to get recognition.
In the current market environment, pieces of finely crafted newsprint with detailed etching and meticulous legal scribbling can be worth next to nothing if the word “gold” is contained in the scribbling, or it can be worth a small fortune if the words “artificial intelligence” can be seen.
Ten years ago in Canada, the word “cannabis” magically elevated the value of a tenth-of-a-pound certificate to many times the going rate for newsprint, and a few years later, the word “crypto” replaced “cannabis” creating yet another generation of self-enabled millionaires scalping trading profits from the safety of their cellphones.
When it is all said and done, these glamorized slabs of altered newsprint are really only worth the people that put their names to the certificate, which is why professional money managers would tell us that of all the bullet points on their “Prerequisites for Investment,” there is only one word that matters, and that is the word “management.”
Volt Lithium
With the prior few paragraphs as the appropriate preamble, it is no accident that I had yet another magical moment that only with the fullness of time can be classified as “life-altering.”
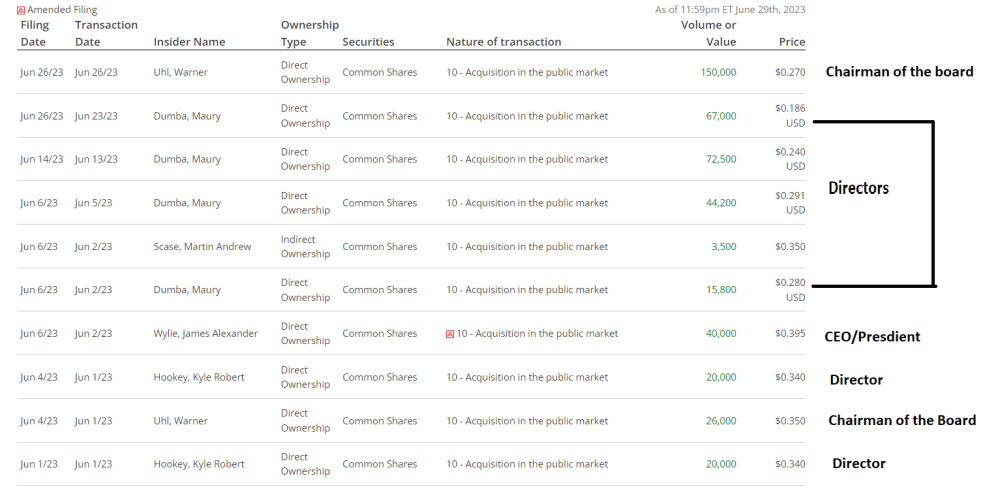
I was scanning a few of the websites that cover the companies I follow and about which I write from time to time when I came across a site that posted a screenshot of a list of insiders that had been recently buying stock. As I peered down the list, I came across the name of the Chairman of the Board of a company that I have owned since early 2021, Warner Uhl, with the company being Volt Lithium Corp. (VLT:TSV;VLTLF:US).
It seems that with the stock price down over 65% from the May 24 peak, Mr. Uhl decided to do what I have been doing, and that is buying more of that “glorified newsprint.”
I have spoken to Warner Uhl perhaps twice in my life going back to mid-2021 when I was trying to get a handle on the direction of his company (then called Allied Copper Corp.) after some early hiccups resulted in a trading halt. The second call was after I noticed his first (small) insider transaction, which was just after they announced the move to amalgamate with Volt Lithium Corp. Without hesitation, I rang him up after a brief conversation. I was delighted to learn that he was an aficionado of lithium as well as copper and that he would be staying on as Chairman.
Fast-forward to June 27, 2023.
Insiders of junior Canadian resource deals rarely buy positions in their own deals; they prefer to use the “Directors’ Incentive Options” instead of their own cash to beef up their notional, if not actual, ownership. With markets on the defensive and retail investors puking out positions at the first sign of any size bids, I found the recent insider activity at Volt to be a breath of fresh air but this last purchase by Mr. Uhl caught my undivided attention.
Why Buy Now?
Why buy now? I picked up the phone resulting in a 25-minute conversation with a man who, in his early career, toiled on the Mt. Milligan Project, and the best description of his contribution can be gleaned only after lifting it from his impressive resumé:
2009 – 2013 Project Director, AMEC (Mt. Milligan project)
- Project Director for EPCM services, in a joint venture with Fluor, for a 60,000 tpd copper-gold project with open-pit mining, conventional concentrator, gold gravity concentration, water treatment, tailings management, utilities and infrastructure, and an offsite concentrate loading and handling facility. Managed an engineering staff of 250 and an onsite staff of 120 persons overseeing a peak of 1,600 contractors. Oversaw the design, permitting, construction, and commissioning. The work that Mr. Uhl directed was built under budget and on time. Over 5.0 million man-hours without a lost-time accident. All this was accomplished with a very inexperienced industrial workforce and significant participation by local indigenous companies.
For the past several years, Warner has toiled for the mighty Worley Canada, providers of professional services in the energy, chemicals, and resources sectors (including copper and lithium). His title is “Regional Director for Study Management in the Americas, Technology and Expert Solutions, Worley, Canada.”
Warner has over three-hundred project study managers and engineers reporting to him on various projects within a larger company employing over 50,000 people and generating over US$10 billion in sales.

Now, buying 150,000 shares in the open market for CA$40,500 may not seem like a big deal, but to my sexagenarian eyes, it was like a message from the Messiah. I asked Warner today why he bought the stock, and his reply was quite simple. The market was missing the significance of the last press release, which, after third-party vetting and sign-off by Sproule Inc., reported that their pilot plant test confirmed the cost per tonne of a mere US$3,977 required to produce 1,000 tonnes of lithium carbonate from the oilfield brines.
It seems that the “knock” on Volt is that few investors believe their claim that their Direct Lithium Extraction (DLE) technology actually works. There are a number of companies out there that shall remain anonymous that think that their DLE technology will work on a larger scale basis, but to date, nothing compares to Volt.
By calling Warner Uhl, whose company is currently working on a US$3 billion lithium extraction deal in Argentina, I asked a man that knows lithium extraction and all of the challenges to commercial processing of oilfield brines WHY he bought the stock. As obvious as the answer is to everyone close to the deal, It was almost an embarrassment to ask that question.
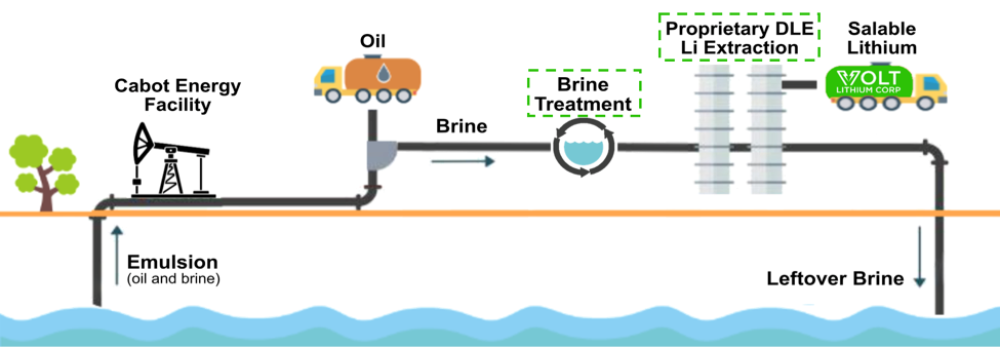
Volt Lithium Process
His answer was exactly as one would expect; based upon the extrapolation of prospective profitability using a DLE technology that he trusts, the stock price was “disconnected” from its market potential.
The market “disconnect” lies in the mistaken assumption that Volt’s claim is either overstated or false, but if one drills down into Sproule, one will quickly appreciate the significance of their involvement and why IIROC gave their blessing on the release.
Warner went on to explain the “green company” benefits whereby Volt returns formerly toxic brines to the subsurface aquifer in pristine shape, free of all impurities, including oil, for which they are paid a royalty by Cabot Energy. This is a feature of immense benefit to politicians, and with a great deal of government money allocated to the battery metals hunt and to water treatment, it is not a stretch to expect Volt to be approved for government grants as a means of defraying commercial development costs.
“I would urge all shareholders to do what they can to retain their positions because as a longer-term investment, I think they will do quite well.”
That is an endorsement of the highest order from Volt’s Chairman and a person with decades of experience in the building of mines around the world and who is on the record as a buyer of shares.
Under threat of “overkill,” I want to hammer home the significance of Volt’s insider activity, and as you can observe from the graphic shown below, it is not only the Chairman adding to positions. Several directors, as well as CEO Alex Wiley, have stepped up to take advantage of the recent weakness, and over my many decades of dodging the poisonous darts of the insidious TSX Venture Exchange, this is an extremely valuable tool and certainly must be heeded.
Whenever you get a stock guy (me) with several decades behind him discussing DLE technology with a veteran mine builder and engineer (Uhl), it can many times be a difficult interaction, but I have always gravitated to the technical people rather than the “pitchmen” because the validity of the “pitch” lies solely in the hands of the technicians.
Over the past forty-five years, I have encountered so much horse manure in the boardrooms of Bay and Granville Streets that I could fertilize the Canadian Prairies if I could ever have bottled it. This is why the actions of Warner Uhl spoke louder than anything on their website or in their power-point presentation. When phenomenal growth stories are disconnected from the market due to faulty assumptions, they represent truly unique opportunities once one is able to define the disconnect.
As I have now explained this “disconnect,” it explains why Volt Lithium Corp. is now my largest holding and why I am adding to the position from the grandkids’ education pool and Granny’s bingo money and since Granny will want that money back by Labor Day, I must be very confident.
Important Disclosures:
- As of the date of this article, officers and/or employees of Streetwise Reports LLC (including members of their household) own securities of Volt Lithium Corp.
- Michael Ballanger: I, or members of my immediate household or family, own securities of: Volt Lithium Corp. I determined which companies would be included in this article based on my research and understanding of the sector.
- Statements and opinions expressed are the opinions of the author and not of Streetwise Reports or its officers. The author is wholly responsible for the validity of the statements. The author was not paid by Streetwise Reports for this article. Streetwise Reports was not paid by the author to publish or syndicate this article. Streetwise Reports requires contributing authors to disclose any shareholdings in, or economic relationships with, companies that they write about. Streetwise Reports relies upon the authors to accurately provide this information and Streetwise Reports has no means of verifying its accuracy.
- This article does not constitute investment advice. Each reader is encouraged to consult with his or her individual financial professional. By opening this page, each reader accepts and agrees to Streetwise Reports’ terms of use and full legal disclaimer. This article is not a solicitation for investment. Streetwise Reports does not render general or specific investment advice and the information on Streetwise Reports should not be considered a recommendation to buy or sell any security. Streetwise Reports does not endorse or recommend the business, products, services or securities of any company.
For additional disclosures, please click here.
Michael Ballanger Disclosures
This letter makes no guarantee or warranty on the accuracy or completeness of the data provided. Nothing contained herein is intended or shall be deemed to be investment advice, implied or otherwise. This letter represents my views and replicates trades that I am making but nothing more than that. Always consult your registered advisor to assist you with your investments. I accept no liability for any loss arising from the use of the data contained on this letter. Options and junior mining stocks contain a high level of risk that may result in the loss of part or all invested capital and therefore are suitable for experienced and professional investors and traders only. One should be familiar with the risks involved in junior mining and options trading and we recommend consulting a financial adviser if you feel you do not understand the risks involved.


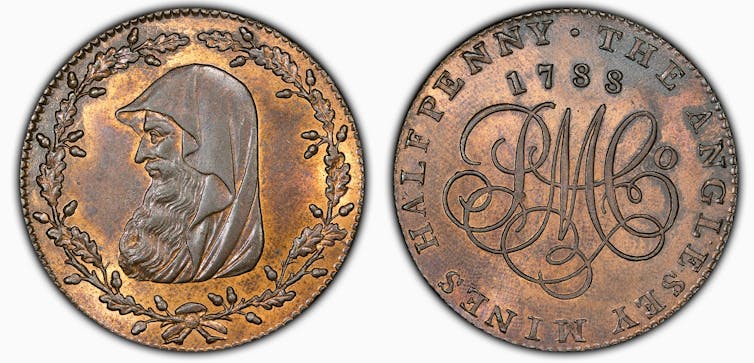 A halfpenny token issued by the Parys Mining Company of Anglesey in 1788. The hooded druid design was used for many years and was the first of hundreds of token designs.

