By George Kladakis, Edinburgh Napier University and Alexandros Skouralis, City, University of London
The US banking crisis triggered worries about the global banking system earlier in the year. Three mid-sized US banks, Silicon Valley Bank, Silvergate and Signature, fell in quick succession, driving down bank share-prices across the world.
America’s central bank, the Federal Reserve, made significant amounts of cash available to the failed banks and created a lending facility for other struggling institutions. This calmed investors and prevented immediate contagion, with only one more US regional bank, First Republic, collapsing a few weeks later.
Yet it’s far from clear whether the crisis is really over. As traders return from their summer holidays to a period commonly associated with upheaval in the markets, how are things likely to play out?
Tight margins and dwindling deposits
Central banks have continued to increase interest rates to counter sustained inflation in recent months. In July, the Fed raised its key interest rate to as much as 5.5%, the highest in 20 years. The rate was near zero as recently as February 2022.
Though the increases have slowed this year, such a sudden change can be very harmful for banks – particularly as part of the sort of U-shaped movement in rates that we have seen since the global financial crisis of 2007-09.
US benchmark interest rate, 2007-23

Raising rates reduces the value of banks’ assets, increases what they have to pay to borrow, limits their profitability and generally increases their vulnerability to adverse events. Especially in the first half of 2023, banks have had to cope with low loan growth and high deposit costs, meaning the amount they have to pay out in relation to customers’ deposits.
This increased cost is partly because lots of customers have been withdrawing their money and putting it into places where they can make more interest, such as money market funds. It forced banks to borrow more from the Fed to ensure they have enough money, and at rates much higher than they used to be.
This was one of the reasons for the banking collapses in the spring, destabilising them at a time when the value of the debt on their balance sheets had also fallen sharply. This saw more customers at other banks withdrawing deposits for fear that their money wasn’t safe either. In sum, US banks saw deposits declining between June 2022 and June 2023 by almost 4%. Together with higher interest rates, this is generally bad news for the banking sector.
You can see the effect on banks’ profitability by looking at overall net interest margins (NIMs). These are a measure of what banks receive in interest income minus what they pay out to depositors and other funders.
US banks’ net interest margins (%)
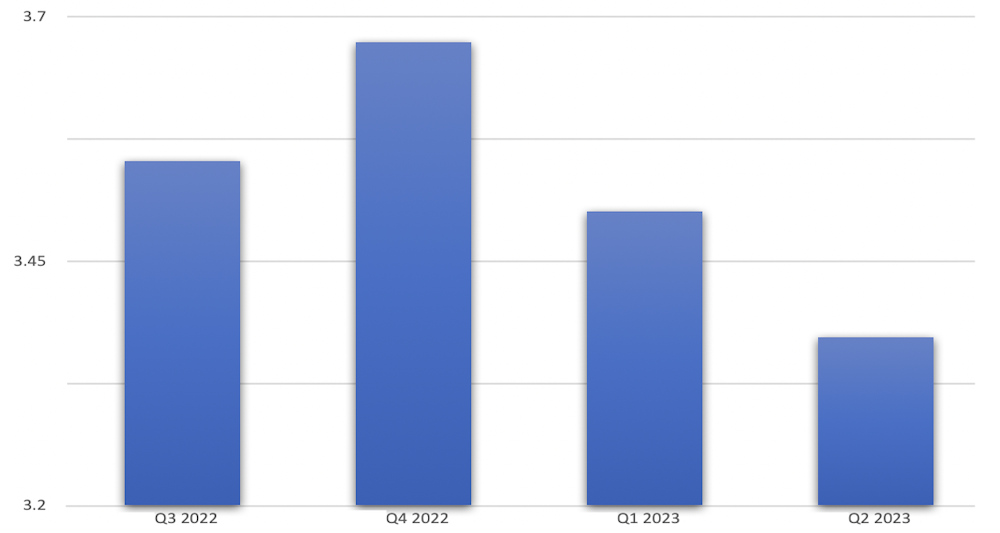
S&P Capital IQ
Credit rating downgrades
The ratings agencies have added further pressure. In early August, Fitch downgraded its rating of US government debt to AA+ from AAA. It cited a likely deterioration in the public finances over the next three years and the endless politicking around the debt ceiling, which is the maximum level that the government can borrow.
Sovereign downgrades often reflect problems in the wider economy. This can destabilise banks by making them seem less creditworthy, leading their credit ratings to be downgraded too. That can make it harder for them to borrow money from the markets or potentially even from the Fed. This can then have knock-on effects in reducing banks’ lending capacity, capital buffers for coping with bad debts, overall profitability and share prices.
US banks’ share prices 2023

Trading View
Sure enough, a week after the Fitch announcement, Moody’s downgraded the credit ratings of ten US mid-sized banks, citing growing financial risks and strains that could erode their profitability. It also warned that larger banks including Bank of New York Mellon and State Street were at risk of a future downgrade.
The other major ratings agency, S&P Global Ratings, has since followed suit, while Fitch is threatening to do likewise. Our research suggests bank downgrades are associated with making them riskier and more unstable, particularly when accompanied by a sovereign downgrade.
Having said all that, there are positives for US banks. Both interest rates and bank deposits are at least projected to stabilise in the coming months, which should help the sector. Despite the overall decline in banks’ profitability, bigger banks are reporting improved margins from charging higher interest on loans. Some of these banks also expect a boost from things like increased deal-making later in the year. Signs like those could help to bring more stability across the board.
In Europe, banks have seen reduced deposits and net interest margins in recent years, which helps to explain why Credit Suisse needed to be rescued by fellow Swiss bank UBS in March. Yet European deposits and profit margins have been recovering in the most recent couple of quarters. At the same time, the European Banking Authority’s recent stress tests concluded that large EU banks are robust.
UK banks appear to be in a slightly worse condition than EU banks. They remain resilient on their balance sheets, but their deposits have not recovered to quite the same extent as in Europe. They have also been adjusting down their profit forecasts in anticipation of further rate hikes by the Bank of England.
Regulatory intervention
To strengthen the US sector, the regulators are planning to further increase the minimum levels of capital that must be held by large US banks (with assets worth more than US$100 billion (£79 billion)).
These plans to increase banks’ capacity to absorb losses are encouraging, though will take more than four years to fully implement. The Basel II international banking rules were introduced to a similar end in 2004, but were not implemented in time to prevent the global financial crisis.
For the moment, the US banking system remains vulnerable both to shocks within the financial system and more general calamities. It will still be a few months before we can say with confidence that the worst is over.![]()
About the Author:
George Kladakis, Lecturer in Financial Services, Edinburgh Napier University and Alexandros Skouralis, Research Assistant, Bayes Business School, City, University of London
This article is republished from The Conversation under a Creative Commons license. Read the original article.