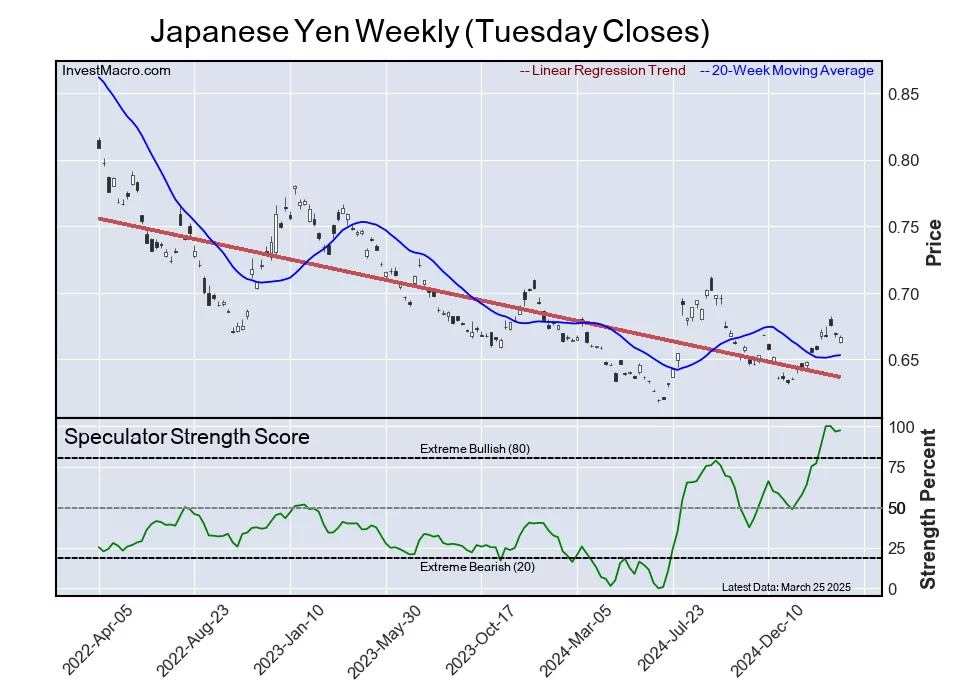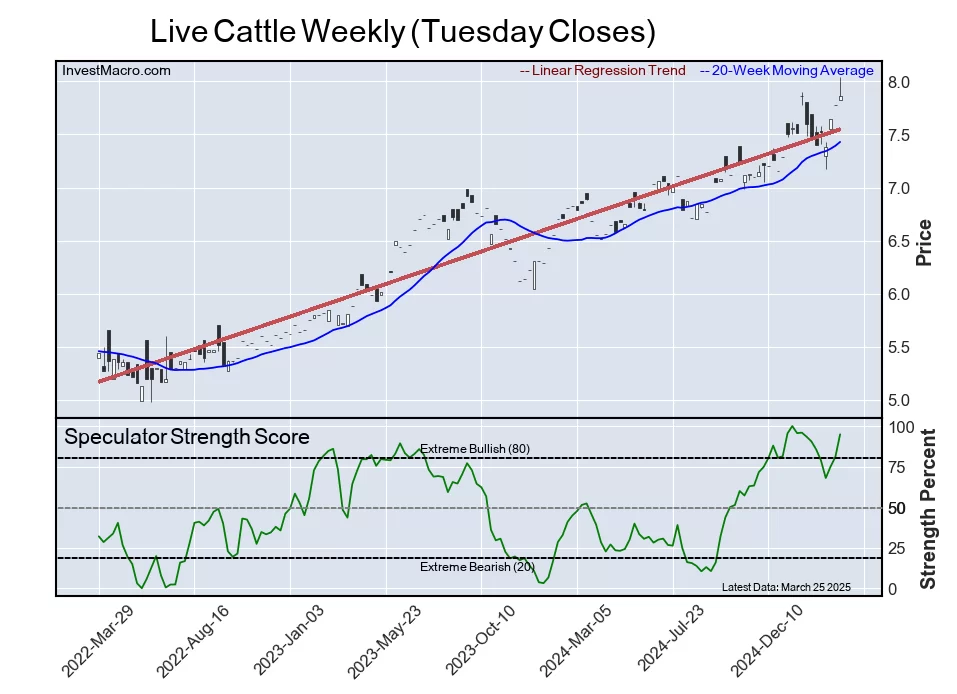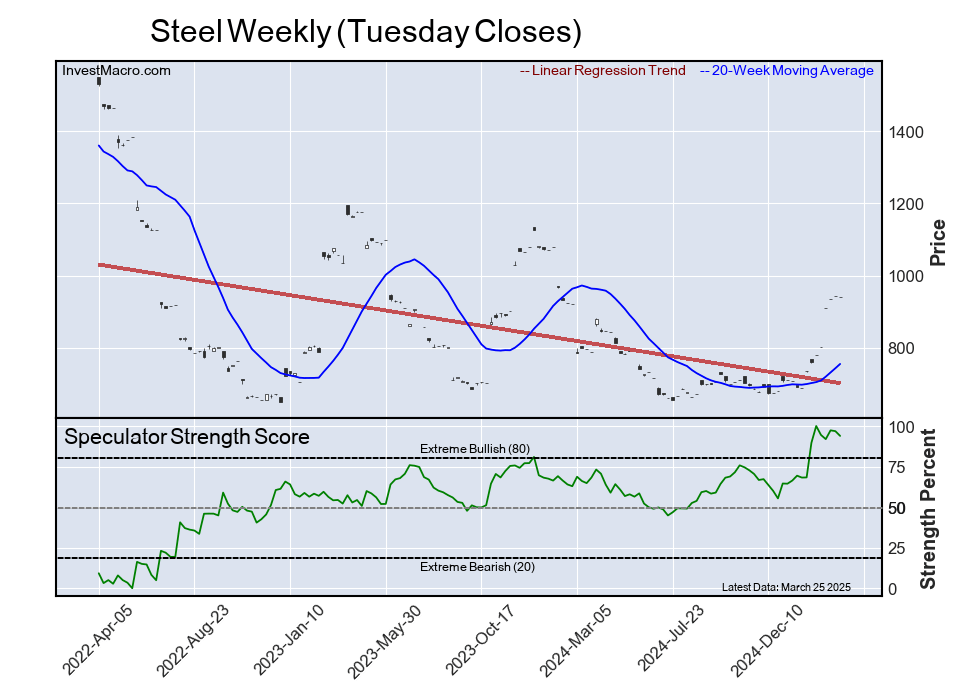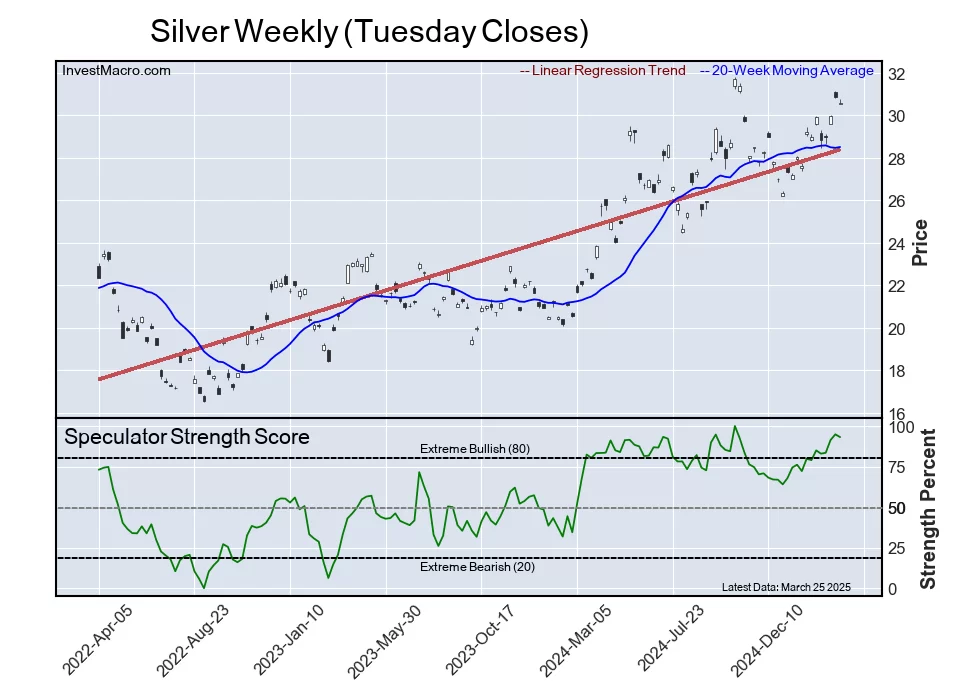
Archive for Opinions – Page 32

The trade deficit isn’t an emergency – it’s a sign of America’s strength

By Tarek Alexander Hassan, Boston University 

When U.S. President Donald Trump imposed sweeping new tariffs on imported goods on April 2, 2025 – upending global trade and sending markets into a tailspin – he presented the move as a response to a crisis. In an executive order released the same day, the White House said the move was necessary to address “the national emergency posed by the large and persistent trade deficit.”

A trade deficit – when a country imports more than it exports – is often viewed as a problem. And yes, the U.S. trade deficit is both large and persistent. Yet, as an economist who has taught international finance at Boston University, the University of Chicago and Harvard, I maintain that far from a national emergency, this persistent deficit is actually a sign of America’s financial and technological dominance.

The trade deficit is the flip side of an investment magnet

A trade deficit sounds bad, but it is neither good nor bad.

It doesn’t mean the U.S. is losing money. It simply means foreigners are sending the U.S. more goods than the U.S. is sending them. America is getting more cheap goods, and in return it is giving foreigners financial assets: dollars issued by the Federal Reserve, bonds from the U.S. government and American corporations, and stocks in newly created firms.

That is, a trade deficit can only arise if foreigners invest more in the U.S. than Americans invest abroad. In other words, a country can only have a trade deficit if it also has an equally sized investment surplus. The U.S. is able to sustain a large trade deficit because so many foreigners are eager to invest here.

Why? One major reason is the safety of the U.S. dollar. Around the world, from large corporations to ordinary households, the dollar is used for saving, trading and settling debts. As the world economy grows, so does foreigners’ demand for dollars and dollar-denominated assets, from cash to Treasury bills and corporate bonds.

Because the dollar is so attractive, the Federal Reserve gets to mint extra cash for use abroad, and the U.S. government and American employers and families can borrow money at lower interest rates. Foreigners eagerly buy these U.S. financial assets, which enables Americans to consume and invest more than they ordinarily could. In return for our financial assets, we buy more German machines, Scotch whiskey, Chinese smartphones, Mexican steel and so on.

Blaming foreigners for the trade deficit, therefore, is like blaming the bank for charging a low interest rate. We have a trade deficit because foreigners willingly charge us low interest rates – and we choose to spend that credit.

US entrepreneurship attracts global capital – and fuels the deficit

Another reason for foreigners’ steady demand for U.S. assets is American technological dominance: When aspiring entrepreneurs from around the world start new companies, they often decide to do so in Silicon Valley. Foreigners want to buy stocks and bonds in these new companies, again adding to the U.S. investment surplus.

This strong demand for U.S. assets also explains why Trump’s last trade war in 2018 did little to close the trade deficit: Tariffs, by themselves, do nothing to reduce foreigners’ demand for U.S. dollars, stocks and bonds. If the investment surplus doesn’t change, the trade deficit cannot change. Instead, the U.S. dollar just appreciates, so that imports get cheaper, undoing the effect of the tariff on the size of the trade deficit. This is basic economics: You can’t have an investment surplus and a trade surplus at the same time, which is why it’s silly to call for both.

It’s worth noting that no other country in the world enjoys a similarly sized investment surplus. If a normal country with a normal currency tries to print more money or issues more debt, its currency depreciates until its investment account – and its trade balance – goes back to something close to zero. America’s financial and technological dominance allows it to escape this dynamic.

That doesn’t mean all tariffs are bad or all trade is automatically good. But it does mean that the U.S. trade deficit, poorly named though it is, does not signify failure. It is, instead, the consequence – and the privilege – of outsized American global influence.

The president’s frenzied attacks on the nation’s trade deficit show he’s misreading a sign of American economic strength as a weakness. If the president really wants to eliminate the trade deficit, his best option is to rein in the federal budget deficit, which would naturally reduce capital inflows by raising domestic savings.

Rather than reviving U.S. manufacturing, Trump’s extreme tariffs and erratic foreign policy are likely to instead scare off foreign investors altogether and undercut the dollar’s global role. That would indeed shrink the trade deficit – but only by eroding the very pillars of the country’s economic dominance, at a steep cost to American firms and families.The Conversation

About the Author:

Tarek Alexander Hassan, Professor of Economics, Boston University

This article is republished from The Conversation under a Creative Commons license. Read the original article.


Dumb, Dumber and Dumbest: The Three Rounds of the Trump Tariff Wars

Dr. Dan Steinbock 

In just days, President Trump has caused a meltdown in world markets and undermined global recovery, as he did in 2017. But now his economic weapons are far more destructive, as evidenced by the three rounds of the tariff wars.

The first round of Trump tariffs, which still built on traditional trade wars, involved mainly Canada, Mexico and China. The second round began with “reciprocal tariffs”, which are unilateral, flawed as stated and wrongly calculated. This round covers most trading economies worldwide. But the trade wars will drastically escalate by Trump’s threat of additional 50% tariff against China.

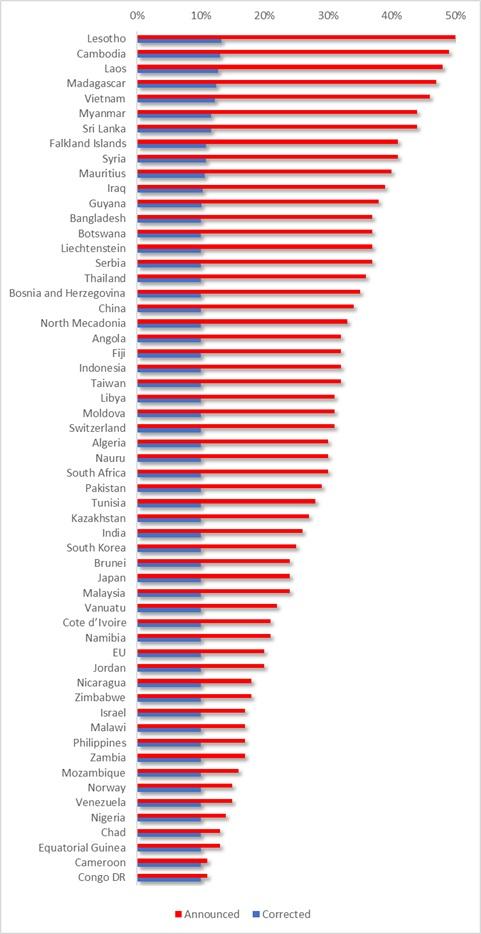
If the first round was dumb, the second was dumber, and the third is most certainly the dumbest. The first round was dumb because it was unwarranted and driven by geopolitics, not economics. The second round was dumber because it was based on flawed formula which has no basis in either economic theory or trade law. Worse, thanks to erroneous calculation, it over-inflated the tariff impact by up to a factor of four, as demonstrated by the American Enterprise Institute (AEI).

Even if the Trump “reciprocal tariffs” were to be taken seriously, which would be a cardinal mistake, the tariff against Vietnam should be 12%, not 46%; against China, 10% not 34%; against the EU, 10% not 20%, and so on (see Figure).


Figure: President Trump’s “Reciprocal Tariffs”: Actual and Corrected

Source: AEI; author


The third round is the dumbest because it builds on unwarranted tariffs, flawed reciprocal tariffs calculated erroneously and, finally, still new tariffs that have more in common with economic blackmail than international cooperation.

President Trump mistakes “medicine” with poison and “negotiations” with paying tribute.

The pre-104% tariff impact on China

What is the impact on China of the accumulative tariffs regarding China (now tariffs above 60%) and the elimination of duty-free for de minimis?

The direct impact of the current US tariffs could shave off up to 1.0% to 1.2% from China’s GDP. This is at par or 20% higher than the initially expected impact. However, it is not the actual impact of the US tariffs.

During Trump’s first term, the tariff war targeted primarily China and a few other trading economies. Now it targets most if not all non-US economies. To a degree, this will reduce the adverse impact on China. Moreover, China is prepared to cushion the US tariff impact in part by fiscal stimulus, monetary easing and structural reforms.

For all practical purposes, the US administration’s decision to eliminate duty-free de minimis treatment for low-value imports seeks to undermine Chinese global low value e-commerce platforms. Yet, these players, including Shein and Temu, are already working with more US sellers and opening warehouses in America.

But the move will prove costly to those Americans who are most reliant on affordable prices. It will hit the hardest American small businesses, the shrinking US and lower-middle-class and particularly working Americans and the laboring poor.

Toward a “global economic pandemic”

How would you evaluate the Chinese retaliation decisions?

Last week, the Trump administration imposed a 34% tariff on Chinese goods, following the 20% rate imposed earlier in the year. Two days later, China imposed a 34% tariff on all U.S. imports. It is a part of China’s full retaliatory package, which includes a 15% tariff on certain US agricultural commodities and 10% on others in March. Additionally, China added 16 US entities to its export control list and another 11 firms into its unreliable entity list, plus import restrictions on rare-earth products.

Relative to the Trump administration’s overblown “reciprocal tariff” measures, China’s responses have been measured, coordinated and broad. The Trump administration has now opened the Pandora’s Box of wholesale decoupling of the world’s two largest economies. That will penalize US consumer, business and investor confidence more than initially anticipated. In the process, the probability of an impending US contraction is likely to increase substantially.

If President Trump will carry out his threat to raise the tariff on Chinese goods by an additional 50%, global economic prospects may face a new kind of global pandemic.

Death of outsourcing?

What about the extreme tariffs regarding Vietnam, Laos, Malaysia and Cambodia. Is this the end of the outsourcing model?

With the Trump administration’s uncertainty and weaponization of tariffs, it is premature to presume any final trajectories. The Trump administration is targeting Cambodia with 49%, Laos with 48%, Vietnam with 46% and Malaysia with 24% tariffs. Calculated right, these tariffs should be 13% to Cambodia, 13% to Laos, 12% to Vietnam and 10% to Malaysia. But Trump tariffs are devoid of economic rationality.

India was taken back by the US’s 26% reciprocal tariff, which exceeds the current tariff gap by more than 2.5 times. But Indian policymakers seek to avoid retaliation, hoping first to gain a bilateral trade agreement with the US and then lower the effective tariff rate.

The message is loud and clear: Those countries that are most exposed to the United States are now the most vulnerable to inflated, illicit and erratic trade measures.

The dissipation of almost $7 trillion in the US markets in just two days is a prelude to more extensive market losses and volatility. Such losses will translate to a broad and deeply adverse impact on the real economy.

How will Southeast Asia respond?

Why aren’t Southeast Asian states retaliating? 

The simple answer: By staying united. On Monday, Malaysian Prime Minister Anwar Ibrahim called for Southeast Asian countries to “stand firm together” after they were among the hardest hit by US tariffs. These words matter since Malaysia is this year’s rotating chair of the 10-member Association of Southeast Asian Nations (ASEAN). As Anwar put it, “We must stand firm together as ASEAN, with a population of 640 million and an economic strength that is among the top in the world.”

But Southeast Asia is very diverse. Exporters like Vietnam, Cambodia and Laos, even Thailand and Malaysia are taking disproportionate hits. More insular, large commodity producers like Indonesia are no longer immune. Advanced tiny states such as Singapore seek to hedge bets with cautious balancing. In the Philippines, the pro-US Marcos Jr dreams of trade exemptions, in exchange for geopolitical concessions.

For now, ASEAN nations are trying to avoid tit-a-tat tariffs against the US. But if US tariffs prevail and escalate, this stance will be harder to retain. Worldwide, US trade wars will reinforce regionalization; no longer globalization.

Would East Asian MNCs opt for “Americanization”?

Do you think the big Japanese, Taiwanese and South Korean multinationals will delocalize for US soil?

A full-scale “Americanization” of East Asian multinationals (MNCs) would make these companies even more exposed to future US tariff and non-tariff measures, which is very much not in the interest of these companies and the sovereign countries in which they are headquartered.

As the Taiwanese semiconductor giants have seen in the past few years, full localization in the US could undermine their technological competitiveness – which is precisely why President Trump and his trade authorities seek to localize those MNCs in America.

These East Asian MNCs are all US’s major non-NATO allies. So, when the Trump administration imposed 32% tariffs on Taiwan, 25% on South Korea and 24% on Japan, it came as a major surprise to each. And the timing is challenging. In Taiwan, domestic divides are on the rise. South Korea is heading to election amid a lingering constitutional crisis. Japan is struggling to keep its economic focus.

In the past, US military allies were seen as preferred trade partners and vice versa. That era is now gone. The ongoing trade wars are multidimensional. But so will be the responses.

Toward global contraction?

How do you see the next chapter of ongoing trade war between Trump and his adversaries? 

If President Trump will carry out his threat to raise the tariff on Chinese goods by an additional 50%, China will retaliate accordingly.

The Trump administration is not imposing tariffs. It seeks to charge economic rents it is not entitled to.

From the Chinese perspective, the Trump tariffs have little or nothing to do with economics, which most international economists would agree with. They regard those tariffs as blackmail and bullying, at the expense of the Global South.

Left unchallenged, the Trump tariffs will leave global economic integration unraveling.

About the Author:

Dr. Dan Steinbock is an internationally recognized strategist of the multipolar world and the founder of Difference Group. He has served at the India, China and America Institute (US), Shanghai Institutes for International Studies (China) and the EU Center (Singapore). For more, see https://www.differencegroup.net 

Currency Speculators dropped their Bullish Bets before last week’s turmoil

By InvestMacro

Here are the latest charts and statistics for the Commitment of Traders (COT) data published by the Commodities Futures Trading Commission (CFTC).

The latest COT data is updated through Tuesday April 1st and shows a quick view of how large market participants (for-profit speculators and commercial traders) were positioned in the futures markets. All currency positions are in direct relation to the US dollar where, for example, a bet for the euro is a bet that the euro will rise versus the dollar while a bet against the euro will be a bet that the euro will decline versus the dollar.

Weekly Speculator Changes led by Australian Dollar

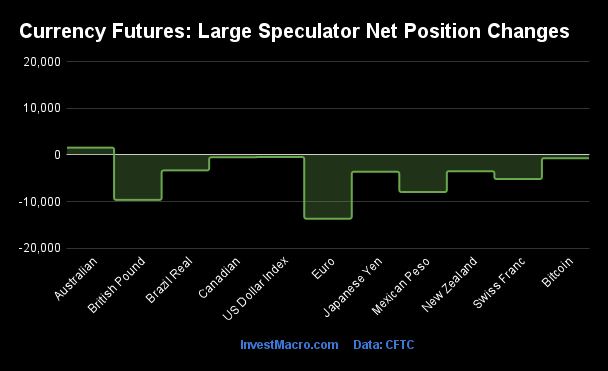
The COT currency market speculator bets were decisively lower this week (through Tuesday) as just one out of the eleven currency markets we cover had higher positioning while the other ten markets had lower speculator contracts.

Leading the gains for the currency markets was the Australian Dollar with a small gain of 1,583 contracts for the week.

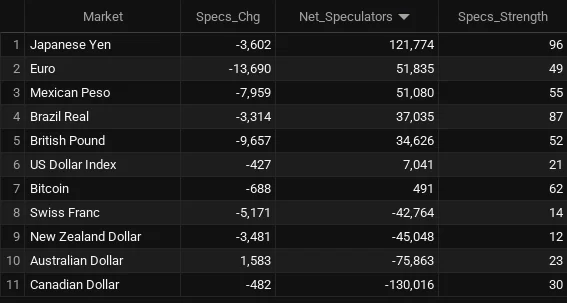
The currencies seeing declines in speculator bets on the week were the EuroFX (-13,690 contracts), the British Pound (-9,657 contracts), the Mexican Peso (-7,959 contracts), the Swiss Franc (-5,171 contracts), the Japanese Yen (-3,602 contracts), the New Zealand Dollar (-3,481 contracts), the Brazilian Real (-3,314 contracts), Bitcoin (-688 contracts), the Canadian Dollar (-482 contracts) and with the US Dollar Index (-427 contracts) also registering lower bets on the week.

FX Roundup: Currency Speculators dropped their Bullish Bets before last week’s turmoil

Highlighting the COT currency’s data for last week was that the currency bets were overall down before last week’s late-week turmoil on the US tariffs announcement. The COT data is updated each week through Tuesday (released on Friday), so we only get a glimpse to what the speculators & commercials did before the Thursday & Friday selloffs.

The specs reduced their bullish bets across the board last week except for a small uptick in bets for the Australian dollar. The largest decreases were for the Euro, British Pound and the Mexican Peso — which were three currency positions that had been seeing recent speculator sentiment gains and had overall bullish net positioning. The Swiss Franc, the Yen, the NZD and the Brazilian Real saw more modest declines. The Australian Dollar saw a small rise but the overall AUD speculator position remains very bearish at a -76,863 net contract standing at the moment. It is hard to read into any of these moves because they could be and likely to be dwarfed by this coming week’s data and positioning changes.

The price action from last week was obviously dominated by the last two days which saw a giant whipsaw take place from Thursday to Friday. Thursday’s price action had strong bullish jumps for all the major currencies, except for the US Dollar Index, which took a huge hit by over -1.50 percent. The Yen, the Swiss Franc and the Mexican Peso led the way on Thursday with increases by over +2.0 percent each while the other majors saw gains in the neighborhood of +1.0 percent.

Friday, however, was a different story and everything pretty much reversed itself. The US Dollar Index led the way on Friday with a jump by approximately +1.0 percent. The next strongest currency turned out to be the safe haven Swiss Franc — which only fell by about -0.08 percent. The other (normally) safe haven Japanese Yen dipped by -0.32 percent and the Euro fell by -0.84 percent. After that, there was a sea of red with prices dropping for the other major much more sharply — the Aussie experienced a giant drop by -5 percent, the NZD by -3.85 percent, the Real by -3.78 percent and the Peso by -2.80 percent. The Canadian Dollar and British Pound saw declines each by over 1.00 percent.

Next week, to say the least, will be an interesting one after the market digests the recent news, retrenches and re-positions itself going forward. There is considerable risk the trends continue lower like Friday but there is a possibility that like the initial shock of Covid, some markets take a plunge and then turnaround again. Stay alert.


Currencies Net Speculators Leaderboard

Legend: Weekly Speculators Change | Speculators Current Net Position | Speculators Strength Score compared to last 3-Years (0-100 range)


Strength Scores led by Japanese Yen & Brazilian Real

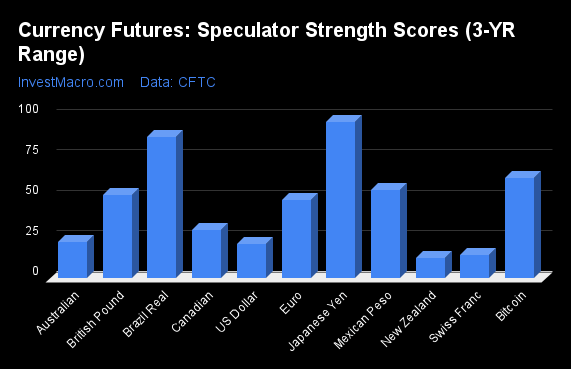
COT Strength Scores (a normalized measure of Speculator positions over a 3-Year range, from 0 to 100 where above 80 is Extreme-Bullish and below 20 is Extreme-Bearish) showed that the Japanese Yen (96 percent) and the Brazilian Real (87 percent) lead the currency markets this week. Bitcoin (62 percent), Mexican Peso (55 percent) and the British Pound (52 percent) come in as the next highest in the weekly strength scores.

On the downside, the New Zealand Dollar (12 percent) and the Swiss Franc (14 percent) come in at the lowest strength levels currently and are in Extreme-Bearish territory (below 20 percent). The next lowest strength scores were the US Dollar Index (21 percent) and the Australian Dollar (22 percent).

3-Year Strength Statistics:
US Dollar Index (21.3 percent) vs US Dollar Index previous week (22.2 percent)
EuroFX (48.5 percent) vs EuroFX previous week (53.7 percent)
British Pound Sterling (51.7 percent) vs British Pound Sterling previous week (56.0 percent)
Japanese Yen (96.2 percent) vs Japanese Yen previous week (97.3 percent)
Swiss Franc (14.2 percent) vs Swiss Franc previous week (24.7 percent)
Canadian Dollar (29.7 percent) vs Canadian Dollar previous week (29.9 percent)
Australian Dollar (22.5 percent) vs Australian Dollar previous week (21.3 percent)
New Zealand Dollar (12.4 percent) vs New Zealand Dollar previous week (16.4 percent)
Mexican Peso (54.8 percent) vs Mexican Peso previous week (58.9 percent)
Brazilian Real (87.4 percent) vs Brazilian Real previous week (90.6 percent)
Bitcoin (62.0 percent) vs Bitcoin previous week (77.0 percent)


EuroFX & Brazilian Real top the 6-Week Strength Trends

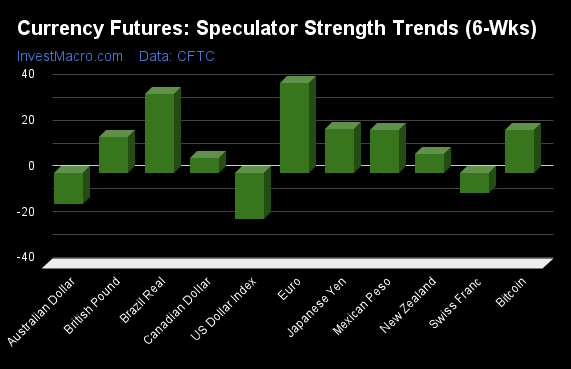
COT Strength Score Trends (or move index, calculates the 6-week changes in strength scores) showed that the EuroFX (39 percent) and the Brazilian Real (34 percent) lead the past six weeks trends for the currencies. The Japanese Yen (19 percent), the Mexican Peso (19 percent) and Bitcoin (19 percent) are the next highest positive movers in the 3-Year trends data.

The US Dollar Index (-20 percent) leads the downside trend scores currently with the Australian Dollar (-14 percent) and the Swiss Franc (-9 percent) following next with lower trend scores.

3-Year Strength Trends:
US Dollar Index (-20.2 percent) vs US Dollar Index previous week (-16.2 percent)
EuroFX (39.3 percent) vs EuroFX previous week (49.5 percent)
British Pound Sterling (15.8 percent) vs British Pound Sterling previous week (21.3 percent)
Japanese Yen (19.2 percent) vs Japanese Yen previous week (22.2 percent)
Swiss Franc (-8.9 percent) vs Swiss Franc previous week (2.3 percent)
Canadian Dollar (6.6 percent) vs Canadian Dollar previous week (9.5 percent)
Australian Dollar (-13.6 percent) vs Australian Dollar previous week (-8.4 percent)
New Zealand Dollar (8.2 percent) vs New Zealand Dollar previous week (9.0 percent)
Mexican Peso (18.6 percent) vs Mexican Peso previous week (22.0 percent)
Brazilian Real (34.3 percent) vs Brazilian Real previous week (37.4 percent)
Bitcoin (18.7 percent) vs Bitcoin previous week (33.7 percent)


Individual COT Forex Markets:

US Dollar Index Futures:

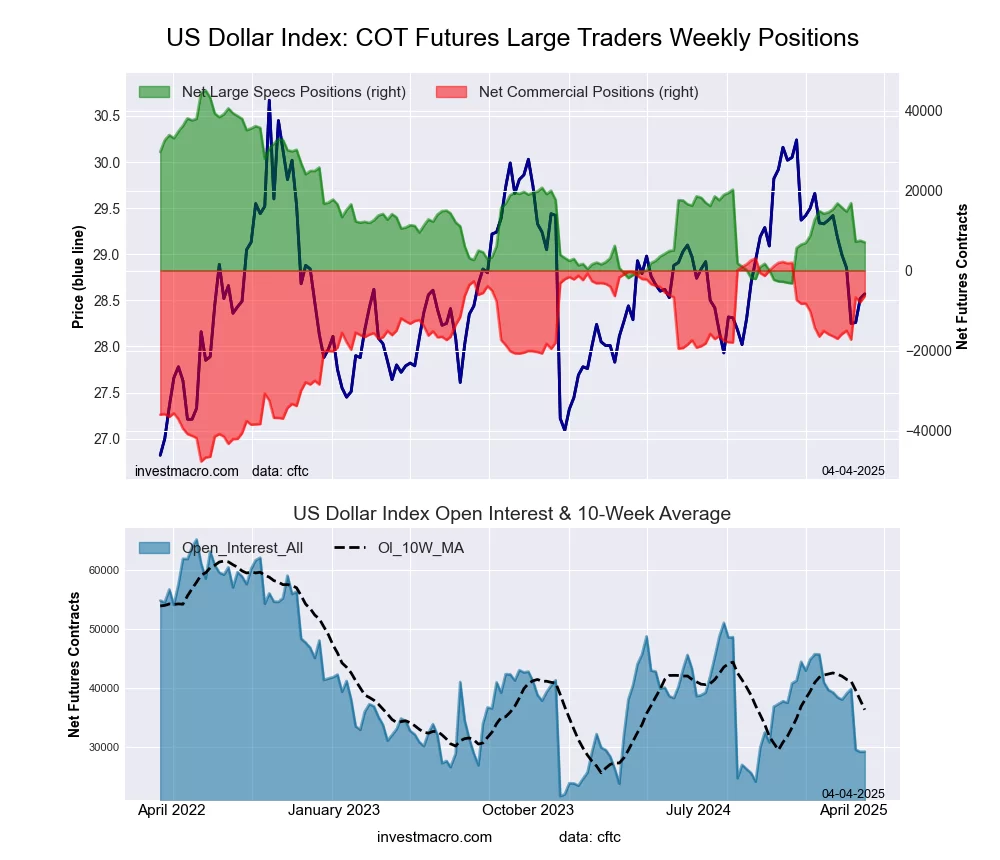
US Dollar Index Forex Futures COT ChartThe US Dollar Index large speculator standing this week equaled a net position of 7,041 contracts in the data reported through Tuesday. This was a weekly decrease of -427 contracts from the previous week which had a total of 7,468 net contracts.

This week’s current strength score (the trader positioning range over the past three years, measured from 0 to 100) shows the speculators are currently Bearish with a score of 21.3 percent. The commercials are Bullish-Extreme with a score of 81.5 percent and the small traders (not shown in chart) are Bearish-Extreme with a score of 18.4 percent.

Price Trend-Following Model: Strong Downtrend

Our weekly trend-following model classifies the current market price position as: Strong Downtrend.

US DOLLAR INDEX StatisticsSPECULATORSCOMMERCIALSSMALL TRADERS
– Percent of Open Interest Longs:80.74.67.4
– Percent of Open Interest Shorts:56.726.49.6
– Net Position:7,041-6,397-644
– Gross Longs:23,6401,3402,164
– Gross Shorts:16,5997,7372,808
– Long to Short Ratio:1.4 to 10.2 to 10.8 to 1
NET POSITION TREND:
– Strength Index Score (3 Year Range Pct):21.381.518.4
– Strength Index Reading (3 Year Range):BearishBullish-ExtremeBearish-Extreme
NET POSITION MOVEMENT INDEX:
– 6-Week Change in Strength Index:-20.221.0-10.8


Euro Currency Futures:

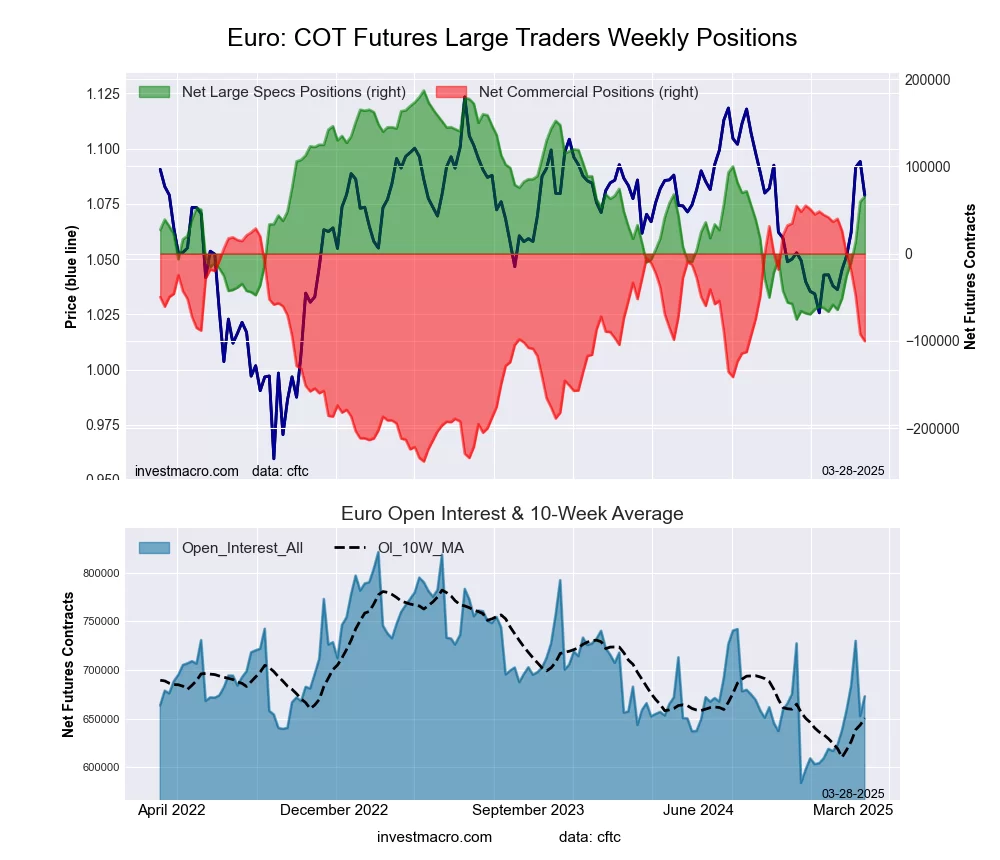
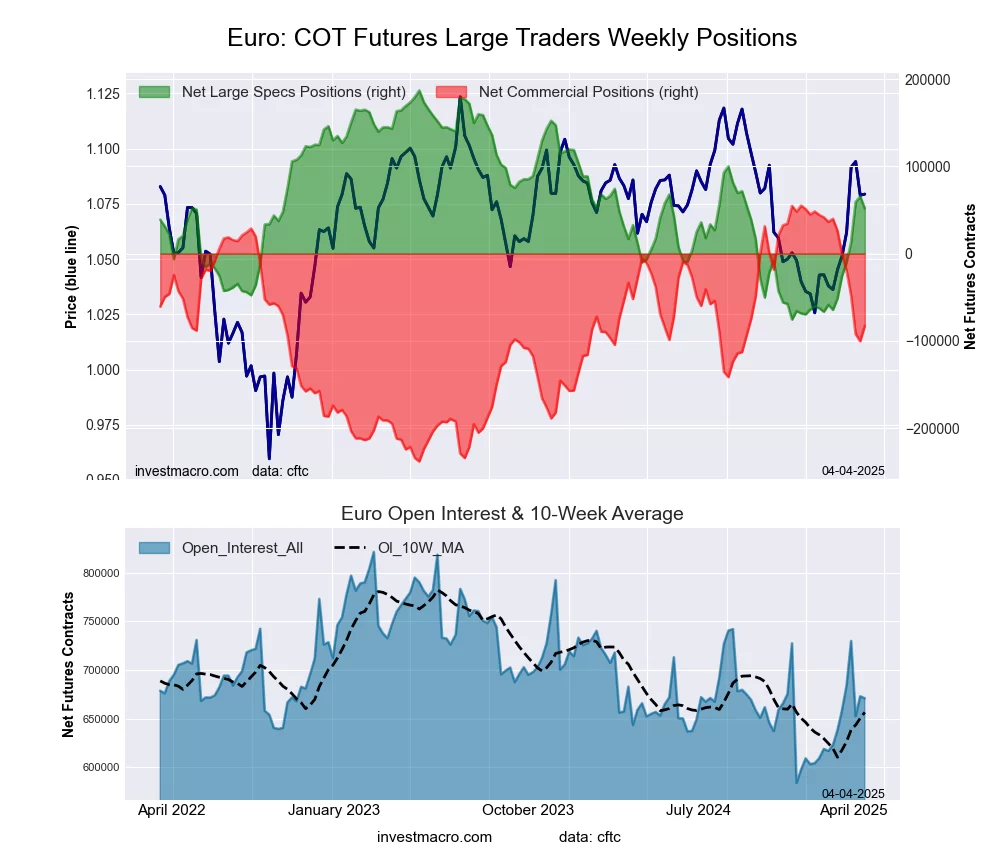
Euro Currency Futures COT ChartThe Euro Currency large speculator standing this week equaled a net position of 51,835 contracts in the data reported through Tuesday. This was a weekly fall of -13,690 contracts from the previous week which had a total of 65,525 net contracts.

This week’s current strength score (the trader positioning range over the past three years, measured from 0 to 100) shows the speculators are currently Bearish with a score of 48.5 percent. The commercials are Bullish with a score of 53.0 percent and the small traders (not shown in chart) are Bearish with a score of 42.2 percent.

Price Trend-Following Model: Strong Uptrend

Our weekly trend-following model classifies the current market price position as: Strong Uptrend.

EURO Currency StatisticsSPECULATORSCOMMERCIALSSMALL TRADERS
– Percent of Open Interest Longs:27.356.611.9
– Percent of Open Interest Shorts:19.668.97.3
– Net Position:51,835-82,87231,037
– Gross Longs:183,247379,41980,132
– Gross Shorts:131,412462,29149,095
– Long to Short Ratio:1.4 to 10.8 to 11.6 to 1
NET POSITION TREND:
– Strength Index Score (3 Year Range Pct):48.553.042.2
– Strength Index Reading (3 Year Range):BearishBullishBearish
NET POSITION MOVEMENT INDEX:
– 6-Week Change in Strength Index:39.3-37.212.9


British Pound Sterling Futures:

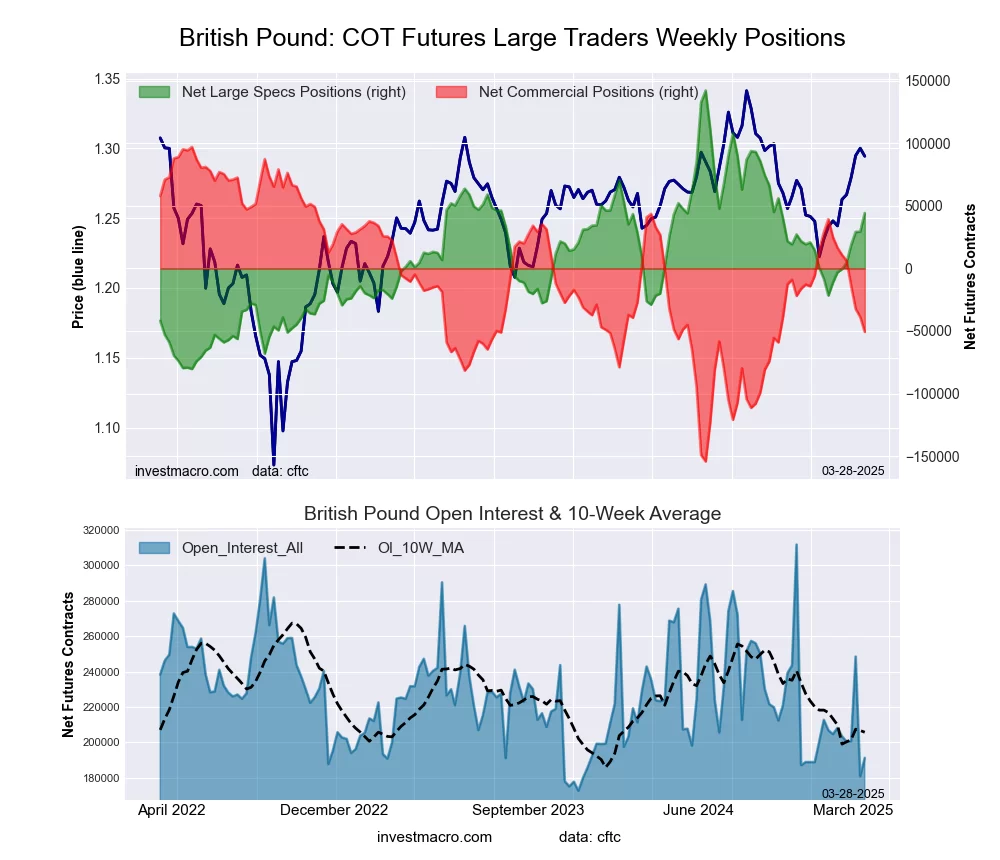
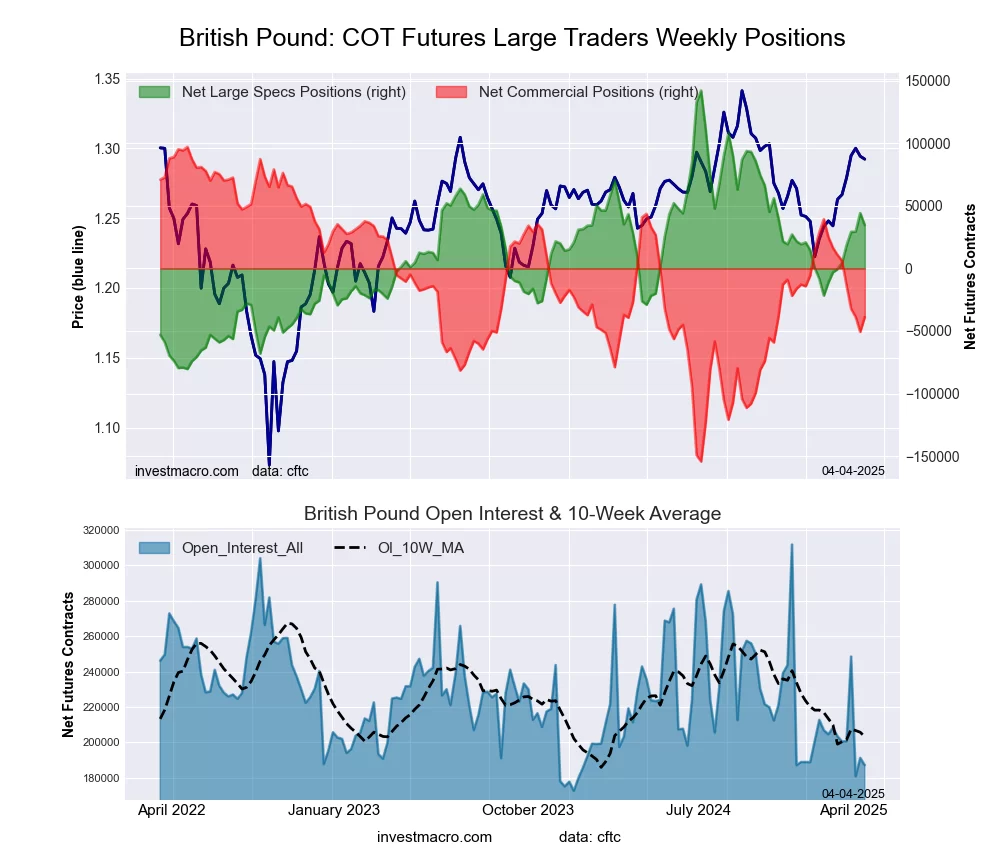
British Pound Sterling Futures COT ChartThe British Pound Sterling large speculator standing this week equaled a net position of 34,626 contracts in the data reported through Tuesday. This was a weekly fall of -9,657 contracts from the previous week which had a total of 44,283 net contracts.

This week’s current strength score (the trader positioning range over the past three years, measured from 0 to 100) shows the speculators are currently Bullish with a score of 51.7 percent. The commercials are Bearish with a score of 46.0 percent and the small traders (not shown in chart) are Bullish with a score of 70.9 percent.

Price Trend-Following Model: Strong Uptrend

Our weekly trend-following model classifies the current market price position as: Strong Uptrend.

BRITISH POUND StatisticsSPECULATORSCOMMERCIALSSMALL TRADERS
– Percent of Open Interest Longs:56.126.916.2
– Percent of Open Interest Shorts:37.647.613.9
– Net Position:34,626-38,7904,164
– Gross Longs:104,98650,32030,248
– Gross Shorts:70,36089,11026,084
– Long to Short Ratio:1.5 to 10.6 to 11.2 to 1
NET POSITION TREND:
– Strength Index Score (3 Year Range Pct):51.746.070.9
– Strength Index Reading (3 Year Range):BullishBearishBullish
NET POSITION MOVEMENT INDEX:
– 6-Week Change in Strength Index:15.8-19.730.2


Japanese Yen Futures:

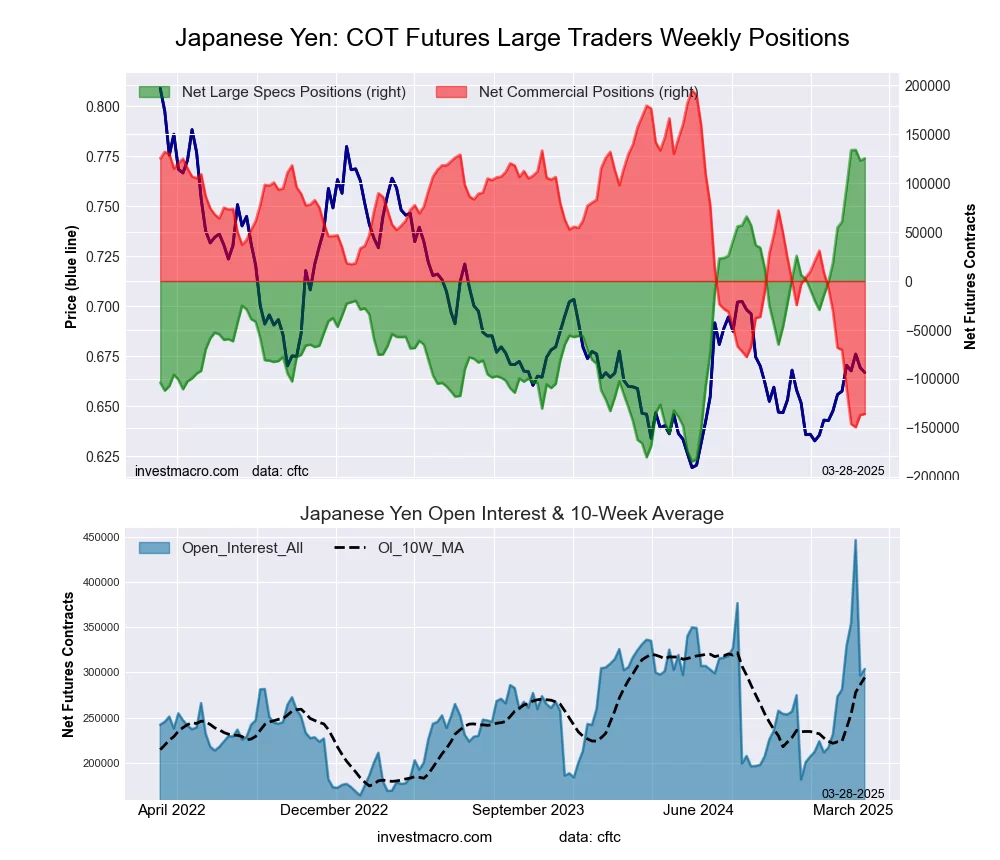
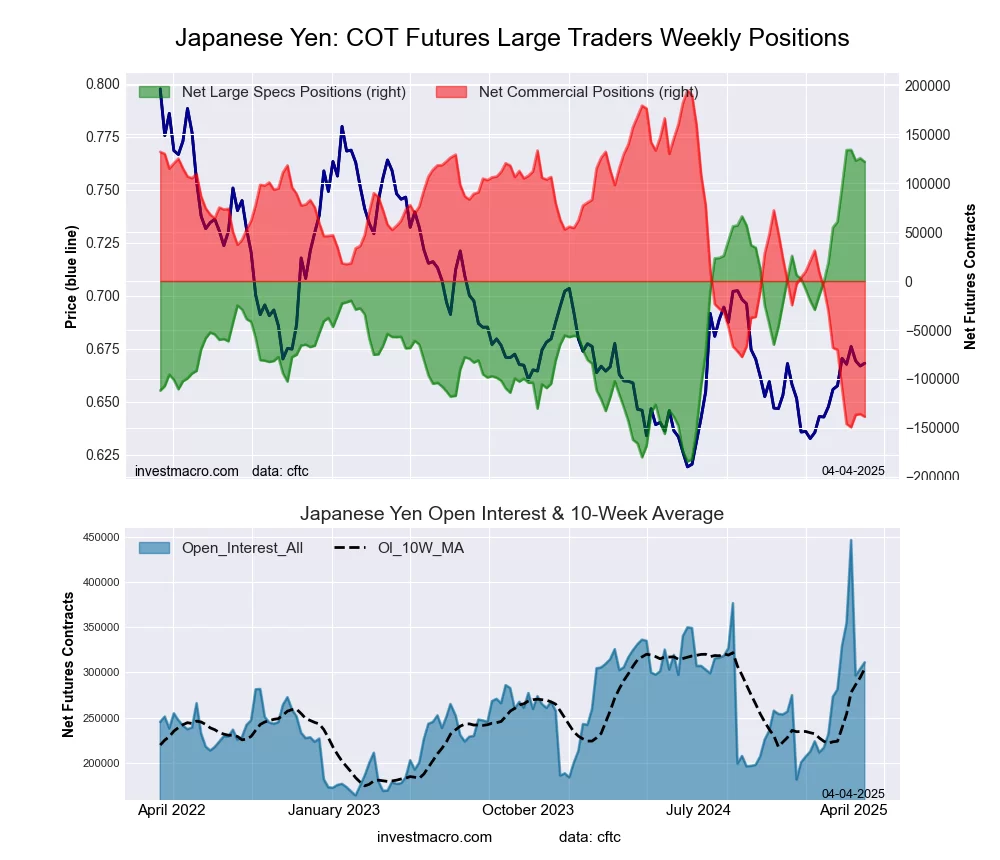
Japanese Yen Forex Futures COT ChartThe Japanese Yen large speculator standing this week equaled a net position of 121,774 contracts in the data reported through Tuesday. This was a weekly fall of -3,602 contracts from the previous week which had a total of 125,376 net contracts.

This week’s current strength score (the trader positioning range over the past three years, measured from 0 to 100) shows the speculators are currently Bullish-Extreme with a score of 96.2 percent. The commercials are Bearish-Extreme with a score of 3.1 percent and the small traders (not shown in chart) are Bullish-Extreme with a score of 100.0 percent.

Price Trend-Following Model: Strong Uptrend

Our weekly trend-following model classifies the current market price position as: Strong Uptrend.

JAPANESE YEN StatisticsSPECULATORSCOMMERCIALSSMALL TRADERS
– Percent of Open Interest Longs:51.931.215.5
– Percent of Open Interest Shorts:12.875.710.1
– Net Position:121,774-138,54716,773
– Gross Longs:161,56696,97148,102
– Gross Shorts:39,792235,51831,329
– Long to Short Ratio:4.1 to 10.4 to 11.5 to 1
NET POSITION TREND:
– Strength Index Score (3 Year Range Pct):96.23.1100.0
– Strength Index Reading (3 Year Range):Bullish-ExtremeBearish-ExtremeBullish-Extreme
NET POSITION MOVEMENT INDEX:
– 6-Week Change in Strength Index:19.2-19.918.1


Swiss Franc Futures:

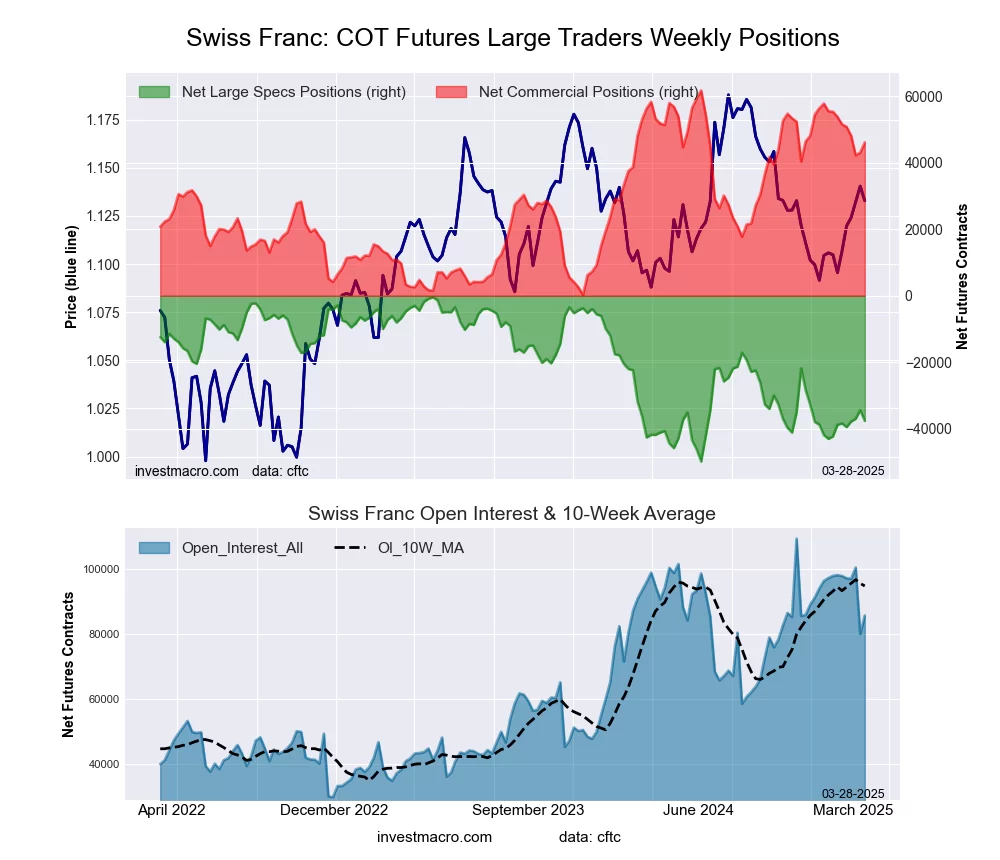
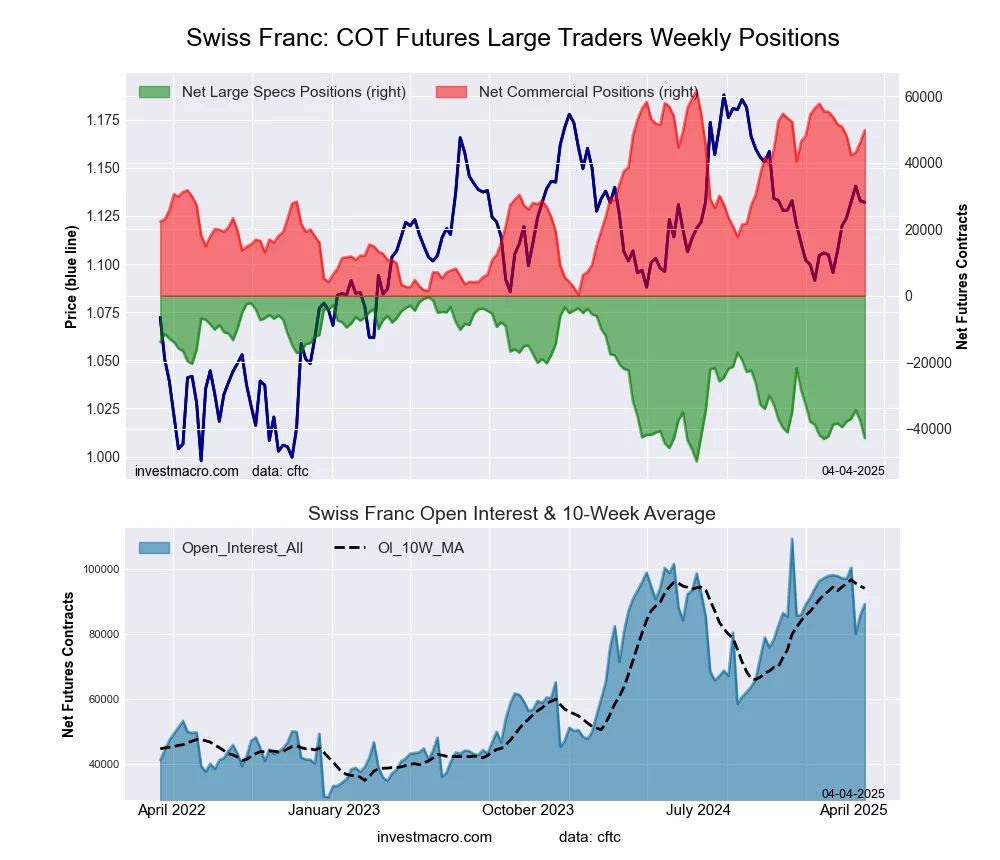
Swiss Franc Forex Futures COT ChartThe Swiss Franc large speculator standing this week equaled a net position of -42,764 contracts in the data reported through Tuesday. This was a weekly reduction of -5,171 contracts from the previous week which had a total of -37,593 net contracts.

This week’s current strength score (the trader positioning range over the past three years, measured from 0 to 100) shows the speculators are currently Bearish-Extreme with a score of 14.2 percent. The commercials are Bullish-Extreme with a score of 80.6 percent and the small traders (not shown in chart) are Bearish with a score of 49.1 percent.

Price Trend-Following Model: Strong Uptrend

Our weekly trend-following model classifies the current market price position as: Strong Uptrend.

SWISS FRANC StatisticsSPECULATORSCOMMERCIALSSMALL TRADERS
– Percent of Open Interest Longs:4.683.811.4
– Percent of Open Interest Shorts:52.628.019.3
– Net Position:-42,76449,769-7,005
– Gross Longs:4,14374,79710,177
– Gross Shorts:46,90725,02817,182
– Long to Short Ratio:0.1 to 13.0 to 10.6 to 1
NET POSITION TREND:
– Strength Index Score (3 Year Range Pct):14.280.649.1
– Strength Index Reading (3 Year Range):Bearish-ExtremeBullish-ExtremeBearish
NET POSITION MOVEMENT INDEX:
– 6-Week Change in Strength Index:-8.9-2.826.0


Canadian Dollar Futures:

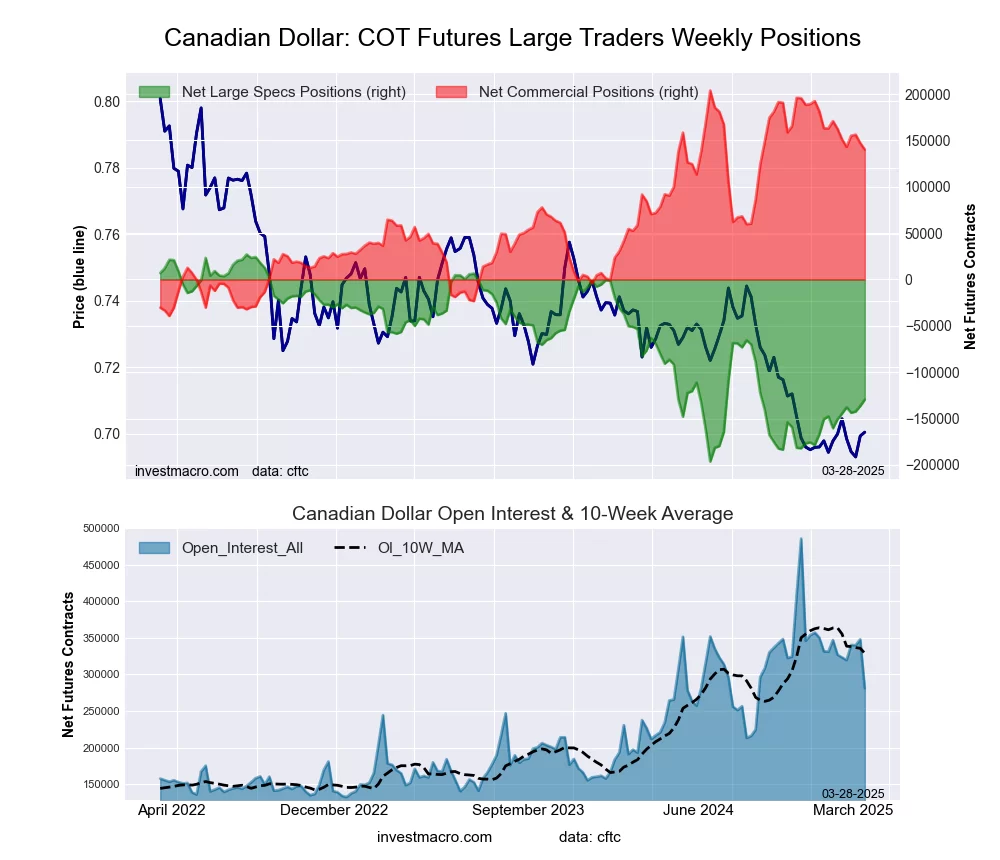
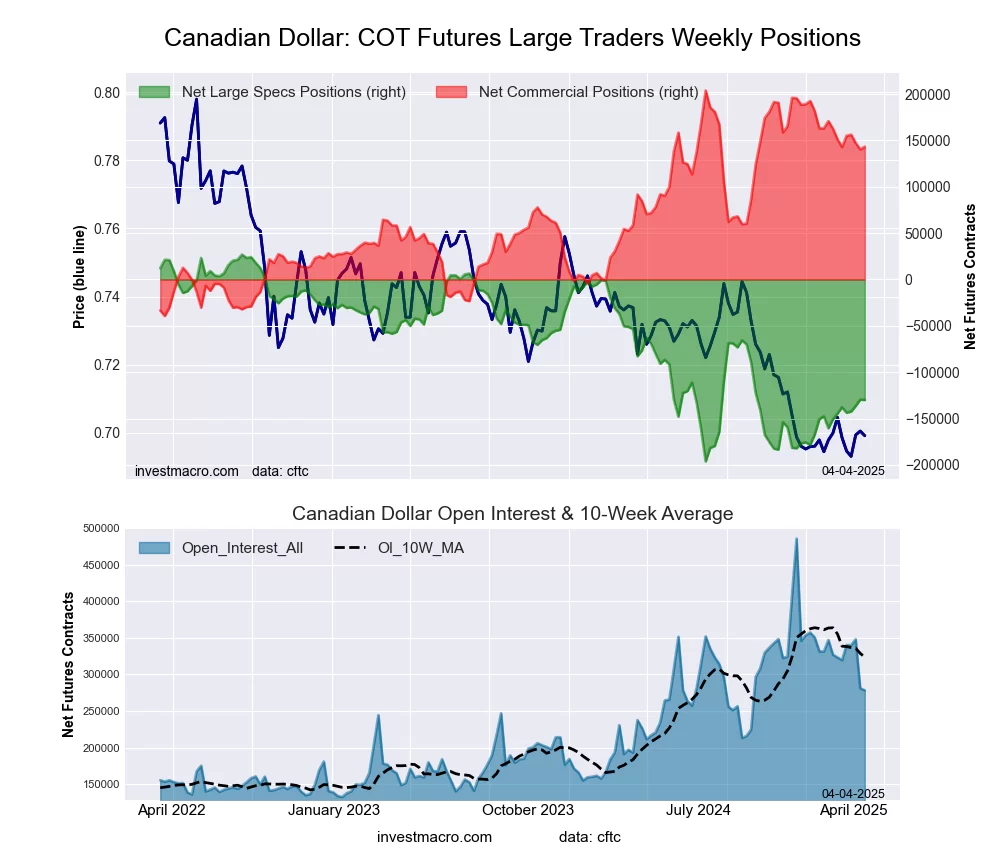
Canadian Dollar Forex Futures COT ChartThe Canadian Dollar large speculator standing this week equaled a net position of -130,016 contracts in the data reported through Tuesday. This was a weekly decline of -482 contracts from the previous week which had a total of -129,534 net contracts.

This week’s current strength score (the trader positioning range over the past three years, measured from 0 to 100) shows the speculators are currently Bearish with a score of 29.7 percent. The commercials are Bullish with a score of 75.1 percent and the small traders (not shown in chart) are Bearish-Extreme with a score of 5.6 percent.

Price Trend-Following Model: Weak Downtrend

Our weekly trend-following model classifies the current market price position as: Weak Downtrend.

CANADIAN DOLLAR StatisticsSPECULATORSCOMMERCIALSSMALL TRADERS
– Percent of Open Interest Longs:6.384.08.6
– Percent of Open Interest Shorts:53.032.513.4
– Net Position:-130,016143,318-13,302
– Gross Longs:17,606233,76023,892
– Gross Shorts:147,62290,44237,194
– Long to Short Ratio:0.1 to 12.6 to 10.6 to 1
NET POSITION TREND:
– Strength Index Score (3 Year Range Pct):29.775.15.6
– Strength Index Reading (3 Year Range):BearishBullishBearish-Extreme
NET POSITION MOVEMENT INDEX:
– 6-Week Change in Strength Index:6.6-3.2-18.4


Australian Dollar Futures:

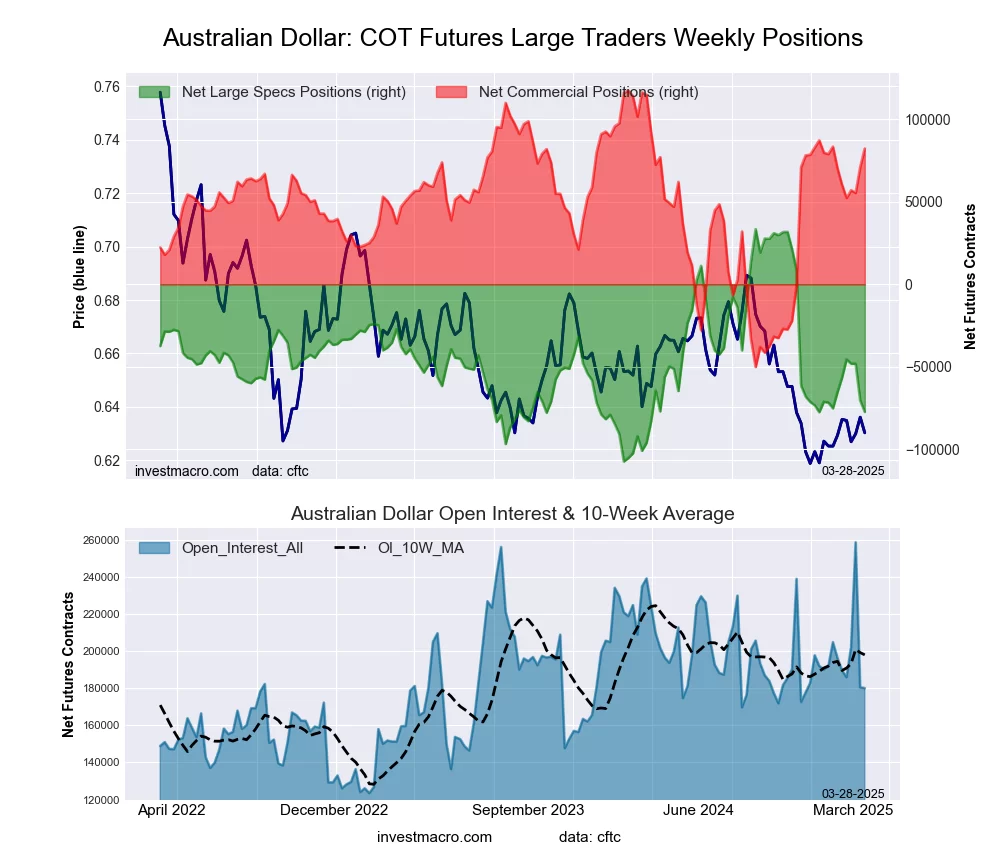
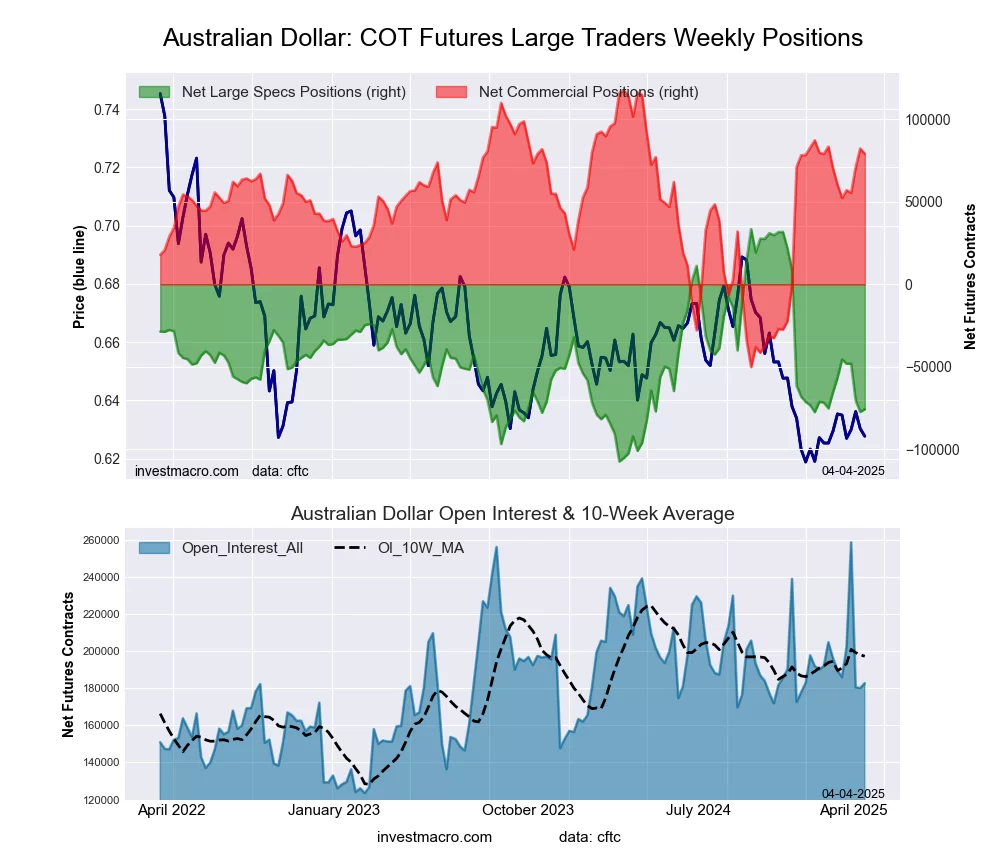
Australian Dollar Forex Futures COT ChartThe Australian Dollar large speculator standing this week equaled a net position of -75,863 contracts in the data reported through Tuesday. This was a weekly lift of 1,583 contracts from the previous week which had a total of -77,446 net contracts.

This week’s current strength score (the trader positioning range over the past three years, measured from 0 to 100) shows the speculators are currently Bearish with a score of 22.5 percent. The commercials are Bullish with a score of 77.1 percent and the small traders (not shown in chart) are Bearish with a score of 40.4 percent.

Price Trend-Following Model: Strong Downtrend

Our weekly trend-following model classifies the current market price position as: Strong Downtrend.

AUSTRALIAN DOLLAR StatisticsSPECULATORSCOMMERCIALSSMALL TRADERS
– Percent of Open Interest Longs:14.365.313.5
– Percent of Open Interest Shorts:55.822.015.3
– Net Position:-75,86379,152-3,289
– Gross Longs:26,211119,37324,740
– Gross Shorts:102,07440,22128,029
– Long to Short Ratio:0.3 to 13.0 to 10.9 to 1
NET POSITION TREND:
– Strength Index Score (3 Year Range Pct):22.577.140.4
– Strength Index Reading (3 Year Range):BearishBullishBearish
NET POSITION MOVEMENT INDEX:
– 6-Week Change in Strength Index:-13.611.20.9


New Zealand Dollar Futures:

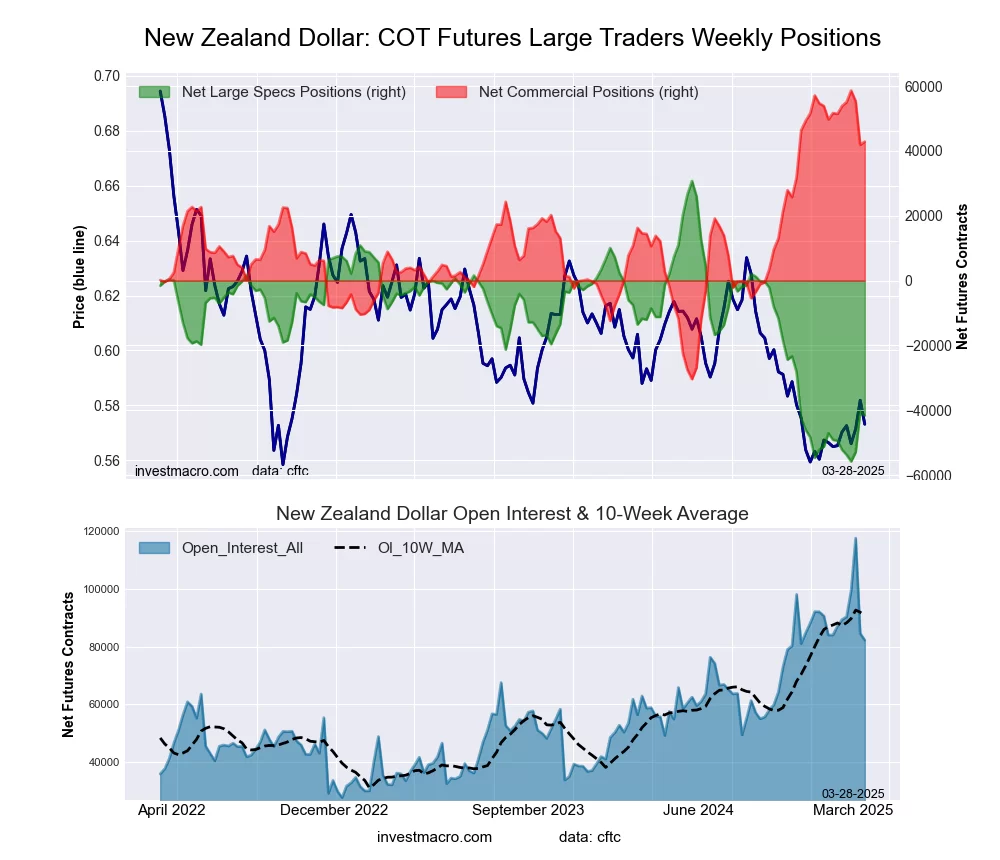
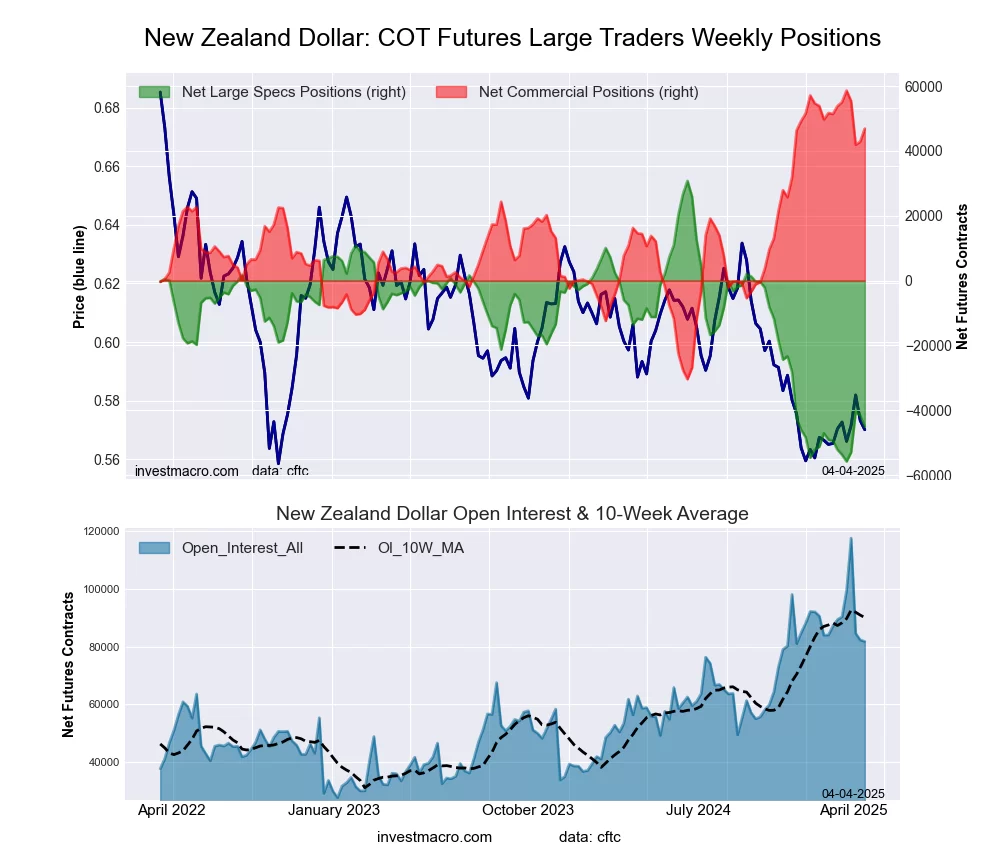
New Zealand Dollar Forex Futures COT ChartThe New Zealand Dollar large speculator standing this week equaled a net position of -45,048 contracts in the data reported through Tuesday. This was a weekly lowering of -3,481 contracts from the previous week which had a total of -41,567 net contracts.

This week’s current strength score (the trader positioning range over the past three years, measured from 0 to 100) shows the speculators are currently Bearish-Extreme with a score of 12.4 percent. The commercials are Bullish-Extreme with a score of 86.8 percent and the small traders (not shown in chart) are Bearish with a score of 30.0 percent.

Price Trend-Following Model: Strong Downtrend

Our weekly trend-following model classifies the current market price position as: Strong Downtrend.

NEW ZEALAND DOLLAR StatisticsSPECULATORSCOMMERCIALSSMALL TRADERS
– Percent of Open Interest Longs:13.681.84.4
– Percent of Open Interest Shorts:68.724.46.7
– Net Position:-45,04846,893-1,845
– Gross Longs:11,16466,8923,613
– Gross Shorts:56,21219,9995,458
– Long to Short Ratio:0.2 to 13.3 to 10.7 to 1
NET POSITION TREND:
– Strength Index Score (3 Year Range Pct):12.486.830.0
– Strength Index Reading (3 Year Range):Bearish-ExtremeBullish-ExtremeBearish
NET POSITION MOVEMENT INDEX:
– 6-Week Change in Strength Index:8.2-7.8-2.2


Mexican Peso Futures:

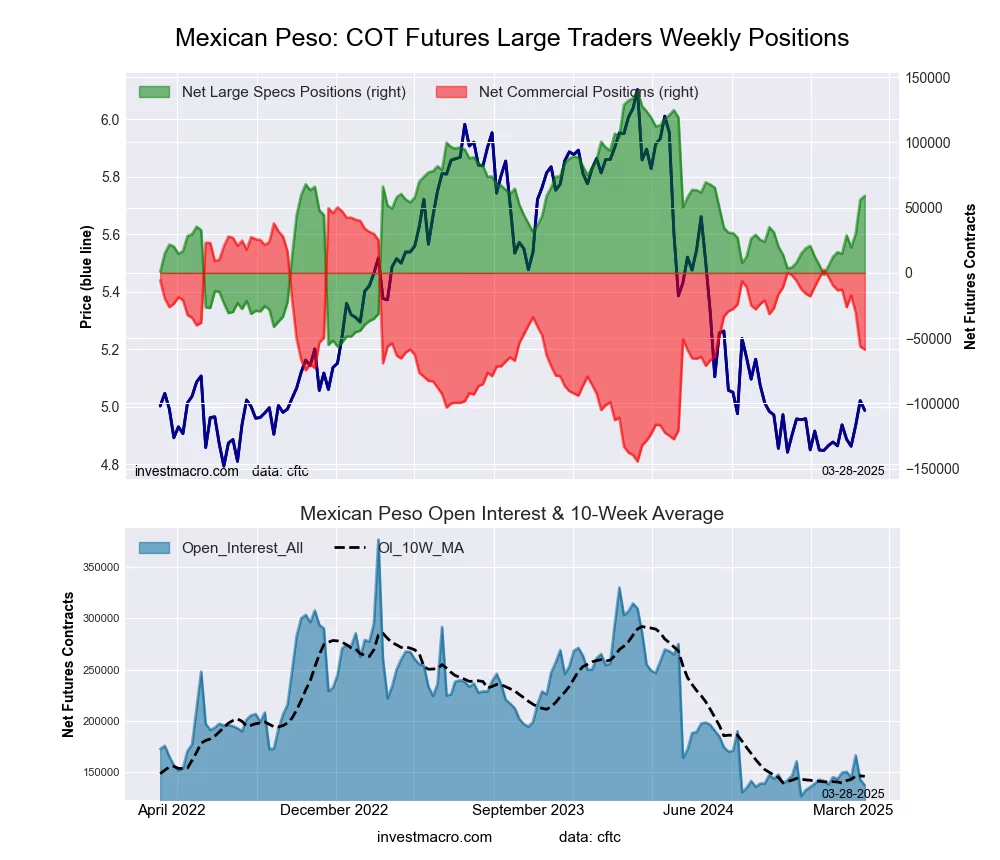
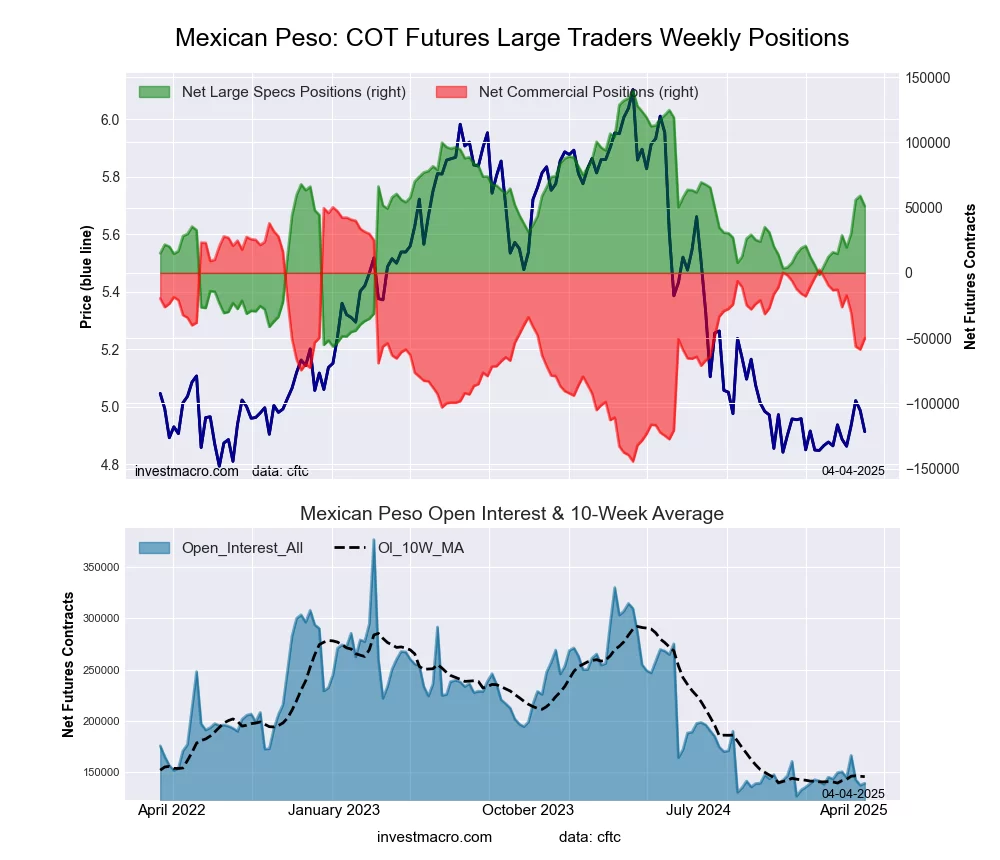
Mexican Peso Futures COT ChartThe Mexican Peso large speculator standing this week equaled a net position of 51,080 contracts in the data reported through Tuesday. This was a weekly lowering of -7,959 contracts from the previous week which had a total of 59,039 net contracts.

This week’s current strength score (the trader positioning range over the past three years, measured from 0 to 100) shows the speculators are currently Bullish with a score of 54.8 percent. The commercials are Bearish with a score of 48.4 percent and the small traders (not shown in chart) are Bearish-Extreme with a score of 17.4 percent.

Price Trend-Following Model: Weak Uptrend

Our weekly trend-following model classifies the current market price position as: Weak Uptrend.

MEXICAN PESO StatisticsSPECULATORSCOMMERCIALSSMALL TRADERS
– Percent of Open Interest Longs:62.231.43.1
– Percent of Open Interest Shorts:25.667.43.8
– Net Position:51,080-50,125-955
– Gross Longs:86,75743,8224,295
– Gross Shorts:35,67793,9475,250
– Long to Short Ratio:2.4 to 10.5 to 10.8 to 1
NET POSITION TREND:
– Strength Index Score (3 Year Range Pct):54.848.417.4
– Strength Index Reading (3 Year Range):BullishBearishBearish-Extreme
NET POSITION MOVEMENT INDEX:
– 6-Week Change in Strength Index:18.6-19.25.0


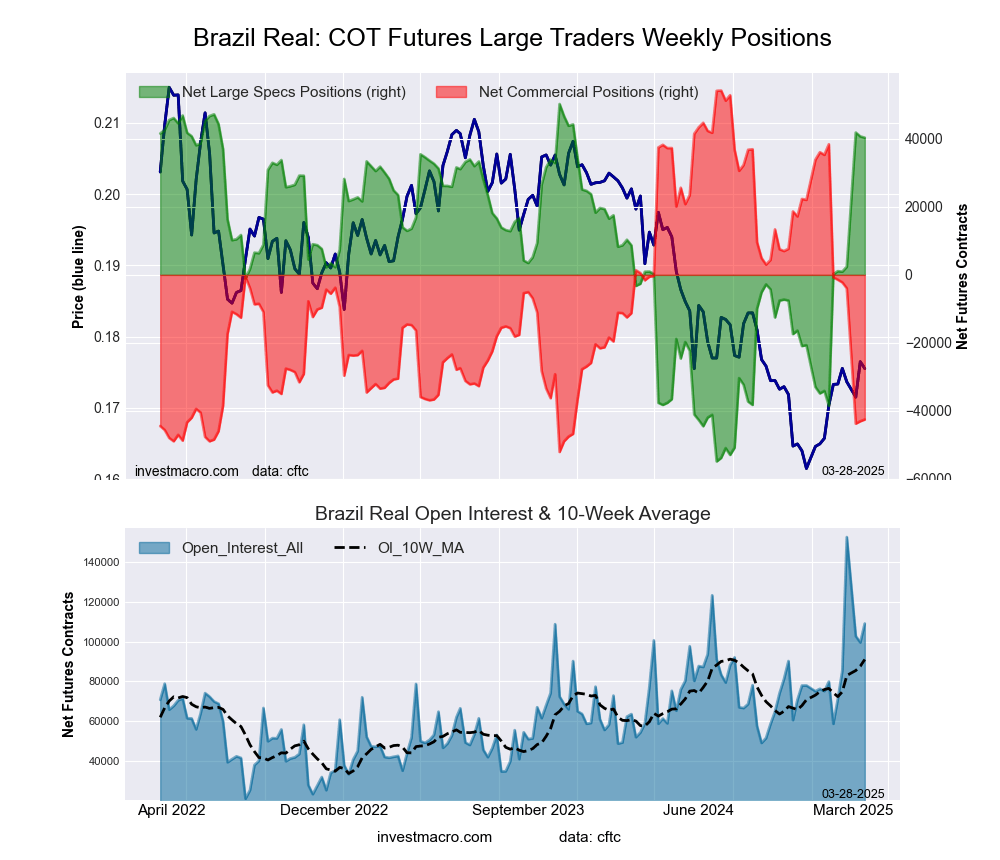
Brazilian Real Futures:

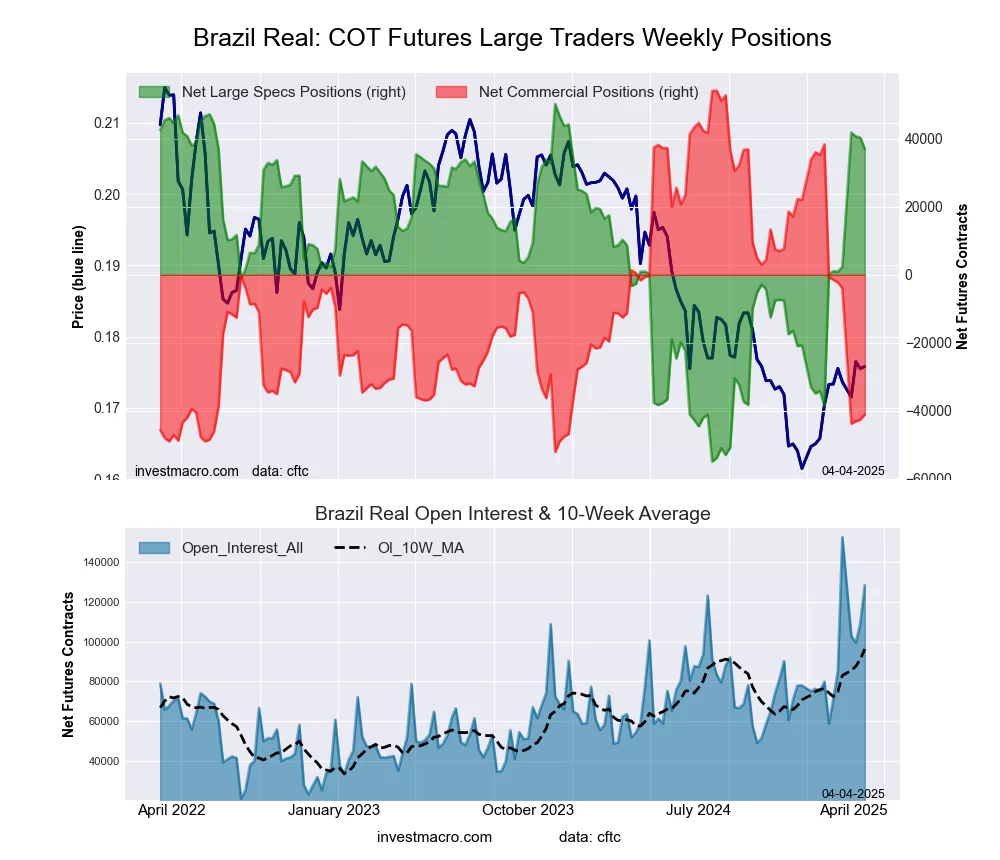
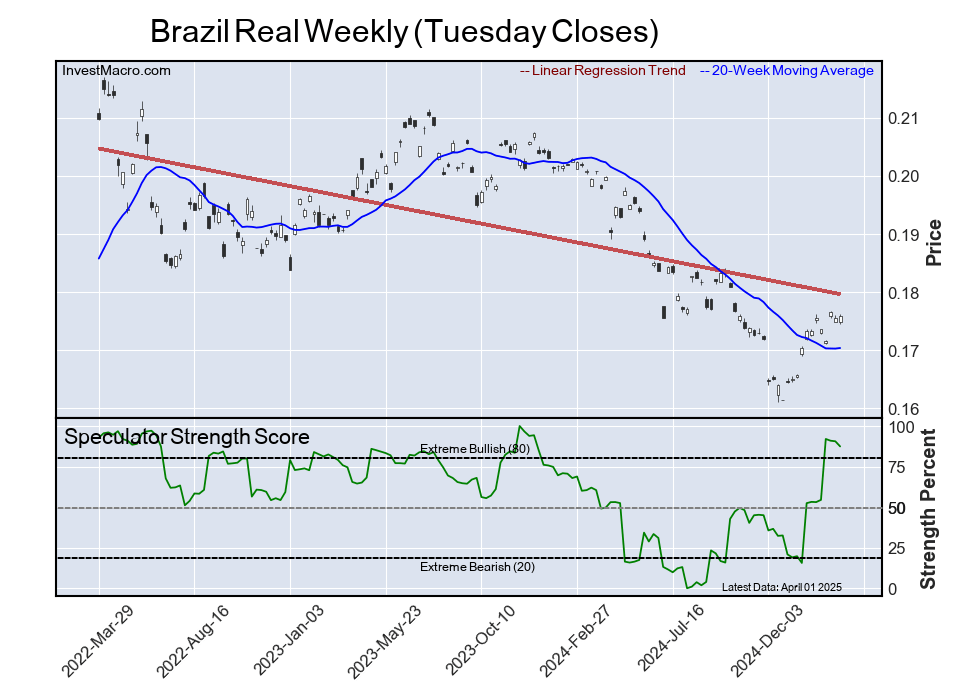
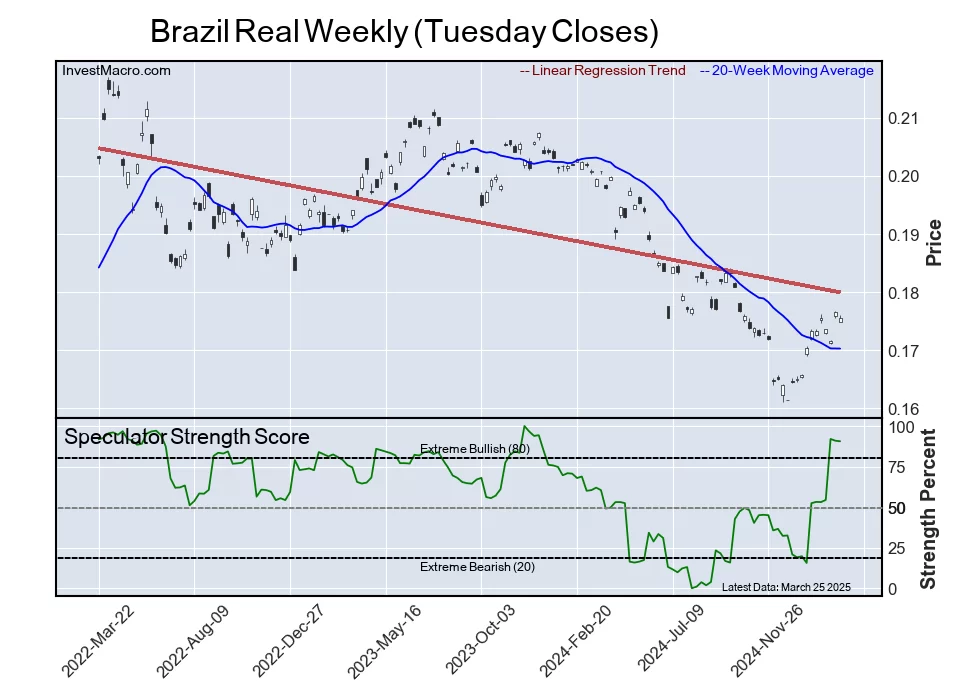
Brazil Real Futures COT ChartThe Brazilian Real large speculator standing this week equaled a net position of 37,035 contracts in the data reported through Tuesday. This was a weekly reduction of -3,314 contracts from the previous week which had a total of 40,349 net contracts.

This week’s current strength score (the trader positioning range over the past three years, measured from 0 to 100) shows the speculators are currently Bullish-Extreme with a score of 87.4 percent. The commercials are Bearish-Extreme with a score of 10.4 percent and the small traders (not shown in chart) are Bearish with a score of 43.5 percent.

Price Trend-Following Model: Uptrend

Our weekly trend-following model classifies the current market price position as: Uptrend.

BRAZIL REAL StatisticsSPECULATORSCOMMERCIALSSMALL TRADERS
– Percent of Open Interest Longs:54.234.34.4
– Percent of Open Interest Shorts:25.466.31.2
– Net Position:37,035-41,0504,015
– Gross Longs:69,59044,0655,617
– Gross Shorts:32,55585,1151,602
– Long to Short Ratio:2.1 to 10.5 to 13.5 to 1
NET POSITION TREND:
– Strength Index Score (3 Year Range Pct):87.410.443.5
– Strength Index Reading (3 Year Range):Bullish-ExtremeBearish-ExtremeBearish
NET POSITION MOVEMENT INDEX:
– 6-Week Change in Strength Index:34.3-36.515.4


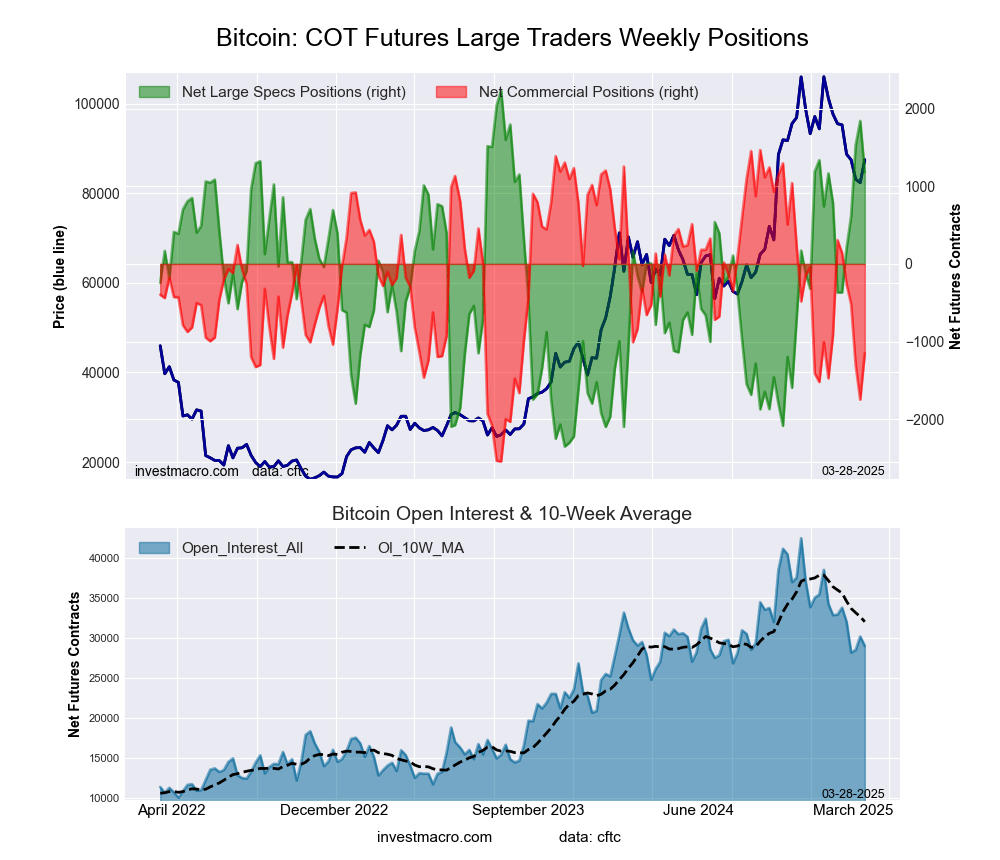
Bitcoin Futures:

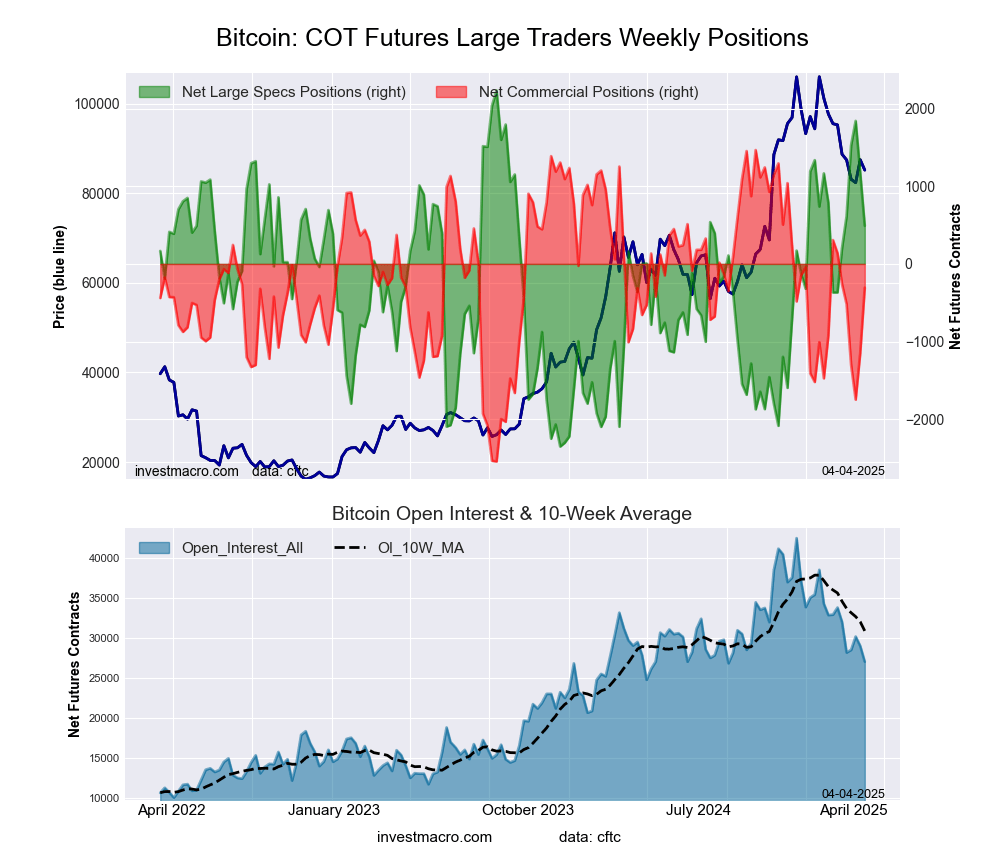
Bitcoin Crypto Futures COT ChartThe Bitcoin large speculator standing this week equaled a net position of 491 contracts in the data reported through Tuesday. This was a weekly fall of -688 contracts from the previous week which had a total of 1,179 net contracts.

This week’s current strength score (the trader positioning range over the past three years, measured from 0 to 100) shows the speculators are currently Bullish with a score of 62.0 percent. The commercials are Bullish with a score of 55.8 percent and the small traders (not shown in chart) are Bearish-Extreme with a score of 3.0 percent.

Price Trend-Following Model: Strong Downtrend

Our weekly trend-following model classifies the current market price position as: Strong Downtrend.

BITCOIN StatisticsSPECULATORSCOMMERCIALSSMALL TRADERS
– Percent of Open Interest Longs:86.33.34.0
– Percent of Open Interest Shorts:84.54.54.7
– Net Position:491-306-185
– Gross Longs:23,3739011,077
– Gross Shorts:22,8821,2071,262
– Long to Short Ratio:1.0 to 10.7 to 10.9 to 1
NET POSITION TREND:
– Strength Index Score (3 Year Range Pct):62.055.83.0
– Strength Index Reading (3 Year Range):BullishBullishBearish-Extreme
NET POSITION MOVEMENT INDEX:
– 6-Week Change in Strength Index:18.7-11.1-28.6


Article By InvestMacroReceive our weekly COT Newsletter

*COT Report: The COT data, released weekly to the public each Friday, is updated through the most recent Tuesday (data is 3 days old) and shows a quick view of how large speculators or non-commercials (for-profit traders) were positioned in the futures markets.

The CFTC categorizes trader positions according to commercial hedgers (traders who use futures contracts for hedging as part of the business), non-commercials (large traders who speculate to realize trading profits) and nonreportable traders (usually small traders/speculators) as well as their open interest (contracts open in the market at time of reporting). See CFTC criteria here.

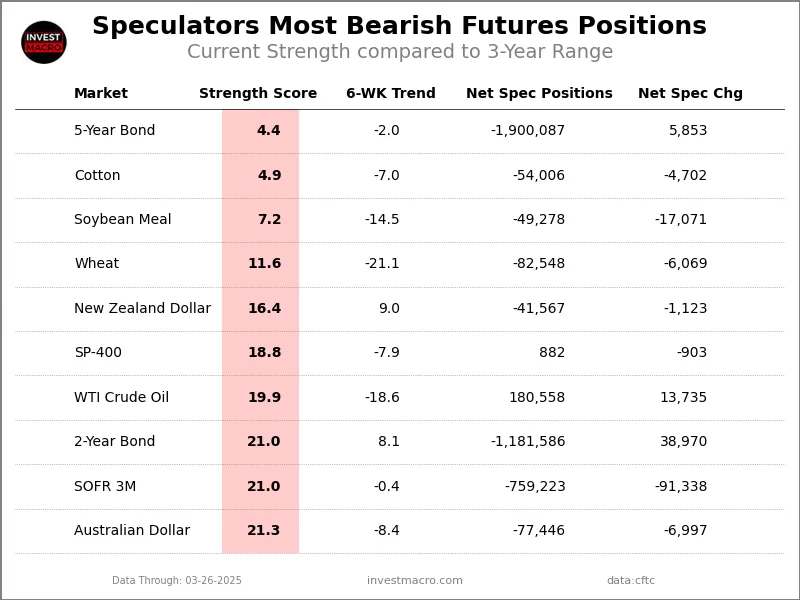
Speculator Extremes: Live Cattle, Brent, 5-Year & Wheat top Bullish & Bearish Positions

By InvestMacro

The latest update for the weekly Commitment of Traders (COT) report was released by the Commodity Futures Trading Commission (CFTC) on Friday for data ending on April 1st.

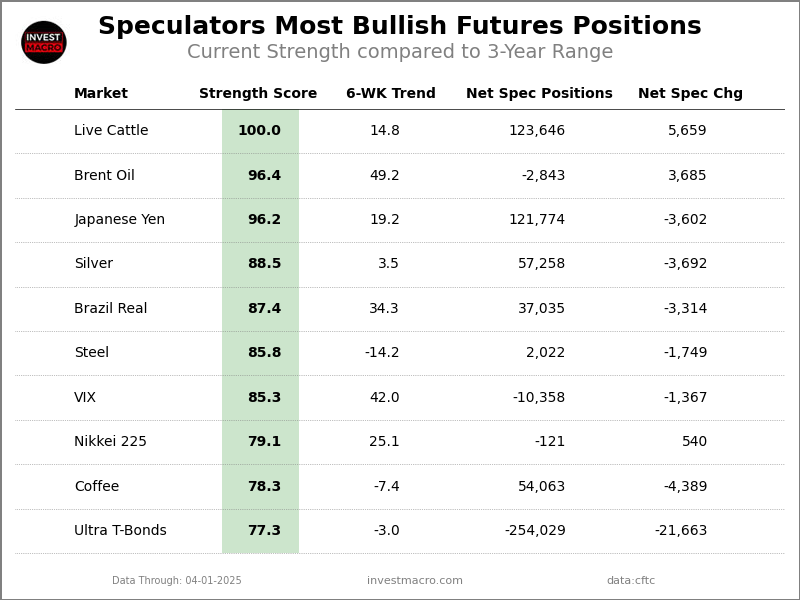
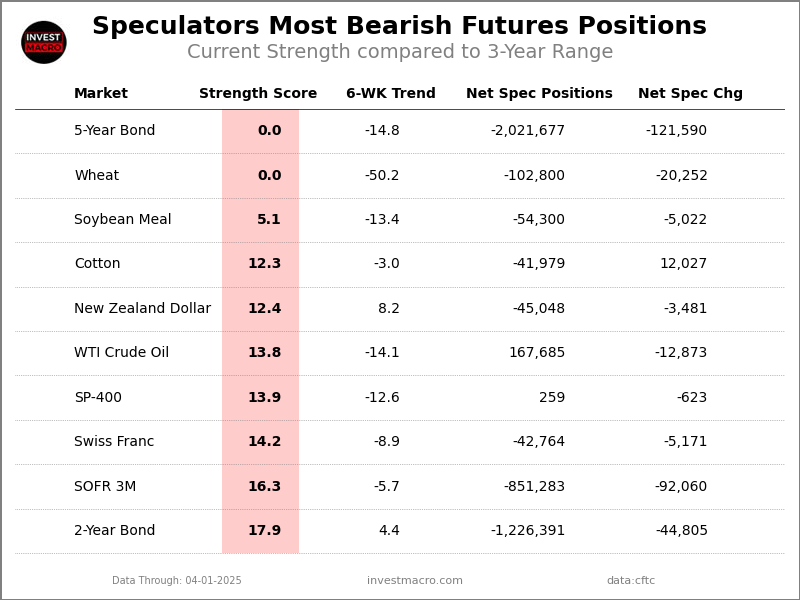
This weekly Extreme Positions report highlights the Most Bullish and Most Bearish Positions for the speculator category. Extreme positioning in these markets can foreshadow strong moves in the underlying market.

To signify an extreme position, we use the Strength Index (also known as the COT Index) of each instrument, a common method of measuring COT data. The Strength Index is simply a comparison of current trader positions against the range of positions over the previous 3 years. We use over 80 percent as extremely bullish and under 20 percent as extremely bearish. (Compare Strength Index scores across all markets in the data table or cot leaders table)


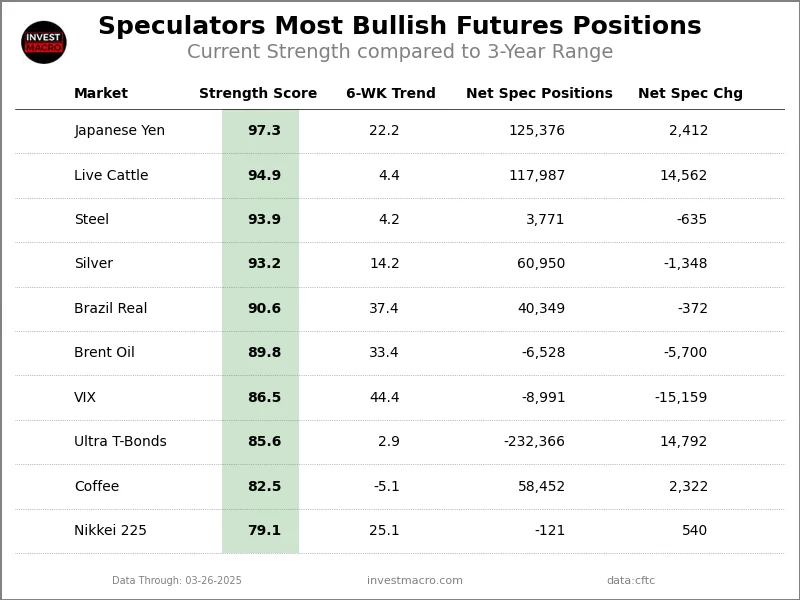
Here Are This Week’s Most Bullish Speculator Positions:

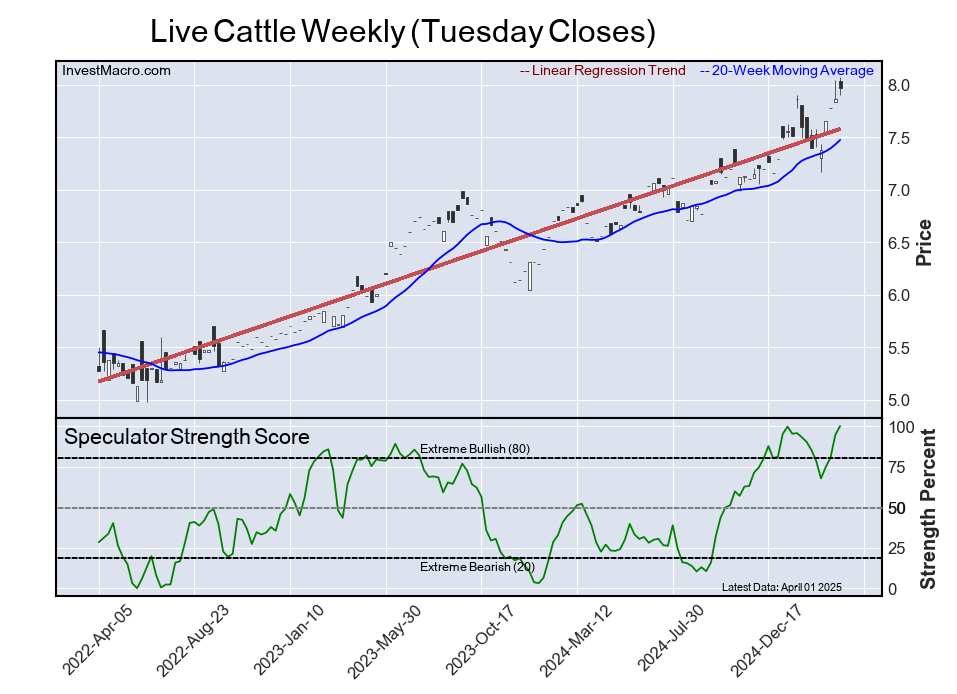
Live Cattle


The Live Cattle speculator position comes in as the most bullish extreme standing this week as the Live Cattle speculator level rose to a 100.0 percent score of its 3-year range.

The six-week trend for the percent strength score totaled 14.8 this week. The overall net speculator position was a total of 123,646 net contracts this week with a gain of 5,659 contract in the weekly speculator bets.


Speculators or Non-Commercials Notes:

Speculators, classified as non-commercial traders by the CFTC, are made up of large commodity funds, hedge funds and other significant for-profit participants. The Specs are generally regarded as trend-followers in their behavior towards price action – net speculator bets and prices tend to go in the same directions. These traders often look to buy when prices are rising and sell when prices are falling. To illustrate this point, many times speculator contracts can be found at their most extremes (bullish or bearish) when prices are also close to their highest or lowest levels.

These extreme levels can be dangerous for the large speculators as the trade is most crowded, there is less trading ammunition still sitting on the sidelines to push the trend further and prices have moved a significant distance. When the trend becomes exhausted, some speculators take profits while others look to also exit positions when prices fail to continue in the same direction. This process usually plays out over many months to years and can ultimately create a reverse effect where prices start to fall and speculators start a process of selling when prices are falling.


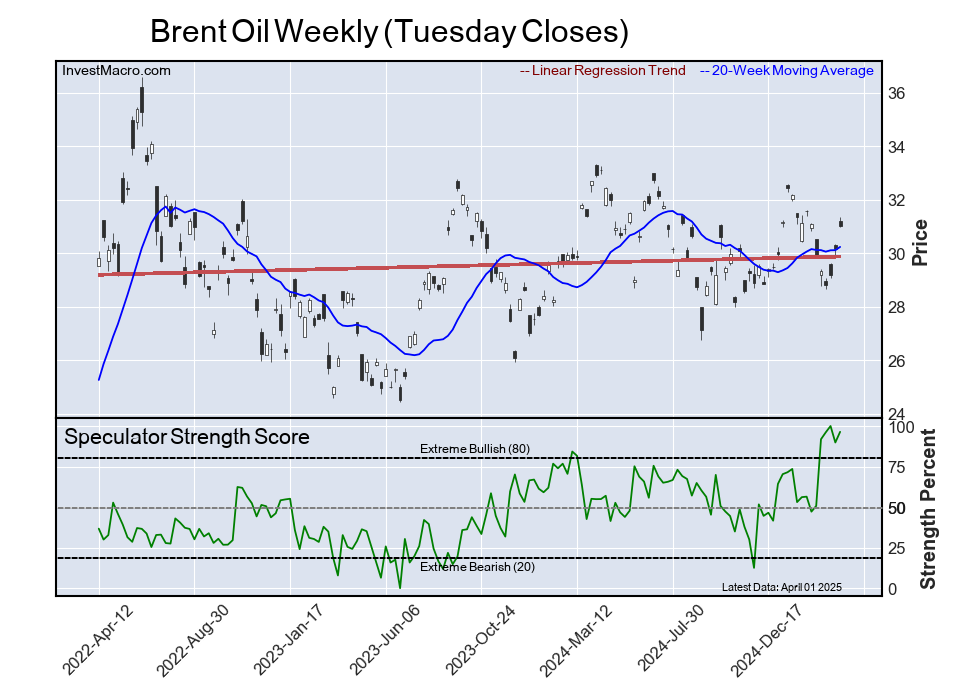
Brent Oil


The Brent Oil speculator position comes next in the extreme standings this week after a spot at the 6th most bullish last week. The Brent Oil speculator level is now at a 96.4 percent score of its 3-year range.

The six-week trend for the percent strength score was 49.2 this week showing a sharp move higher. The speculator position registered -2,843 net contracts this week with a weekly boost by 3,685 contracts in speculator bets.


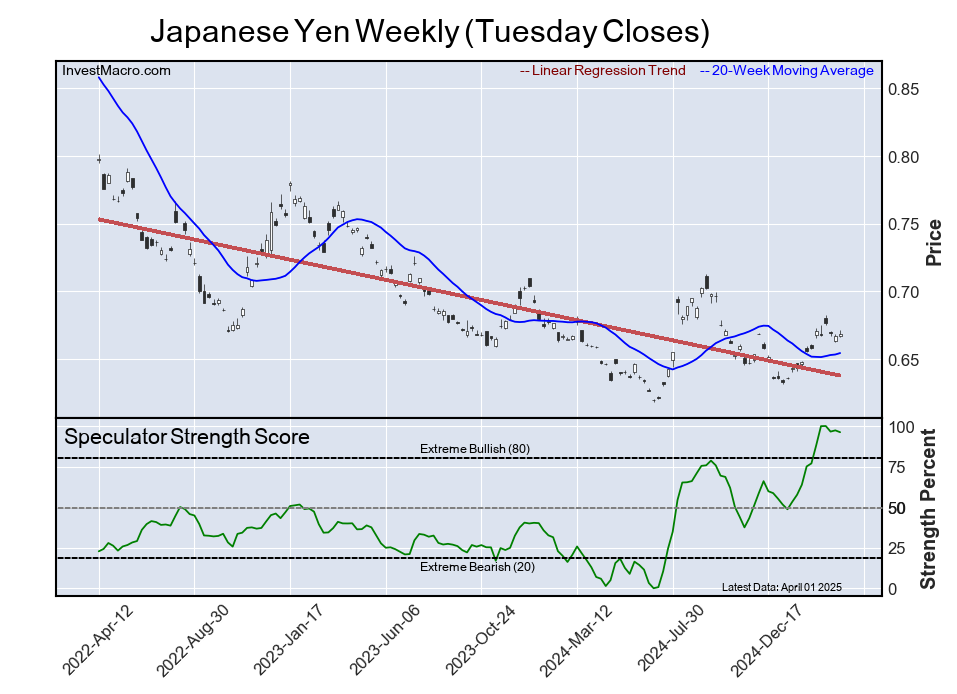
Japanese Yen


The Japanese Yen speculator position comes in third this week in the extreme standings after topping the list last week. The Japanese Yen speculator level resides at a 96.2 percent score of its 3-year range.

The six-week trend for the speculator strength score came in at 19.2 this week. The overall speculator position was 121,774 net contracts with a decline of -3,602 contracts in the weekly speculator bets.


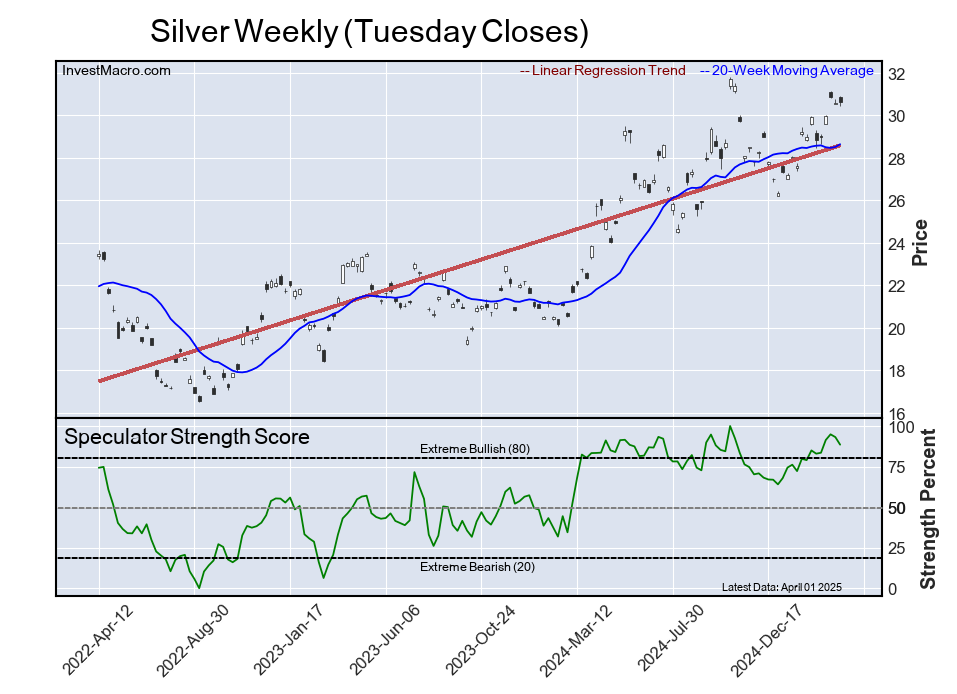
Silver


The Silver speculator position comes up number four (same as last week) in the extreme standings this week. The Silver speculator level is currently at a 88.5 percent score over its 3-year range.

The six-week trend for the speculator strength score totaled a small gain of 3.5 this week. The overall speculator position was 57,258 net contracts this week with a dip by -3,692 contracts in the speculator bets.


Brazil Real


The Brazil Real speculator position rounds out the top five in this week’s bullish extreme standings. The Brazil Real speculator level currently sits at a 87.4 percent score over its 3-year range. The six-week trend for the speculator strength score was a strong 34.3 this week.

The speculator position totaled 37,035 net contracts this week with a reduction by -3,314 contracts in the weekly speculator bets.


This Week’s Most Bearish Speculator Positions:

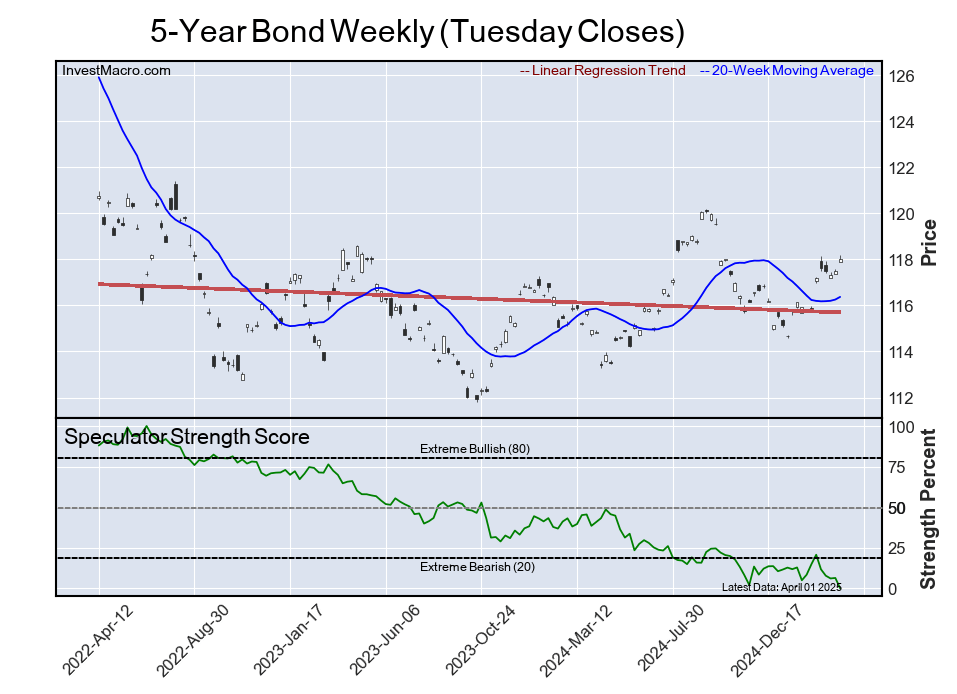
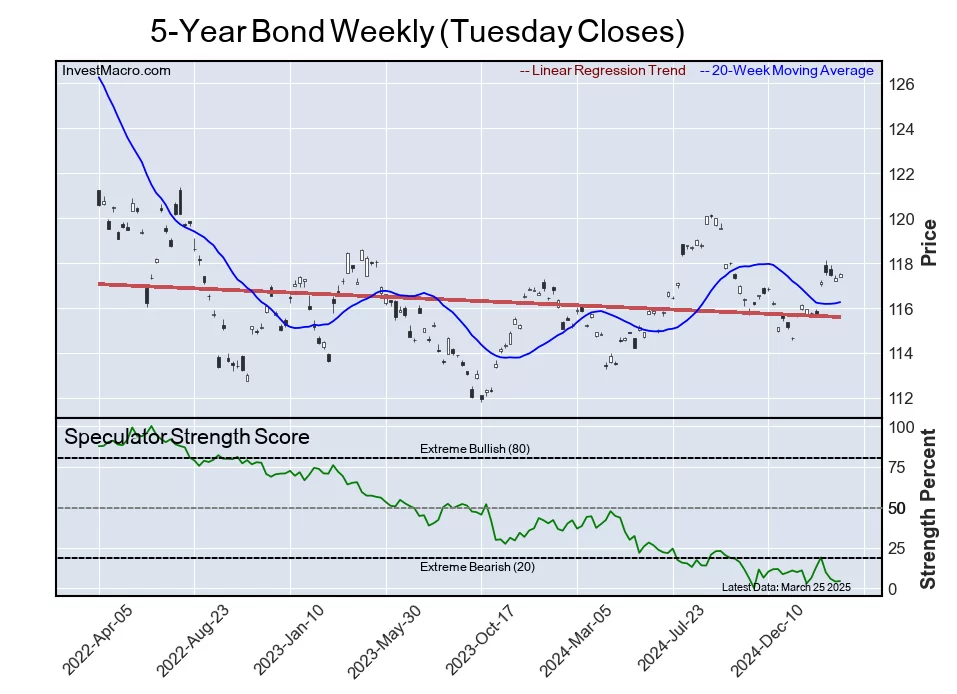
5-Year Bond


The 5-Year Bond speculator position comes in as the most bearish extreme standing again this week as the 5-Year Bond speculator level dropped to a 0.0 percent score of its 3-year range.

The six-week trend for the speculator strength score was -14.8 this week. The overall speculator position was -2,021,677 net contracts this week with a drop of -121,590 contracts in the speculator bets.


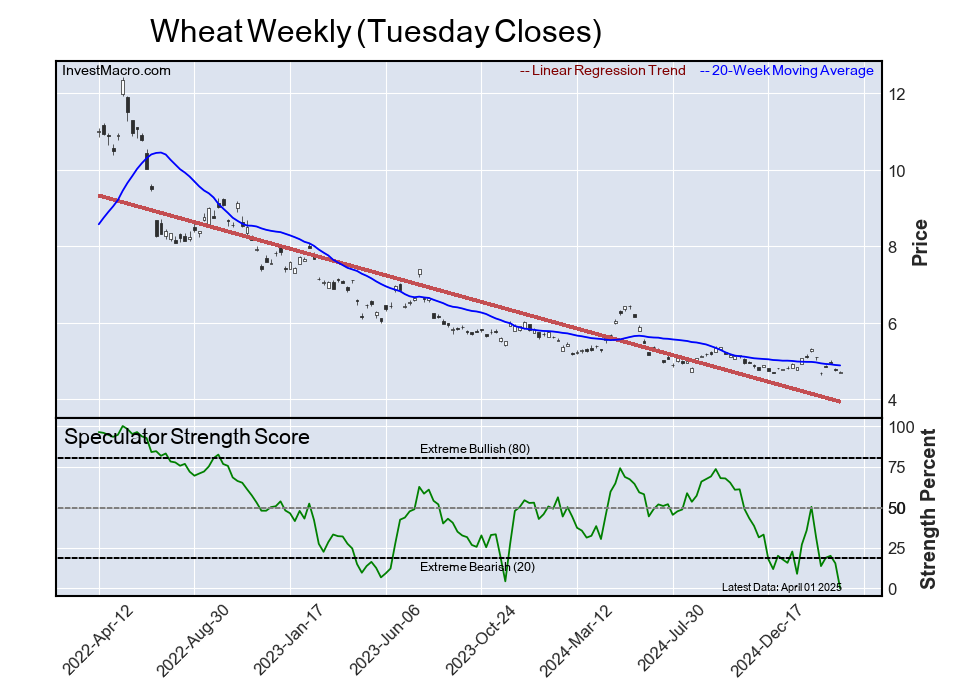
Wheat


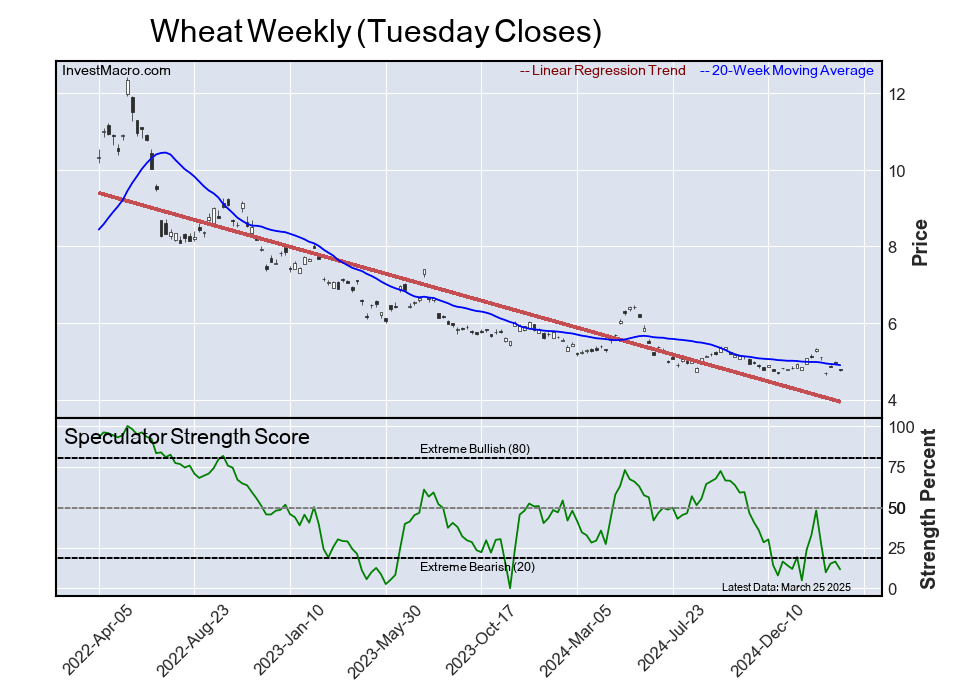
The Wheat speculator position comes in tied for the most bearish extreme standing on the week with the Wheat speculator level now at 0.0 percent score of its 3-year range.

The six-week trend for the speculator strength score was strong -50.2 this week. The speculator position totaled -102,800 net contracts this week with a decrease by -20,252 contracts in the weekly speculator bets.


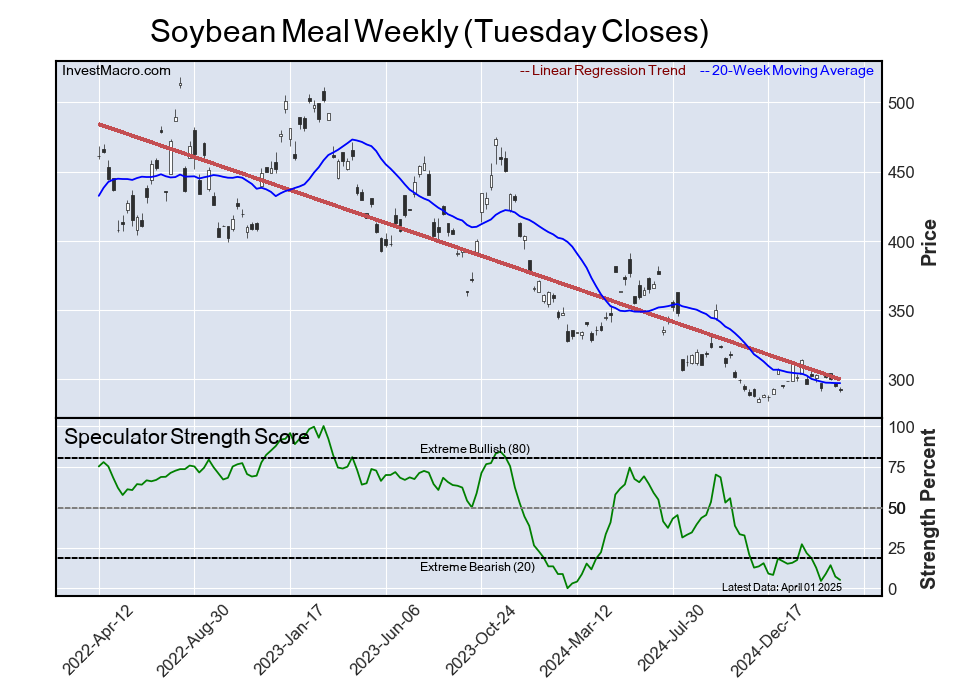
Soybean Meal


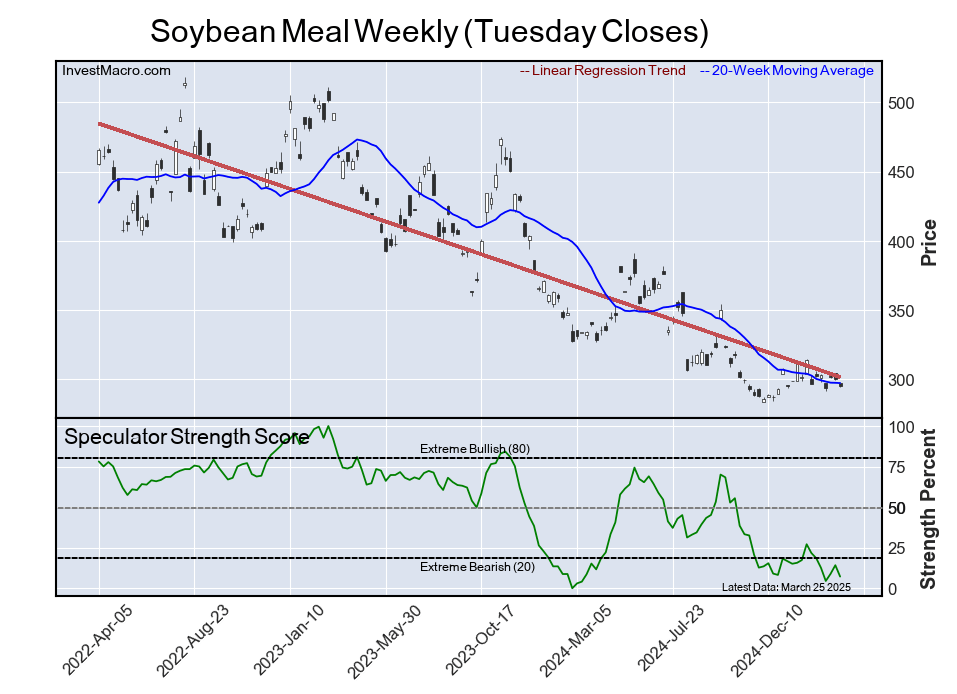
The Soybean Meal speculator position comes in as third most bearish extreme standing of the week. The Soybean Meal speculator level resides at a 5.1 percent score of its 3-year range.

The six-week trend for the speculator strength score was -13.4 this week while the overall speculator position was -54,300 net contracts this week with a decline of -5,022 contracts in the speculator bets.


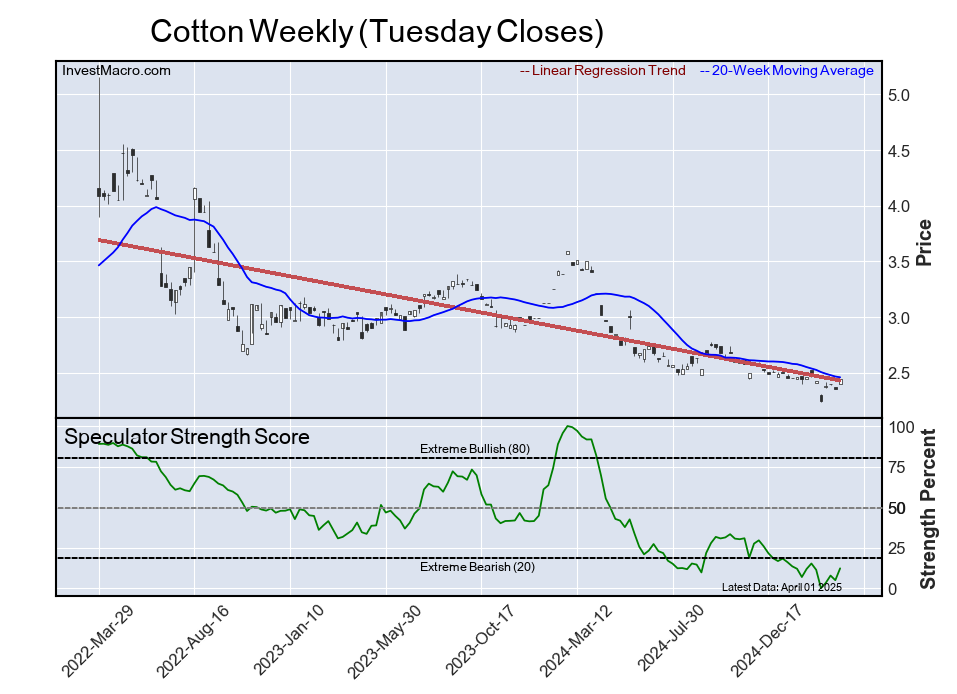
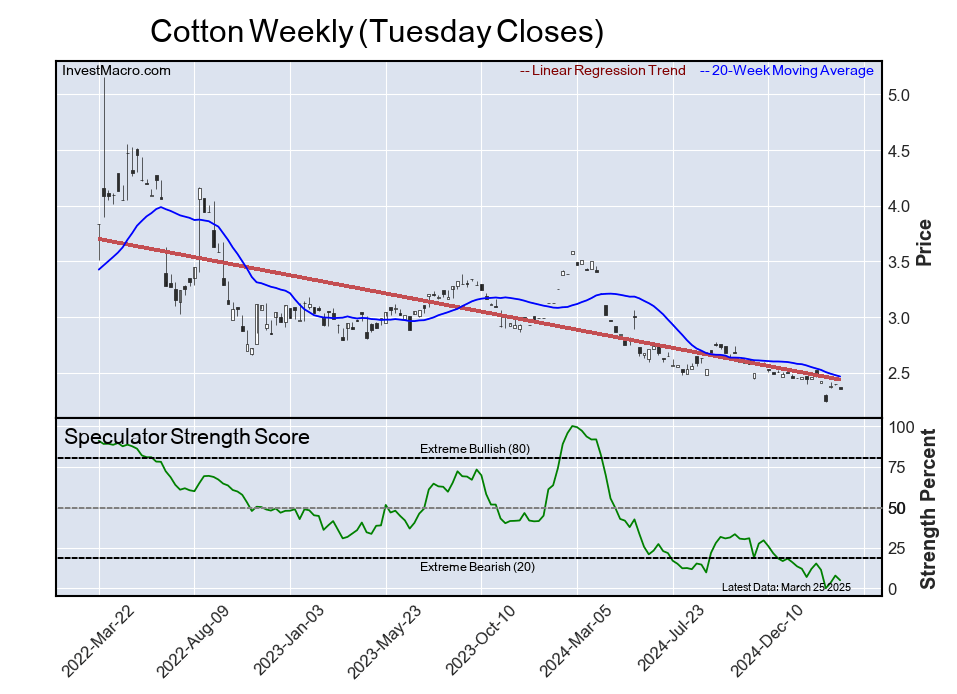
Cotton


The Cotton speculator position comes in as this week’s fourth most bearish extreme standing. The Cotton speculator level is at a 12.3 percent score of its 3-year range.

The six-week trend for the speculator strength score was a modest -3.0 this week while the speculator position totaled -41,979 net contracts with a rise by 12,027 contracts in the weekly speculator bets.


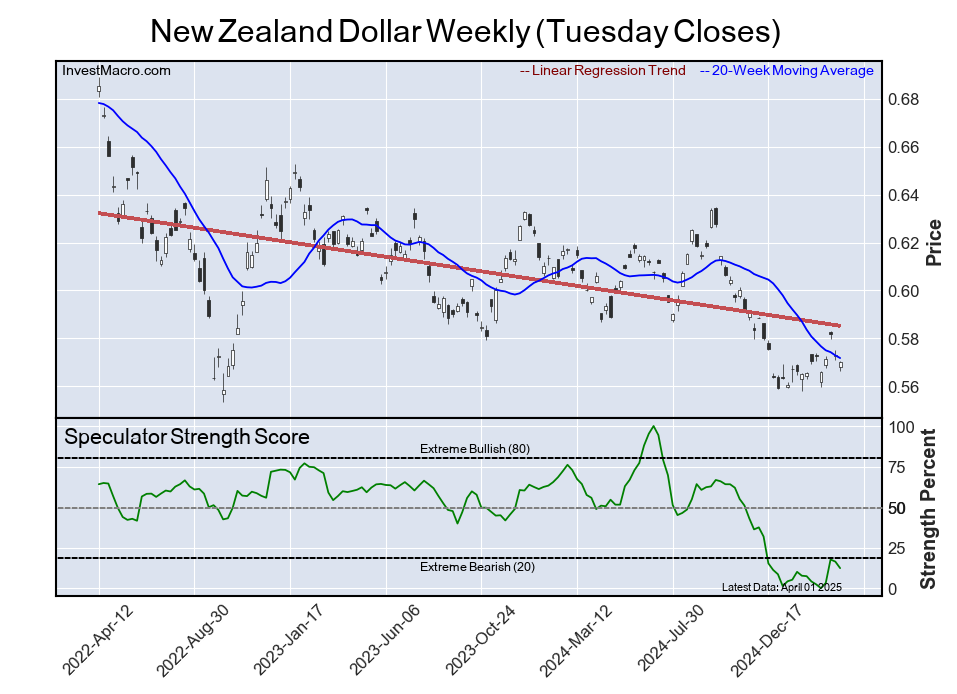
New Zealand Dollar


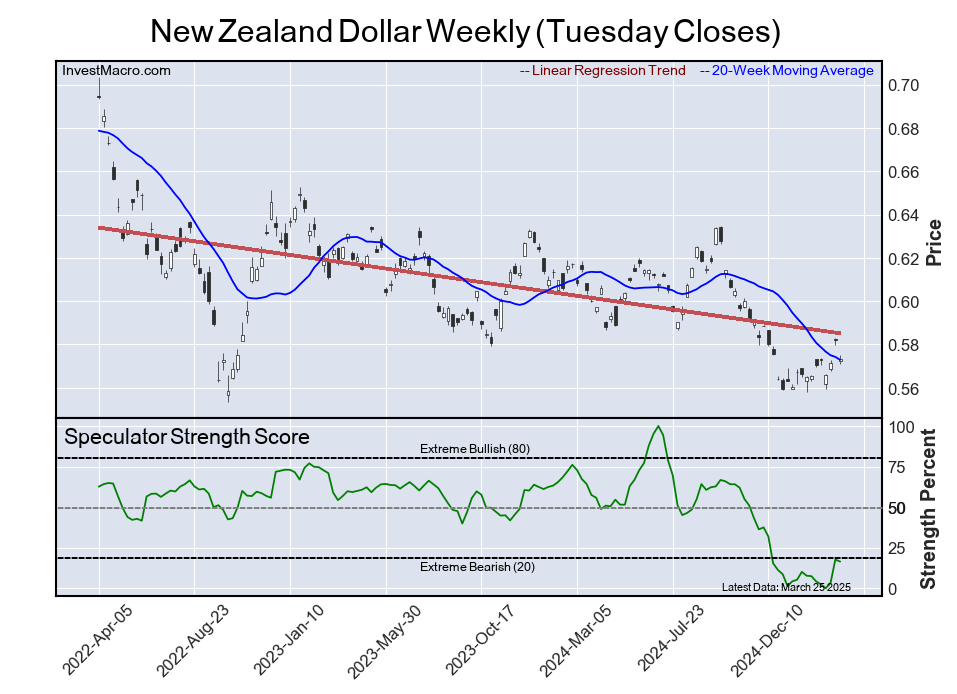
Finally, the New Zealand Dollar speculator position comes in as the fifth most bearish extreme standing for a second straight week. The New Zealand Dollar speculator level is currently at a 12.4 percent score of its 3-year range.

The six-week trend for the speculator strength score was a positive 8.2 this week. The speculator position was a total of -45,048 net contracts with a decrease by -3,481 contracts in the weekly speculator bets.


Article By InvestMacroReceive our weekly COT Newsletter

*COT Report: The COT data, released weekly to the public each Friday, is updated through the most recent Tuesday (data is 3 days old) and shows a quick view of how large speculators or non-commercials (for-profit traders) were positioned in the futures markets.

The CFTC categorizes trader positions according to commercial hedgers (traders who use futures contracts for hedging as part of the business), non-commercials (large traders who speculate to realize trading profits) and nonreportable traders (usually small traders/speculators) as well as their open interest (contracts open in the market at time of reporting). See CFTC criteria here.

New modelling reveals full impact of Trump’s ‘Liberation Day’ tariffs – with the US hit hardest

By Niven Winchester, Auckland University of Technology 

We now have a clearer picture of Donald Trump’s “Liberation Day” tariffs and how they will affect other trading nations, including the United States itself.

The US administration claims these tariffs on imports will reduce the US trade deficit and address what it views as unfair and non-reciprocal trade practices. Trump said this would

forever be remembered as the day American industry was reborn, the day America’s destiny was reclaimed.

The “reciprocal” tariffs are designed to impose charges on other countries equivalent to half the costs they supposedly inflict on US exporters through tariffs, currency manipulation and non-tariff barriers levied on US goods.

Each nation received a tariff number that will apply to most goods. Notable sectors exempt include steel, aluminium and motor vehicles, which are already subject to new tariffs.

The minimum baseline tariff for each country is 10%. But many countries received higher numbers, including Vietnam (46%), Thailand (36%), China (34%), Indonesia (32%), Taiwan (32%) and Switzerland (31%).

The tariff number for China is in addition to an existing 20% tariff, so the total tariff applied to Chinese imports is 54%. Countries assigned 10% tariffs include Australia, New Zealand and the United Kingdom.

Canada and Mexico are exempt from the reciprocal tariffs, for now, but goods from those nations are subject to a 25% tariff under a separate executive order.

Although some countries do charge higher tariffs on US goods than the US imposes on their exports, and the “Liberation Day” tariffs are allegedly only half the full reciprocal rate, the calculations behind them are open to challenge.

For example, non-tariff measures are notoriously difficult to estimate and “subject to much uncertainty”, according to one recent study.

GDP impacts with retaliation

Other countries are now likely to respond with retaliatory tariffs on US imports. Canada (the largest destination for US exports), the EU and China have all said they will respond in kind.

To estimate the impacts of this tit-for-tat trade standoff, I use a global model of the production, trade and consumption of goods and services. Similar simulation tools – known as “computable general equilibrium models” – are widely used by governments, academics and consultancies to evaluate policy changes.

The first model simulates a scenario in which the US imposes reciprocal and other new tariffs, and other countries respond with equivalent tariffs on US goods. Estimated changes in GDP due to US reciprocal tariffs and retaliatory tariffs by other nations are shown in the table below.


The tariffs decrease US GDP by US$438.4 billion (1.45%). Divided among the nation’s 126 million households, GDP per household decreases by $3,487 per year. That is larger than the corresponding decreases in any other country. (All figures are in US dollars.)

Proportional GDP decreases are largest in Mexico (2.24%) and Canada (1.65%) as these nations ship more than 75% of their exports to the US. Mexican households are worse off by $1,192 per year and Canadian households by $2,467.

Other nations that experience relatively large decreases in GDP include Vietnam (0.99%) and Switzerland (0.32%).

Some nations gain from the trade war. Typically, these face relatively low US tariffs (and consequently also impose relatively low tariffs on US goods). New Zealand (0.29%) and Brazil (0.28%) experience the largest increases in GDP. New Zealand households are better off by $397 per year.

Aggregate GDP for the rest of the world (all nations except the US) decreases by $62 billion.

At the global level, GDP decreases by $500 billion (0.43%). This result confirms the well-known rule that trade wars shrink the global economy.

GDP impacts without retaliation

In the second scenario, the modelling depicts what happens if other nations do not react to the US tariffs. The changes in the GDP of selected countries are presented in the table below.


Countries that face relatively high US tariffs and ship a large proportion of their exports to the US experience the largest proportional decreases in GDP. These include Canada, Mexico, Vietnam, Thailand, Taiwan, Switzerland, South Korea and China.

Countries that face relatively low new tariffs gain, with the UK experiencing the largest GDP increase.

The tariffs decrease US GDP by $149 billion (0.49%) because the tariffs increase production costs and consumer prices in the US.

Aggregate GDP for the rest of the world decreases by $155 billion, more than twice the corresponding decrease when there was retaliation. This indicates that the rest of the world can reduce losses by retaliating. At the same time, retaliation leads to a worse outcome for the US.

Previous tariff announcements by the Trump administration dropped sand into the cogs of international trade. The reciprocal tariffs throw a spanner into the works. Ultimately, the US may face the largest damages.The Conversation

About the Author:

Niven Winchester, Professor of Economics, Auckland University of Technology

This article is republished from The Conversation under a Creative Commons license. Read the original article.


Week Ahead: S&P 500 to flirt with “bear market”?

By ForexTime 

  • US500 plummets to lowest since August; after Thursday’s biggest 1-day drop since pandemic
  • China announces tariff retaliation ahead of Friday’s NFP, Powell speech
  • Week Ahead: EU retaliation, US CPI, and earnings season could trigger more big moves!
  • Markets may not find comfort from Fed speakers next week
  • Technical rebound likely not sustained, barring stunning risk turnaround
  • Wall Street still forecasting new record high for S&P 500 over next 12 months
  • US500 would officially enter “bear market” if it falls to 4921.04.


US stock indices are extending their steep drop on Friday!

This comes after just posting their biggest one-day drop since the pandemic on Thursday, April 3rd, 2025 when the:

  • S&P 500 (tracked by FXTM’s US500) fell 4.84%.
  • Dow Jones Industrial Average a.k.a. the Dow (tracked by FXTM’s US30) fell 3.98%.
  • S&P Midcap 400 index (tracked by FXTM’s US400) fell 6.66%.
  • Russell 2000 (tracked by FXTM’s RUS2000) fell 6.59%.

Thursday’s declines marked their largest one-day drop (in % terms) for each of these US stock indices since June 11th, 2020!

As for the tech-heavy Nasdaq 100 (tracked by FXTM’s NAS100), it fell 5.41% yesterday – nearly matching its 5.54% plummet on September 13th, 2022.

READ MORE: Trump’s “Liberation Day” Tariffs: How are markets reacting? (published Thursday, April 3rd, 2025)


Why are US stock markets falling on Friday (April 4th)?

In a tit-for-tat move, China has just responded to US President Donald Trump’s “liberation day” tariff hike earlier this week (Wednesday, April 2nd).

Today, China announced 34% tariffs on all US imports starting April 10th!

Although the 34% number is lower than the 54% rate imposed by President Trump on Chinese shipments …

This has clearly escalated the trade war between the world’s two largest economies! 

This has left investors and traders worldwide outright fearful about the impact from an escalating global trade war, potentially sending the world into a recession!

And there could be even more volatility today for US stock indices.

Note that these steep declines at the time of writing are happening even before the release of the monthly US jobs report (NFP – nonfarm payrolls) as Fed Chair Jerome Powell’s speech due later today (Friday, April 4th).


And that’s before we enter the week ahead which features these key scheduled economic events:

Monday, April 7

  • XAU: China foreign reserves
  • GER40 index: Germany February industrial production, external trade
  • EUR: EU trade minister to discuss reaction to Trump tariffs; Eurozone February retail sales
  • USDInd: Speech by Dallas Fed President Lorie Logan

Tuesday, April 8

  • AUD: Australia April consumer confidence; March business confidence
  • TWN index: Taiwan March CPI, PPI
  • USDInd: Speech by San Franscisco Fed President Mary Daly

Wednesday, April 9

  • NZD: RBNZ rate decision
  • MXN: Mexico March CPI
  • USDInd: FOMC meeting minutes; speech by Richmond Fed President Tom Barkin
  • US “reciprocal” tariffs go into effect

Thursday, April 10

  • JP225 index: Japan March PPI
  • CN50 index: China March CPI, PPI
  • TWN index: Taiwan March trade balance
  • US500 index: US March CPI
  • RUS2000 index: US initial weekly jobless claims; speeches by Chicago Fed President Austan Goolsbee, Philadelphia Fed President Patrick Harker, Dallas Fed President Lorie Logan
  • China’s retaliatory 34% tariffs against US go into effect

Friday, April 11

  • NZD: New Zealand March manufacturing PMI
  • GBP: UK February GDP, industrial production, trade balance
  • US400 index: US April consumer sentiment; March PPI
  • USDInd: Speeches by New York Fed President John Williams, St. Louis Fed President Alberto Musalem
  • US30 index: US earnings season kicks off with JPMorgan Chase, Morgan Stanley, Wells Fargo etc.


3 things to look out for next week (April 7– 11):


1) Monday, April 7th: Tariff Retaliation

EU trade ministers are set to gather in Luxembourg for a closely-watched meeting.

The agenda?

To formulate the EU’s reaction to President Trump’s tariff salvo.

  • BEARISH: US stock indexes could fall further if the EU adopts an aggressive stance, emulating China, and retaliates in a tit-for-tat manner.
  • BULLISH: US stock indexes could rebound if the EU adopts a more conciliatory tone with the US administration, looking to swiftly strike a trade deal instead.


2) Thursday, April 10th: US March consumer price index (CPI)

Here’s what economists predict for the upcoming inflation report (CPI measures inflation)

  • CPI month-on-month (March 2025 vs. February 2025): 0.1%

If so, this would be lower than February’s 0.2% month-on-month number.

  • CPI year-on-year (March 2025 vs. March 2024): 2.6%

If so, this would be lower than February’s 2.8% year-on-year number.

  • Core CPI (excluding volatile food and energy prices) month-on-month: 0.3%

If so, this would be higher than February’s 0.2% core month-on-month number.

  • Core CPI year-on-year: 3.0%

If so, this would be lower than February’s 3.1% core year-on-year number.

US stagflation fears are running rampant across US stock markets as we head into the weekend and is set to persist into the coming week.

NOTE: Stagflation is when inflation remains high, at a time when economic growth is sluggish.

  • BEARISH: US stock indexes could fall further if the CPI numbers come in higher-than-expected, lending credence to a stagflation scenario.
  • BULLISH: US stock indexes could rebound if the CPI numbers come in lower-than-expected, easing stagflation fears.


3) Friday, April 11th: US earnings season kicks off with Wall Street banks

Banking titans such as JPMorgan Chase, Bank of New York Mellon, Morgan Stanley, and Wells Fargo are due to report their respective Q1 earnings a week from today.

However, markets are set to look past the backward-looking reported figures, and instead focus on the earnings outlook for these major US banks, in light of stagflation/recession risks.

  • BEARISH: US stock indexes could fall further if these banking giants sound the alarm about a looming stagflation/recession for the world’s largest economy.
  • BULLISH: US stock indexes could rebound if these banking giants remain confident about their respective earnings and the broader US economic growth narrative, despite President Trump’s tariff shocker.


But wait, there’s more.

Beyond the 3 above-listed events, note that the coming week will also be peppered with Fed Speak.

At least 7 different Fed officials are set to make scheduled speeches in the week ahead.

  • BEARISH: US stock indexes could fall further if these Fed officials, especially those speaking after the CPI print, say they are more hesitant to cut interest rates this year as tariffs may reignite US inflation.
  • BULLISH: US stock indexes could rebound if these Fed officials view the potential inflationary impact from US tariffs as being “transitory”, in turn allowing the Fed to eventually cut rates later this year.


US500 in focus

FXTM’s US500 tracks the S&P 500 – the most widely-used benchmark for US stock markets.

At the time of writing, the US500 is testing support around the big 5,200 level.

From a technical perspective, it appears to have met the textbook threshold for “oversold” conditions, as its 14-day relative strength has dropped below the 30 line.

This suggests a near-term technical pullback could be in order (depending on how today’s NFP and Powell speech pan out).

Imagen
S&P 500 falls sharply further into technical correction


  • BEARISH: If the downside momentum persists over the coming week, the US500 may fall to the big, round 5k level – a level last seen 12 months ago (April 2024).

The US500 at the 5,000 level would put it within spitting distance of a ‘bear market”!

NOTE: A “bear market” is when prices have fallen 20% from its recent peak. 
A 20% drop from the US500’s all-time intraday high of 6151.3 (on February 19th, 2025) would be 4921.04.


  • BULLISH: If there’s an abrupt turnaround in risk sentiment, perhaps by way of an easing of trade war/stagflation/recession fears, that could see the US500 recover back to 5400.


Over the long term …

Wall Street experts still predict the US stock markets to recover eventually by this time next year, with the aggregated 12-month target price for the S&P 500 now standing at 6822.87.

If those long-term predictions come true …

That would mark a new record high for the S&P 500/US500, and a whopping 26.4% in potential upside over the coming year.

However, before it can presumably get there, traders must first battle through the twists and turns in the days ahead pertaining to the Trump-led trade war.

Although market fears are still running high, and risks still aplenty, there are bound to be sizeable trading opportunities amidst all the market volatility expected in the coming week.


Forex-Time-LogoArticle by ForexTime

ForexTime Ltd (FXTM) is an award winning international online forex broker regulated by CySEC 185/12 www.forextime.com

Speculators add to Japanese & European Bets while US Dollar & Commodity Currencies Bets Slide

By InvestMacro

Here are the latest charts and statistics for the Commitment of Traders (COT) data published by the Commodities Futures Trading Commission (CFTC).

The latest COT data is updated through Tuesday March 25th and shows a quick view of how large market participants (for-profit speculators and commercial traders) were positioned in the futures markets. All currency positions are in direct relation to the US dollar where, for example, a bet for the euro is a bet that the euro will rise versus the dollar while a bet against the euro will be a bet that the euro will decline versus the dollar.

Weekly Speculator Changes led by British Pound & Canadian Dollar
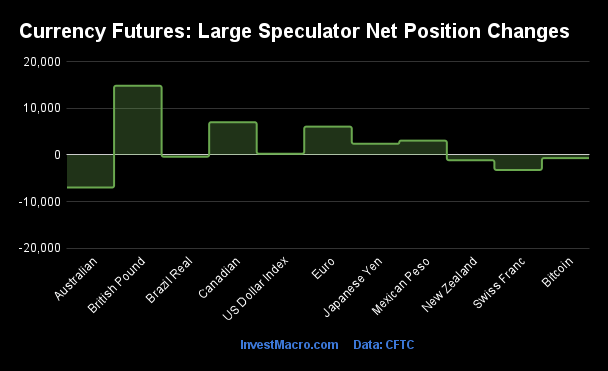
The COT currency market speculator bets were slightly overall higher this week as six out of the eleven currency markets we cover had higher positioning while the other five markets had lower speculator contracts.

Leading the gains for the currency markets was the British Pound Sterling (14,881 contracts) with the Canadian Dollar (7,048 contracts), the Euro (6,100 contracts), the Mexican Peso (3,087 contracts), the Japanese Yen (2,412 contracts) and the US Dollar Index (280 contracts) also showing positive weeks.

The currencies seeing declines in speculator bets on the week were the Australian Dollar (-6,997 contracts), the Swiss Franc (-3,218 contracts), the New Zealand Dollar (-1,123 contracts), Bitcoin (-662 contracts) and the Brazilian Real (-372 contracts) also registering lower bets on the week.

RoundUp: Speculators continued to add to Japanese & European currencies while US Dollar & Commodity currencies see lower bets

The speculative landscape for the currency futures this week continued to be a mixed bag with some major currencies seeing sentiment gains versus the US Dollar while others continued to see weak sentiment levels persist.

The US Dollar Index futures saw slightly higher speculator contracts this week with a small gain of 280 contracts. But overall, the US Dollar Index bets have fallen in three out of the past five weeks and by a total of -9,300 contracts over these past five weeks, bringing the total bullish position to just +7,468 contracts (down by more than 50% of 3 weeks ago). The Dollar Index price has remained in a short-term downtrend that started in the new year and has taken the price from over 109.00 to the current level of approximately 104.00. The 102.50 and the very significant level of 100.00 still linger below as major support barriers if the downtrend continues.

The Euro speculator positions have continued to see positive sentiment with gains in six straight weeks and the overall position has risen by +129,950 contracts in the last six weeks through Tuesday. The Euro standing for speculators is at the highest level since September after a 20-week spell in bearish territory from October to early March. The Euro futures price trades around the 1.0825 level currently, up from around the 1.0250 levels to end 2024 but would need to breakthrough the tough 1.1250 resistance to see a strong breakout to the upside and perhaps, a new Euro bull market.

The British pound sterling led the currencies in bullish bets on the week and overall, the GBP speculator positions have risen for eight straight weeks through Tuesday. This has brought the overall spec standing to a +44,283 contract bullish position – the highest since November. The GBP futures price has been on a bullish run since the beginning of the new year and is currently right at a significant overhead resistance level of 1.3000. The test of this level will determine the next path for the GBP as a breakthrough above 1.3000 could see a retest of the 2024 high (just below 1.3500) or we could see a breakdown and testing of lower levels (200-weekly ma at 1.2715 & previous support around 1.2500-1.2650).

The Japanese yen speculators boosted their bets this week for the ninth time out of the past ten weeks with a total +154,787 contract gain over that time. This week’s spec level is the third highest level on record at a total of +125,376 contracts for the yen and demonstrates how bullish speculators are on the currency. However, it remains to be seen if this level of sentiment can propel the JPY to higher price levels. The yen remains in a historically weak position versus the US Dollar as the USDJPY trades right around the 150.00 level and the currency pair has been bid up relatively quickly anytime there is a dip below this threshold. There is going to need a sustained push below the 150.00 level to get traction on a yen bullish case.

The Canadian, Australian and New Zealand dollars (commodity currencies) are all in similar situations currently in terms of speculator positioning. All three sport strength scores (current levels compared to last 3-years of spec bets) of 30 or under with the Canadian dollar at 30, Australian at 21 and the New Zealand currency at 16. Recently, the New Zealand dollar speculator positions fell to an all-time record low of -55,765 contracts on March 4th. Perhaps, the worst of the sentiment is over for these currencies in this down cycle but we would need to see a sustained turning of the bearish positions in conjunction with price trends coming out of the deep downtrends all three currencies are in now.


Currencies Net Speculators Leaderboard
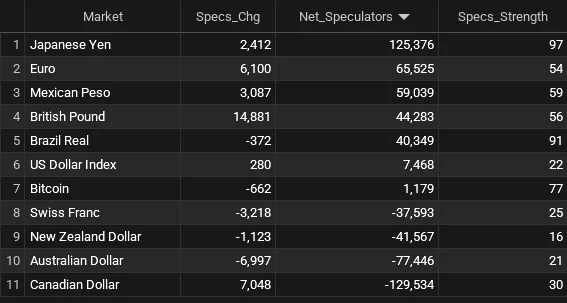
Legend: Weekly Speculators Change | Speculators Current Net Position | Speculators Strength Score compared to last 3-Years (0-100 range)


Strength Scores led by Japanese Yen & Brazilian Real
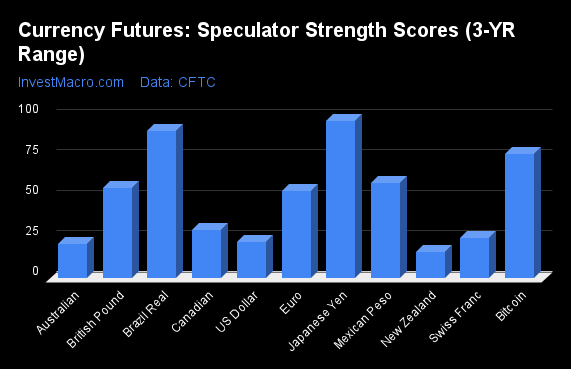
COT Strength Scores (a normalized measure of Speculator positions over a 3-Year range, from 0 to 100 where above 80 is Extreme-Bullish and below 20 is Extreme-Bearish) showed that the Japanese Yen (97 percent) and the Brazilian Real (91 percent) lead the currency markets this week. Bitcoin (77 percent), the Mexican Peso (59 percent) and the British Pound (56 percent) came in as the next highest in the weekly strength scores.

On the downside, the New Zealand Dollar (16 percent) comes in at the lowest strength levels currently and is in Extreme-Bearish territory (below 20 percent). The next lowest strength scores are the Australian Dollar (21 percent), the US Dollar Index (22 percent) and the Swiss Franc (25 percent).

3-Year Strength Statistics:
US Dollar Index (22.2 percent) vs US Dollar Index previous week (21.6 percent)
EuroFX (53.7 percent) vs EuroFX previous week (51.4 percent)
British Pound Sterling (56.0 percent) vs British Pound Sterling previous week (49.3 percent)
Japanese Yen (97.3 percent) vs Japanese Yen previous week (96.6 percent)
Swiss Franc (24.7 percent) vs Swiss Franc previous week (31.2 percent)
Canadian Dollar (29.9 percent) vs Canadian Dollar previous week (26.7 percent)
Australian Dollar (21.3 percent) vs Australian Dollar previous week (26.3 percent)
New Zealand Dollar (16.4 percent) vs New Zealand Dollar previous week (17.7 percent)
Mexican Peso (58.9 percent) vs Mexican Peso previous week (57.3 percent)
Brazilian Real (90.6 percent) vs Brazilian Real previous week (90.9 percent)
Bitcoin (77.0 percent) vs Bitcoin previous week (91.5 percent)


EuroFX & Brazilian Real top the 6-Week Strength Trends
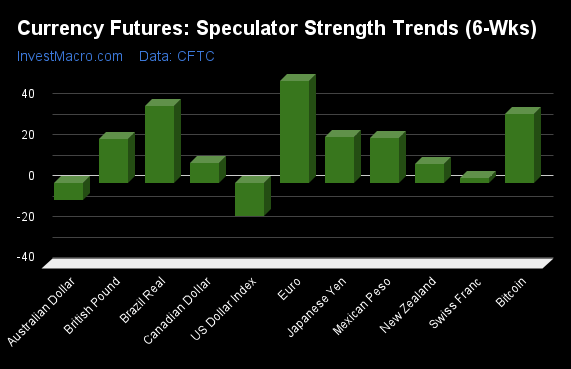
COT Strength Score Trends (or move index, calculates the 6-week changes in strength scores) showed that the EuroFX (49 percent) and the Brazilian Real (37 percent) lead the past six weeks trends for the currencies. Bitcoin (34 percent), the Japanese Yen (22 percent) and the Mexican Peso (22 percent) are the next highest positive movers in the 3-Year trends data.

The US Dollar Index (-16 percent) leads the downside trend scores currently with the Australian Dollar (-8 percent) following next with lower trend scores.

3-Year Strength Trends:
US Dollar Index (-16.2 percent) vs US Dollar Index previous week (-15.2 percent)
EuroFX (49.5 percent) vs EuroFX previous week (44.9 percent)
British Pound Sterling (21.3 percent) vs British Pound Sterling previous week (18.3 percent)
Japanese Yen (22.2 percent) vs Japanese Yen previous week (32.8 percent)
Swiss Franc (2.3 percent) vs Swiss Franc previous week (16.0 percent)
Canadian Dollar (9.5 percent) vs Canadian Dollar previous week (10.7 percent)
Australian Dollar (-8.4 percent) vs Australian Dollar previous week (3.4 percent)
New Zealand Dollar (9.0 percent) vs New Zealand Dollar previous week (10.0 percent)
Mexican Peso (22.0 percent) vs Mexican Peso previous week (22.3 percent)
Brazilian Real (37.4 percent) vs Brazilian Real previous week (38.5 percent)
Bitcoin (33.7 percent) vs Bitcoin previous week (23.0 percent)


Individual COT Forex Markets:

US Dollar Index Futures:
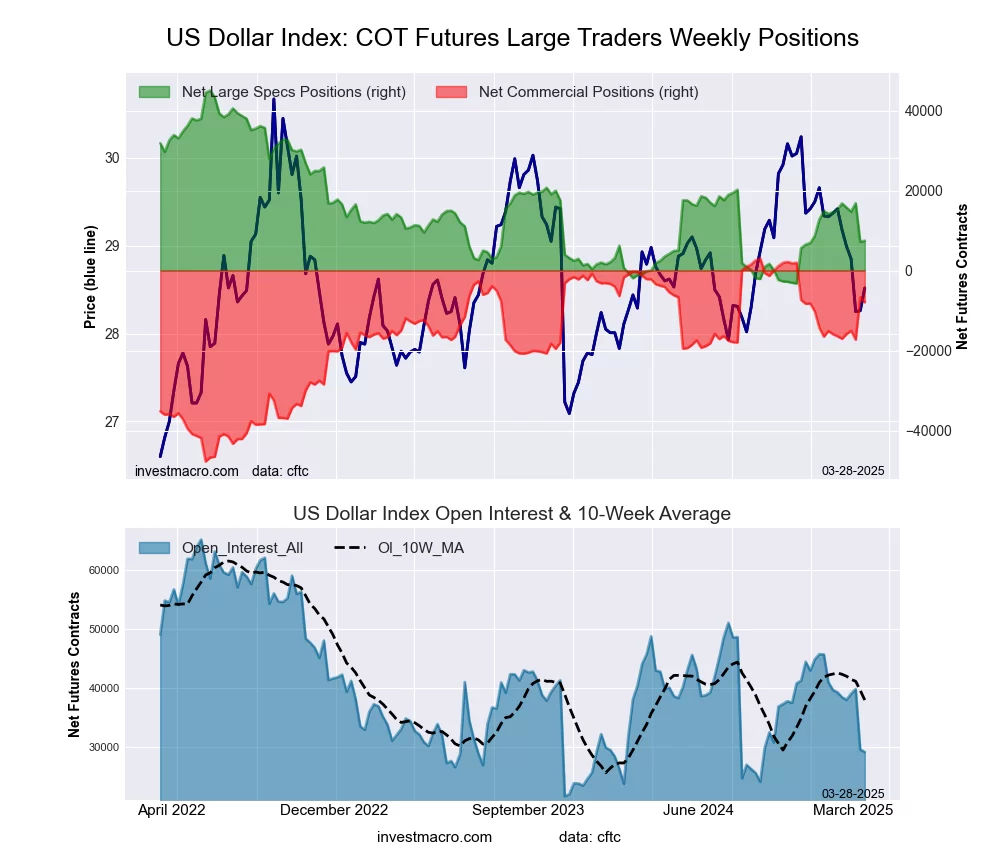
US Dollar Index Forex Futures COT ChartThe US Dollar Index large speculator standing this week equaled a net position of 7,468 contracts in the data reported through Tuesday. This was a weekly lift of 280 contracts from the previous week which had a total of 7,188 net contracts.

This week’s current strength score (the trader positioning range over the past three years, measured from 0 to 100) shows the speculators are currently Bearish with a score of 22.2 percent. The commercials are Bullish with a score of 78.4 percent and the small traders (not shown in chart) are Bearish with a score of 31.3 percent.

Price Trend-Following Model: Strong Downtrend

Our weekly trend-following model classifies the current market price position as: Strong Downtrend.

US DOLLAR INDEX StatisticsSPECULATORSCOMMERCIALSSMALL TRADERS
– Percent of Open Interest Longs:77.74.710.1
– Percent of Open Interest Shorts:52.131.98.5
– Net Position:7,468-7,945477
– Gross Longs:22,6991,3852,953
– Gross Shorts:15,2319,3302,476
– Long to Short Ratio:1.5 to 10.1 to 11.2 to 1
NET POSITION TREND:
– Strength Index Score (3 Year Range Pct):22.278.431.3
– Strength Index Reading (3 Year Range):BearishBullishBearish
NET POSITION MOVEMENT INDEX:
– 6-Week Change in Strength Index:-16.216.7-7.5


Euro Currency Futures:

Euro Currency Futures COT ChartThe Euro Currency large speculator standing this week equaled a net position of 65,525 contracts in the data reported through Tuesday. This was a weekly increase of 6,100 contracts from the previous week which had a total of 59,425 net contracts.

This week’s current strength score (the trader positioning range over the past three years, measured from 0 to 100) shows the speculators are currently Bullish with a score of 53.7 percent. The commercials are Bearish with a score of 47.0 percent and the small traders (not shown in chart) are Bullish with a score of 50.5 percent.

Price Trend-Following Model: Strong Uptrend

Our weekly trend-following model classifies the current market price position as: Strong Uptrend.

EURO Currency StatisticsSPECULATORSCOMMERCIALSSMALL TRADERS
– Percent of Open Interest Longs:28.255.812.1
– Percent of Open Interest Shorts:18.570.87.0
– Net Position:65,525-100,31634,791
– Gross Longs:189,796375,75381,743
– Gross Shorts:124,271476,06946,952
– Long to Short Ratio:1.5 to 10.8 to 11.7 to 1
NET POSITION TREND:
– Strength Index Score (3 Year Range Pct):53.747.050.5
– Strength Index Reading (3 Year Range):BullishBearishBullish
NET POSITION MOVEMENT INDEX:
– 6-Week Change in Strength Index:49.5-47.823.0


British Pound Sterling Futures:

British Pound Sterling Futures COT ChartThe British Pound Sterling large speculator standing this week equaled a net position of 44,283 contracts in the data reported through Tuesday. This was a weekly rise of 14,881 contracts from the previous week which had a total of 29,402 net contracts.

This week’s current strength score (the trader positioning range over the past three years, measured from 0 to 100) shows the speculators are currently Bullish with a score of 56.0 percent. The commercials are Bearish with a score of 41.2 percent and the small traders (not shown in chart) are Bullish with a score of 75.6 percent.

Price Trend-Following Model: Strong Uptrend

Our weekly trend-following model classifies the current market price position as: Strong Uptrend.

BRITISH POUND StatisticsSPECULATORSCOMMERCIALSSMALL TRADERS
– Percent of Open Interest Longs:57.025.516.9
– Percent of Open Interest Shorts:33.952.013.5
– Net Position:44,283-50,6826,399
– Gross Longs:109,01648,84332,226
– Gross Shorts:64,73399,52525,827
– Long to Short Ratio:1.7 to 10.5 to 11.2 to 1
NET POSITION TREND:
– Strength Index Score (3 Year Range Pct):56.041.275.6
– Strength Index Reading (3 Year Range):BullishBearishBullish
NET POSITION MOVEMENT INDEX:
– 6-Week Change in Strength Index:21.3-26.741.4


Japanese Yen Futures:

Japanese Yen Forex Futures COT ChartThe Japanese Yen large speculator standing this week equaled a net position of 125,376 contracts in the data reported through Tuesday. This was a weekly rise of 2,412 contracts from the previous week which had a total of 122,964 net contracts.

This week’s current strength score (the trader positioning range over the past three years, measured from 0 to 100) shows the speculators are currently Bullish-Extreme with a score of 97.3 percent. The commercials are Bearish-Extreme with a score of 3.9 percent and the small traders (not shown in chart) are Bullish-Extreme with a score of 86.8 percent.

Price Trend-Following Model: Strong Uptrend

Our weekly trend-following model classifies the current market price position as: Strong Uptrend.

JAPANESE YEN StatisticsSPECULATORSCOMMERCIALSSMALL TRADERS
– Percent of Open Interest Longs:52.830.614.8
– Percent of Open Interest Shorts:11.675.311.4
– Net Position:125,376-135,74010,364
– Gross Longs:160,47492,99944,965
– Gross Shorts:35,098228,73934,601
– Long to Short Ratio:4.6 to 10.4 to 11.3 to 1
NET POSITION TREND:
– Strength Index Score (3 Year Range Pct):97.33.986.8
– Strength Index Reading (3 Year Range):Bullish-ExtremeBearish-ExtremeBullish-Extreme
NET POSITION MOVEMENT INDEX:
– 6-Week Change in Strength Index:22.2-19.7-8.4


Swiss Franc Futures:

Swiss Franc Forex Futures COT ChartThe Swiss Franc large speculator standing this week equaled a net position of -37,593 contracts in the data reported through Tuesday. This was a weekly reduction of -3,218 contracts from the previous week which had a total of -34,375 net contracts.

This week’s current strength score (the trader positioning range over the past three years, measured from 0 to 100) shows the speculators are currently Bearish with a score of 24.7 percent. The commercials are Bullish with a score of 74.6 percent and the small traders (not shown in chart) are Bearish with a score of 42.7 percent.

Price Trend-Following Model: Weak Downtrend

Our weekly trend-following model classifies the current market price position as: Weak Downtrend.

SWISS FRANC StatisticsSPECULATORSCOMMERCIALSSMALL TRADERS
– Percent of Open Interest Longs:4.982.612.3
– Percent of Open Interest Shorts:48.728.822.2
– Net Position:-37,59346,102-8,509
– Gross Longs:4,17870,83010,519
– Gross Shorts:41,77124,72819,028
– Long to Short Ratio:0.1 to 12.9 to 10.6 to 1
NET POSITION TREND:
– Strength Index Score (3 Year Range Pct):24.774.642.7
– Strength Index Reading (3 Year Range):BearishBullishBearish
NET POSITION MOVEMENT INDEX:
– 6-Week Change in Strength Index:2.3-12.527.6


Canadian Dollar Futures:

Canadian Dollar Forex Futures COT ChartThe Canadian Dollar large speculator standing this week equaled a net position of -129,534 contracts in the data reported through Tuesday. This was a weekly gain of 7,048 contracts from the previous week which had a total of -136,582 net contracts.

This week’s current strength score (the trader positioning range over the past three years, measured from 0 to 100) shows the speculators are currently Bearish with a score of 29.9 percent. The commercials are Bullish with a score of 73.8 percent and the small traders (not shown in chart) are Bearish-Extreme with a score of 12.1 percent.

Price Trend-Following Model: Downtrend

Our weekly trend-following model classifies the current market price position as: Downtrend.

CANADIAN DOLLAR StatisticsSPECULATORSCOMMERCIALSSMALL TRADERS
– Percent of Open Interest Longs:6.483.58.8
– Percent of Open Interest Shorts:52.533.612.5
– Net Position:-129,534140,196-10,662
– Gross Longs:17,948234,77424,617
– Gross Shorts:147,48294,57835,279
– Long to Short Ratio:0.1 to 12.5 to 10.7 to 1
NET POSITION TREND:
– Strength Index Score (3 Year Range Pct):29.973.812.1
– Strength Index Reading (3 Year Range):BearishBullishBearish-Extreme
NET POSITION MOVEMENT INDEX:
– 6-Week Change in Strength Index:9.5-9.22.8


Australian Dollar Futures:

Australian Dollar Forex Futures COT ChartThe Australian Dollar large speculator standing this week equaled a net position of -77,446 contracts in the data reported through Tuesday. This was a weekly reduction of -6,997 contracts from the previous week which had a total of -70,449 net contracts.

This week’s current strength score (the trader positioning range over the past three years, measured from 0 to 100) shows the speculators are currently Bearish with a score of 21.3 percent. The commercials are Bullish with a score of 79.0 percent and the small traders (not shown in chart) are Bearish with a score of 36.2 percent.

Price Trend-Following Model: Downtrend

Our weekly trend-following model classifies the current market price position as: Downtrend.

AUSTRALIAN DOLLAR StatisticsSPECULATORSCOMMERCIALSSMALL TRADERS
– Percent of Open Interest Longs:15.666.312.9
– Percent of Open Interest Shorts:58.620.615.7
– Net Position:-77,44682,329-4,883
– Gross Longs:28,124119,38123,317
– Gross Shorts:105,57037,05228,200
– Long to Short Ratio:0.3 to 13.2 to 10.8 to 1
NET POSITION TREND:
– Strength Index Score (3 Year Range Pct):21.379.036.2
– Strength Index Reading (3 Year Range):BearishBullishBearish
NET POSITION MOVEMENT INDEX:
– 6-Week Change in Strength Index:-8.47.1-0.1


New Zealand Dollar Futures:

New Zealand Dollar Forex Futures COT ChartThe New Zealand Dollar large speculator standing this week equaled a net position of -41,567 contracts in the data reported through Tuesday. This was a weekly reduction of -1,123 contracts from the previous week which had a total of -40,444 net contracts.

This week’s current strength score (the trader positioning range over the past three years, measured from 0 to 100) shows the speculators are currently Bearish-Extreme with a score of 16.4 percent. The commercials are Bullish-Extreme with a score of 82.3 percent and the small traders (not shown in chart) are Bearish with a score of 36.9 percent.

Price Trend-Following Model: Weak Downtrend

Our weekly trend-following model classifies the current market price position as: Weak Downtrend.

NEW ZEALAND DOLLAR StatisticsSPECULATORSCOMMERCIALSSMALL TRADERS
– Percent of Open Interest Longs:16.378.55.0
– Percent of Open Interest Shorts:66.926.46.5
– Net Position:-41,56742,865-1,298
– Gross Longs:13,43564,6174,082
– Gross Shorts:55,00221,7525,380
– Long to Short Ratio:0.2 to 13.0 to 10.8 to 1
NET POSITION TREND:
– Strength Index Score (3 Year Range Pct):16.482.336.9
– Strength Index Reading (3 Year Range):Bearish-ExtremeBullish-ExtremeBearish
NET POSITION MOVEMENT INDEX:
– 6-Week Change in Strength Index:9.0-9.69.7


Mexican Peso Futures:

Mexican Peso Futures COT ChartThe Mexican Peso large speculator standing this week equaled a net position of 59,039 contracts in the data reported through Tuesday. This was a weekly increase of 3,087 contracts from the previous week which had a total of 55,952 net contracts.

This week’s current strength score (the trader positioning range over the past three years, measured from 0 to 100) shows the speculators are currently Bullish with a score of 58.9 percent. The commercials are Bearish with a score of 44.0 percent and the small traders (not shown in chart) are Bearish with a score of 20.8 percent.

Price Trend-Following Model: Uptrend

Our weekly trend-following model classifies the current market price position as: Uptrend.

MEXICAN PESO StatisticsSPECULATORSCOMMERCIALSSMALL TRADERS
– Percent of Open Interest Longs:65.128.03.2
– Percent of Open Interest Shorts:22.170.73.4
– Net Position:59,039-58,694-345
– Gross Longs:89,47738,5564,376
– Gross Shorts:30,43897,2504,721
– Long to Short Ratio:2.9 to 10.4 to 10.9 to 1
NET POSITION TREND:
– Strength Index Score (3 Year Range Pct):58.944.020.8
– Strength Index Reading (3 Year Range):BullishBearishBearish
NET POSITION MOVEMENT INDEX:
– 6-Week Change in Strength Index:22.0-23.312.4


Brazilian Real Futures:

Brazil Real Futures COT ChartThe Brazilian Real large speculator standing this week equaled a net position of 40,349 contracts in the data reported through Tuesday. This was a weekly decrease of -372 contracts from the previous week which had a total of 40,721 net contracts.

This week’s current strength score (the trader positioning range over the past three years, measured from 0 to 100) shows the speculators are currently Bullish-Extreme with a score of 90.6 percent. The commercials are Bearish-Extreme with a score of 9.0 percent and the small traders (not shown in chart) are Bearish with a score of 33.3 percent.

Price Trend-Following Model: Strong Uptrend

Our weekly trend-following model classifies the current market price position as: Strong Uptrend.

BRAZIL REAL StatisticsSPECULATORSCOMMERCIALSSMALL TRADERS
– Percent of Open Interest Longs:64.227.03.3
– Percent of Open Interest Shorts:27.266.01.2
– Net Position:40,349-42,5532,204
– Gross Longs:70,03029,4113,556
– Gross Shorts:29,68171,9641,352
– Long to Short Ratio:2.4 to 10.4 to 12.6 to 1
NET POSITION TREND:
– Strength Index Score (3 Year Range Pct):90.69.033.3
– Strength Index Reading (3 Year Range):Bullish-ExtremeBearish-ExtremeBearish
NET POSITION MOVEMENT INDEX:
– 6-Week Change in Strength Index:37.4-38.710.4


Bitcoin Futures:

Bitcoin Crypto Futures COT ChartThe Bitcoin large speculator standing this week equaled a net position of 1,179 contracts in the data reported through Tuesday. This was a weekly reduction of -662 contracts from the previous week which had a total of 1,841 net contracts.

This week’s current strength score (the trader positioning range over the past three years, measured from 0 to 100) shows the speculators are currently Bullish with a score of 77.0 percent. The commercials are Bearish with a score of 34.7 percent and the small traders (not shown in chart) are Bearish-Extreme with a score of 13.8 percent.

Price Trend-Following Model: Strong Downtrend

Our weekly trend-following model classifies the current market price position as: Strong Downtrend.

BITCOIN StatisticsSPECULATORSCOMMERCIALSSMALL TRADERS
– Percent of Open Interest Longs:84.03.34.2
– Percent of Open Interest Shorts:79.97.24.3
– Net Position:1,179-1,150-29
– Gross Longs:24,3769451,207
– Gross Shorts:23,1972,0951,236
– Long to Short Ratio:1.1 to 10.5 to 11.0 to 1
NET POSITION TREND:
– Strength Index Score (3 Year Range Pct):77.034.713.8
– Strength Index Reading (3 Year Range):BullishBearishBearish-Extreme
NET POSITION MOVEMENT INDEX:
– 6-Week Change in Strength Index:33.7-36.3-6.2


Article By InvestMacroReceive our weekly COT Newsletter

*COT Report: The COT data, released weekly to the public each Friday, is updated through the most recent Tuesday (data is 3 days old) and shows a quick view of how large speculators or non-commercials (for-profit traders) were positioned in the futures markets.

The CFTC categorizes trader positions according to commercial hedgers (traders who use futures contracts for hedging as part of the business), non-commercials (large traders who speculate to realize trading profits) and nonreportable traders (usually small traders/speculators) as well as their open interest (contracts open in the market at time of reporting). See CFTC criteria here.

Speculator Extremes: Yen, Live Cattle, Steel & Silver lead weekly Positions

By InvestMacro 

The latest update for the weekly Commitment of Traders (COT) report was released by the Commodity Futures Trading Commission (CFTC) on Friday for data ending on March 25th.

This weekly Extreme Positions report highlights the Most Bullish and Most Bearish Positions for the speculator category. Extreme positioning in these markets can foreshadow strong moves in the underlying market.

To signify an extreme position, we use the Strength Index (also known as the COT Index) of each instrument, a common method of measuring COT data. The Strength Index is simply a comparison of current trader positions against the range of positions over the previous 3 years. We use over 80 percent as extremely bullish and under 20 percent as extremely bearish. (Compare Strength Index scores across all markets in the data table or cot leaders table)


Here Are This Week’s Most Bullish Speculator Positions:

Japanese Yen


The Japanese Yen speculator position continues to be at the top of the extremes list and comes in as the most bullish extreme standing this week. The Japanese Yen speculator level is currently at a 97.3 percent score of its 3-year range.

The six-week trend for the percent strength score totaled 22.2 this week. The overall net speculator position was a total of 125,376 net contracts (just below the recent record high) this week with a bump up by 2,412 contract in the weekly speculator bets.


Speculators or Non-Commercials Notes:

Speculators, classified as non-commercial traders by the CFTC, are made up of large commodity funds, hedge funds and other significant for-profit participants. The Specs are generally regarded as trend-followers in their behavior towards price action – net speculator bets and prices tend to go in the same directions. These traders often look to buy when prices are rising and sell when prices are falling. To illustrate this point, many times speculator contracts can be found at their most extremes (bullish or bearish) when prices are also close to their highest or lowest levels.

These extreme levels can be dangerous for the large speculators as the trade is most crowded, there is less trading ammunition still sitting on the sidelines to push the trend further and prices have moved a significant distance. When the trend becomes exhausted, some speculators take profits while others look to also exit positions when prices fail to continue in the same direction. This process usually plays out over many months to years and can ultimately create a reverse effect where prices start to fall and speculators start a process of selling when prices are falling.


Live Cattle


The Live Cattle speculator position comes next in the extreme standings this week. The Live Cattle speculator level is now at a 94.9 percent score of its 3-year range.

The six-week trend for the percent strength score was 4.4 this week. The speculator position registered 117,987 net contracts this week with a weekly gain of 14,562 contracts in speculator bets.


Steel


The Steel speculator position comes in third this week in the extreme standings. The Steel speculator level resides at a 93.9 percent score of its 3-year range.

The six-week trend for the speculator strength score came in at 4.2 this week. The overall speculator position was 3,771 net contracts this week with a dip by -635 contracts in the weekly speculator bets.


Silver


The Silver speculator position comes up number four in the extreme standings this week. The Silver speculator level is at a 93.2 percent score of its 3-year range.

The six-week trend for the speculator strength score totaled a change of 14.2 this week. The overall speculator position was 60,950 net contracts this week with a small decline of -1,348 contracts in the speculator bets.


Brazil Real


The Brazil Real speculator position rounds out the top five in this week’s bullish extreme standings. The Brazil Real speculator level sits at a 90.6 percent score of its 3-year range. The six-week trend for the speculator strength score was 37.4 this week.

The speculator position was 40,349 net contracts this week with an edge lower by -372 contracts in the weekly speculator bets.


This Week’s Most Bearish Speculator Positions:

5-Year Bond


The 5-Year Bond speculator position comes in as the most bearish extreme standing this week. The 5-Year Bond speculator level is at just a 4.4 percent score of its 3-year range.

The six-week trend for the speculator strength score was -2.0 this week. The overall speculator position was -1,900,087 net contracts this week with a small gain of 5,853 contracts in the speculator bets.


Cotton


The Cotton speculator position comes in next for the most bearish extreme standing on the week. The Cotton speculator level is at a 4.9 percent score of its 3-year range.

The six-week trend for the speculator strength score was -7.0 this week. The speculator position was -54,006 net contracts this week with a decrease of -4,702 contracts in the weekly speculator bets.


Soybean Meal


The Soybean Meal speculator position comes in as third most bearish extreme standing of the week. The Soybean Meal speculator level resides at a 7.2 percent score of its 3-year range.

The six-week trend for the speculator strength score was -14.5 this week. The overall speculator position was -49,278 net contracts this week with a drop by -17,071 contracts in the speculator bets.


Wheat


The Wheat speculator position comes in as this week’s fourth most bearish extreme standing. The Wheat speculator level is at a 11.6 percent score of its 3-year range.

The six-week trend for the speculator strength score was -21.1 this week. The speculator position was -82,548 net contracts this week with a reduction of -6,069 contracts in the weekly speculator bets.


New Zealand Dollar


Finally, the New Zealand Dollar speculator position comes in as the fifth most bearish extreme standing for this week. The New Zealand Dollar speculator level is at a 16.4 percent score of its 3-year range.

The six-week trend for the speculator strength score was 9.0 this week. The speculator position was -41,567 net contracts this week with a decline by -1,123 contracts in the weekly speculator bets.


Article By InvestMacroReceive our weekly COT Newsletter

*COT Report: The COT data, released weekly to the public each Friday, is updated through the most recent Tuesday (data is 3 days old) and shows a quick view of how large speculators or non-commercials (for-profit traders) were positioned in the futures markets.

The CFTC categorizes trader positions according to commercial hedgers (traders who use futures contracts for hedging as part of the business), non-commercials (large traders who speculate to realize trading profits) and nonreportable traders (usually small traders/speculators) as well as their open interest (contracts open in the market at time of reporting). See CFTC criteria here.

 

High soybean prices in Zambia and Malawi may make chicken costly too: lack of competition is to blame

By Arthur Khomotso Mahuma, University of Johannesburg and Namhla Landani, University of Johannesburg 

Poultry is one of the cheapest protein sources for the growing population of the east and southern Africa region. That makes soybeans critical to food security in the region, as they are an important input in chicken feed.

Soybean pricing and production dynamics have been challenging for Zambia and Malawi, threatening poultry production in the region.

Poultry feed makes up 60%-70% of the total cost of poultry production. Soybean prices directly affect the affordability of poultry and the ability of producers to be competitive. Small-scale independent poultry producers in particular have a hard time because they buy feed from the open market and are too small to determine prices. Large producers source feed from their own operations and determine soybean prices.

Figure 1: From soybeans to poultry

Source: Authors compilation

Zambia and Malawi are the key soybean producers in east and southern Africa. Both countries were hit hard in 2024 by climate change related weather and by the behaviour of players in the soybean market, including processors and traders.

Zambia’s soybean production fell by 74% because of poor rains and also because of farmers being squeezed. Large buyers had negotiated very low prices in previous years, so farmers planted less.

Malawi’s production also fell (20%), but much less than Zambia’s. Yet the surge in soybean prices in Malawi by 48% between May 2024 and November 2024 was out of proportion with the drop in production, and even surpassed Zambian prices (Figure 2). Malawian prices were the highest in the region, even though it produced enough to export.

We are economists at the African Market Observatory, which monitors prices of staple foods and conducts research on market dynamics. We analyse market concentration and barriers to entry, within and across countries in east and southern Africa, and we do in-depth field work.

Our work shows that competition issues, such as the ability of large buyers to influence prices and high margins, are at the heart of the surge in prices and low production in Malawi and Zambia. The climate-related weather effects are an additional factor.

Figure 2: Soybean prices in Zambia, Malawi and South Africa (benchmark) (3-month moving averages)

Market outcomes

In Zambia, dominant buyers of soybean offered farmers very low prices during the 2023 season – well below US$400/t and the South African benchmark (Figure 2). This meant that farmers planted less than half the 2023 crop in the 2024 season.

Crops were also affected by poor rainfall. Malawi’s 2024 production fell by 20% because of the worst drought in 100 years. The drop in production was lower than expected, demonstrating that farmers can adapt to weather changes. Prices still rose, however, driven by the highly concentrated soybean trading and processing market.

Cheapest source of proteins

Poultry is one of the cheapest sources of protein and has one of the lowest environmental impacts. It is essential that the value chain works well from feed to chicken rearing and becomes more resilient to extreme weather events.

The experience of 2024 shows what can go wrong.

Poultry demand in sub-Saharan Africa is expected to grow more than fourfold by 2050. Producers will need affordable feed.

Among them are many small-scale independent producers who rely on competitive markets for their inputs. Yet we found that with the escalating soybean and feed prices in Malawi from late 2021, and higher prices for day-old chicks, small independent producers had negative margins, meaning they made a loss in the second half of 2021. High feed prices undermine the competitiveness of Malawi’s poultry industry.

Aside from South Africa (which relies on genetically modified soybean), Zambia and Malawi have been the largest producers in the region. These countries have been exporting around half of their production (including soycake) to neighbouring countries with larger populations such as Tanzania and Kenya.

Zambia’s production plummet

Between 2020 and 2023, Zambia’s soybean production grew from 297,000 tonnes to 650,000 tonnes (Figure 3). In 2024, its production collapsed by 74% to 170,000 tonnes. This sharp decline was primarily due to farmers opting to plant less soybean because of the low prices offered from processors in 2023 (Figure 2). Farmers bought 50% less soybean seed for the 2024 season than the 2023 season.

Figure 3: Soybean production in Zambia and Malawi

With limited storage facilities available for farmers in most countries in the region, including Zambia, farmers typically have to sell to traders and processors shortly after harvest.

In Zambia, soybeans are produced by many small farmers, so they compete to sell their crop to a few main processors in a concentrated market. As a result, these processors have greater power to influence the terms of trade, such as price. This was especially evident in 2023 when processors offered farmers lower prices (Figure 2).

Poor rainfall linked to the 2023/24 El Niño phase of the El Niño Southern Oscillation, which is the warming of the central to eastern tropical Pacific Ocean, causing drought in southern Africa while inducing heavy rainfalls and floods in eastern Africa, did have an impact across southern Africa, including Malawi and Zambia. While Kenya, Uganda and Tanzania recorded above average rainfall, their soybean output is low.

Resilience to climate change impacts requires deepening and diversifying agriculture production across countries and regional trade to meet demand.

Soybean prices in Malawi remain high but Zambia’s prices stabilise

Malawi’s prices increased rapidly to over US$700/tonne in June 2024, surpassing Zambia’s, and continued to rise to almost $900/tonne at the end of the year, far above other countries in the region. The reason couldn’t be reduced production from poor rainfall, because production still exceeded local demand. This happened even as the Malawi government put export restrictions on soybeans (but not soymeal). The price surge raises competition concerns in Malawi, where trading and processing is highly concentrated. In theory, highly concentrated markets are characterised by high prices, due to a lack of price competition.

By comparison, Zambia’s prices moderated because of imports. In addition, the low soybean prices offered to farmers in 2023 also meant that processors had crushed surplus soybeans, thereby building up soymeal stock. This reduced the demand for soybeans, as did power cuts in Zambia, which limited crushers’ operations.

Urgent next steps

Soybean developments over 2024 show the need to consider how competition issues within and across borders can undermine the resilience of regional food markets and hinder the ability of small producers to compete. Zambia is currently conducting a commercial poultry market inquiry. But a regional approach in monitoring markets and tackling anti-competitive conduct is necessary to support poultry production.The Conversation

About the Authors:

Arthur Khomotso Mahuma, Economist and Researcher at the Centre for Competition, Regulation and Economic Development, University of Johannesburg and Namhla Landani, Economist at the Centre for Competition, Regulation and Economic Development, University of Johannesburg

This article is republished from The Conversation under a Creative Commons license. Read the original article.


Week Ahead: EURUSD braces for Trump tariffs, EU inflation, US jobs report

By ForexTime 

  • EURUSD up over 4% so far in March 2025; set for biggest monthly gain since Nov. 2022
  • Apr 1: Eurozone’s March CPI could offer mixed readings for EURUSD
  • Apr 2: Trump’s “Liberation Day” tariffs could hurt US economy and USD
  • Apr 4: US NFP report, Chair Powell’s speech may offer clues on next Fed rate cut
  • Bloomberg FX model: 73.7% chance EURUSD trades between 1.0650 – 1.0934 next week


The world’s most-traded FX pair is set for its biggest monthly gain in over 2 years!

At the time of writing, EURUSD is up about 4.08% so far in March 2025.

If it holds around these levels, that would the EURUSD’s biggest 1-month gain since the 5.3% advance in November 2022.

Why did EURUSD rise in March 2025?

Two main reasons:

1) Weaker USD: Markets are worried that President Trump’s tariffs would actually hurt US economic growth. 

Against such a dimmer outlook, the US dollar has weakened against almost all of its G10 peers (except against the Japanese Yen) in March 2025.


2) Historic change to Germany government spending: Earlier this month, Europe’s largest economy amended its constitution to get rid of its so-called “debt brake”. 

This “historic” decision is set to unleash hundreds of billions of euros on defense and infrastructure spending.

With more government spending for Europe’s largest economy, that has sweetened the Eurozone’s economic outlook, hence the strengthening euro.

NOTE: The euro has also strengthened against almost all its G10 peers (except the Swedish Krona and the Norwegian Krone) so far in March 2025.

Imagen
EUR strengthened against most G10 peers in March 2025


With all that in mind …

Can EURUSD extend its month-to-date (March 2025) gains into Q2 2025?

This question will be especially pertinent as we enter a week filled with these major events on the global economic calendar:

Sunday, March 30

  • Europe, UK goes into Daylight Savings Time

Monday, March 31

  • JPY: Japan February industrial production, retail sales
  • AU200 index: March Melbourne institute inflation
  • CNH: China March PMIs
  • THB: Thailand February external trade
  • GER40 index: Germany March CPI; February retail sales

Tuesday, April 1

  • JP225 index: Japan February jobless rate; 1Q Tankan index
  • AUD: RBA rate decision; February retail sales
  • CN50 index: China March manufacturing PMI
  • EUR: Eurozone March CPI; February unemployment
  • US30 index: US March ISM manufacturing

Wednesday, April 2

  • USDInd: Trump’s “Liberation Day” – more US tariffs incoming?

Thursday, April 3

  • AUD: Australia February trade balance
  • CN50 index: China March services PMI
  • EU50 index: Eurozone February PPI; ECB meeting minutes
  • RUS2000 index: US initial weekly jobless claims; ISM services index; speech by Fed Vice Chair Philip Jefferson
  • US500 index: 25% US tariffs on auto imports kick in

Friday, April 4

  • SG20 index: Singapore February retail sales
  • GER40 index: Germany March construction PMI; February factory orders
  • CAD: Canada March unemployment rate
  • US500 index: US March nonfarm payrolls
  • USDInd: Speech by Fed Chair Jerome Powell


From the list above, we highlight 4 specific events that could trigger massive reactions in the world’s most-traded FX pair:

  • Tuesday, April 1st: Eurozone March consumer price index (CPI)

Here’s what economists predict for this important set of inflation data:

  • Headline CPI year-on-year (March 2025 vs. March 2024): 2.3%
    If so, this would match February’s 2.3% year-on-year figure.

  • Headline CPI month-on-month (March 2025 vs. February 2025): 0.6%
    If so, this would be notably higher than February’s 0.4% month-on-month figure.
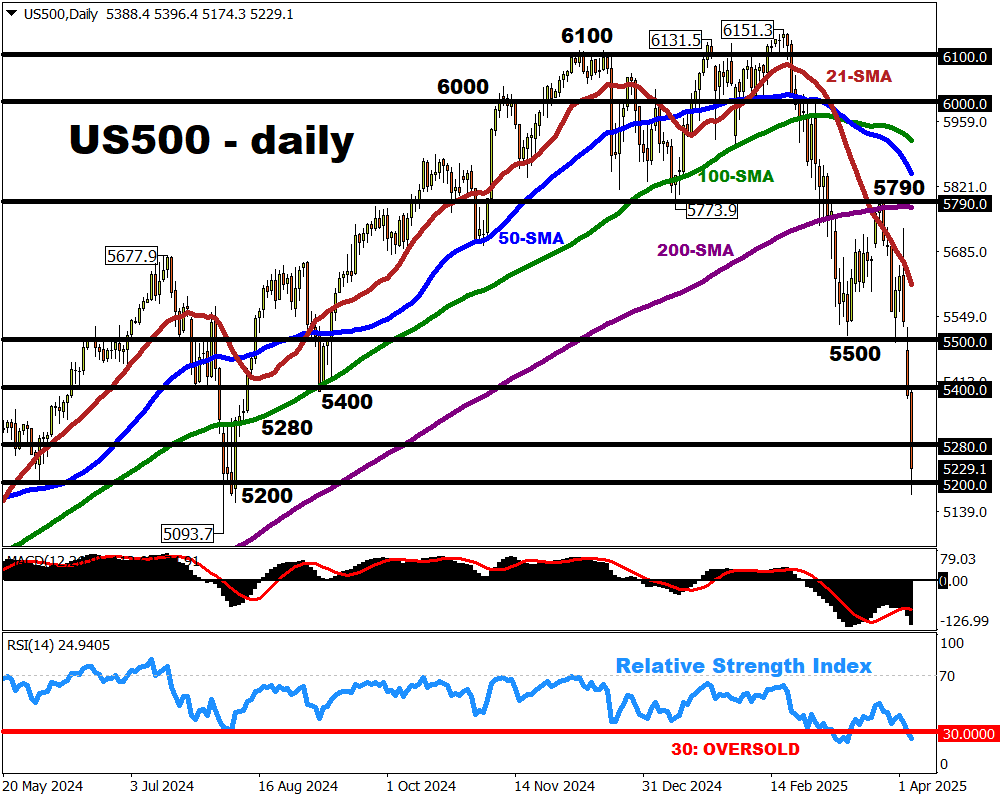
  • Core CPI (excluding food and energy prices) year-on-year: 2.5%
    If so, this would be a slight easing from February’s 2.6% core year-on-year figure.

Lower-than-expected CPI prints which encourages more rate cuts by the European Central Bank (ECB) could weaken EURUSD.


  • Wednesday, April 2nd: “Liberation Day” – more US tariffs?

April 2nd is the deadline for when US President Donald Trump intends to roll out “reciprocal” tariffs, which suggests an “eye-for-an-eye” approach.

This essentially points to the raising of US tariffs to fix trade imbalances against its major trading partners, including the Eurozone.

Markets initially believed that these “reciprocal tariffs” would actually slow down US economic growth, hence the US dollar’s steep drop in early March.

More recently, markets hope that Trump’s next tariff salvo may not be as damaging as initially feared.  Hence, the euro has weakened against the US dollar in 7 out of the past 8 daily trading sessions.

There is still much uncertainty about what this major tariff announcement will look like, with markets largely adopting a “wait and see mode”.

Ultimately, if the market’s worst-case-scenario is confirmed, that could further dent the US dollar while adding to EURUSD’s gains from March 2025.


  • Friday, April 4th: US March nonfarm payrolls (NFP)

Here’s what economists predict for this closely-watched jobs report:

  • Headline NFP figure: 135,000 (new jobs added to US labour market)

If so, this would be lower than February’s 151,000 headline NFP figure.

  • Unemployment rate: 4.1%

If so, this would match February’s unemployment rate

  • Average hourly earnings month-on-month (March 2025 vs. Feb 2025): 0.3%

If so, this would match February’s figure.

Stronger-than-expected US jobs data, which points to resilience in the world’s largest economy, should bolster the US dollar and drag EURUSD lower.


  • Friday, April 4th: Speech by Fed Chair Jerome Powell

Just 3 hours after the US jobs report’s release, the Chair of the Federal Reserve – the US central bak – is set to share his economic outlook.

Markets will be eager to find out his take not just on the latest NFP numbers, but also what President Trump’s tariff announcements earlier in the week would mean for the resilience of the US economy.

A weakening US jobs market that faces more damage from tariffs could prompt the Fed to cut rates sooner than expected – a weaker USD scenario.

At the time of writing, markets are forecasting a:

  • 54% chance (almost evenly split) that the Fed will cut its benchmark rates by another 75-basis points (3 more rate cuts, 25-bps per FOMC meeting) by end-2025.
  • 70% chance that the next Fed rate cut will happen at the June FOMC meeting.


Looking at the charts …

At the time of writing, EURUSD is trading just below the big, round 1.08000 number, around its 21-day simple moving average (SMA).

Note also that EURUSD earlier this week found crucial support at its 200-day SMA.

Imagen
EURUSD in "wait and see" mode around 1.080 ahead of more US tariffs


Bloomberg’s FX model currently predicts a 74% chance that EURUSD will trade between 1.0650 – 1.0934 over the coming week.


Potential Scenarios:

  • EURUSD could weaken below its 200-day SMA and towards 1.0650 if we see:

    – weaker-than-expected Eurozone CPI which paves way for ECB rate cuts

    – more US trade tariffs on EU, but not as damaging on the US economy

    stronger-than-expected US jobs report and a hawkish Chair Powell that pushes back on the next Fed rate cut


  • EURUSD could revisit its latest cycle high around 1.094 or above if we see:

    stronger-than-expected Eurozone CPI which delays ECB rate cuts

    – reciprocal US trade tariffs that confirm market’s worst-case fears by hurting the US economy and dollar

    weaker-than-expected US jobs report and a dovish Chair Powell that opens the door for a sooner-than-June Fed rate cut


Forex-Time-LogoArticle by ForexTime

ForexTime Ltd (FXTM) is an award winning international online forex broker regulated by CySEC 185/12 www.forextime.com