Archive for Opinions – Page 31

Why predicting battery performance is like forecasting traffic − and how researchers are making progress

By Emmanuel Olugbade, Missouri University of Science and Technology 

Lithium-ion batteries are quietly powering large parts of the world, including electric vehicles and smartphones. They have revolutionized how people store and use energy. But as these batteries become more central to daily life, they bring more attention to the challenges of managing them and the energy they store safely, efficiently and intelligently.

I’m a mechanical engineer who studies these nearly ubiquitous batteries. They have been around for decades, yet researchers like me are still trying to fully understand how these batteries behave – especially when they are working hard.

Batteries may seem simple, but they are as complicated as the real-world uses people devise for them.

The big picture

At their core, lithium-ion batteries rely on the movement of charged particles, called ions, of the element lithium between two electric poles, or electrodes. The lithium ions move from the positive electrode to the negative one through a conductive substance called an electrolyte, which can be a solid or a liquid.

The basics of how a lithium-ion battery works.

How much energy these batteries store and how well they work depends on a tangle of factors, including the temperature, physical structure of the battery and how the materials age over time.

Around the world, researchers are trying to answer questions about each of these factors individually and in concert with each other. Some research focuses on improving lifespan and calculating how batteries degrade over time. Other projects are tackling safety under extreme conditions, such as fast-charging use in extreme climates – either hot or cold. Many are exploring entirely new materials that could make batteries cheaper, longer-lasting or safer. And a significant group – including me – are working with computer simulations to improve real-time battery monitoring.

Real‑time monitoring in your electric vehicle’s battery system functions like a health check: It tracks voltage, current and temperature to estimate how much energy remains so you won’t be stranded with a dead battery.

But it’s difficult to precisely measure how well each of the energy cells within the battery is performing as they age or as the weather changes from cold in winter to hotter in summer. So the battery management system uses a computer simulation to estimate those factors. When combined with real-time monitoring, the system can prevent overusing the battery, balance charging speed with long-term health, avoid power failures and keep performance high. But there are a lot of variables.

The traffic analogy

One of the best ways to understand this challenge is to think about city traffic.

Let’s say you want to drive across town and need to determine whether your car has enough charge to travel the best route. If your navigation simulator accounted for every stoplight, every construction zone and every vehicle on the road, it would give you a very accurate answer. But it might take an hour to run, by which time the circumstances would have changed and the answer would likely be wrong. That’s not helpful if you’re trying to make a decision right now.

A simpler model might assume that every road is clear and every car is moving at the speed limit. That simulation delivers a result instantly – but its results are very inaccurate when traffic is heavy or a road is closed. It doesn’t capture the reality of rush hour.

While you’re driving, the battery management system would do a similar set of calculations to see how much charge is available for the rest of the trip. It would look at the battery’s temperature, how old it is and how much energy the car is asking for, like when going up a steep hill or accelerating quickly to keep up with other cars. But like the navigation simulations, it has to strike a balance between being extremely accurate and giving you useful information before your battery runs out in the middle of your trip.

The most accurate models, which simulate every chemical reaction inside the battery, are too slow for real-time use. The faster models simplify things so much that they miss key behaviors – especially under stress, such as fast charging or sudden bursts of energy use.

How researchers are bridging the gap

This trade-off between speed and accuracy is at the heart of battery modeling research today. Scientists and engineers are exploring many ways to solve it.

Some are rewriting modeling software to make the physics calculations more efficient, reducing complexity without losing the key details. Others, like me, are turning to machine learning – training computers to recognize patterns in data and make fast, accurate predictions without having to solve every underlying equation.

In my recent work, I used a high-accuracy battery simulator – one of the ones that’s really accurate but very slow – to generate a massive amount of data about how a battery functions when charging and discharging. I used that data to train a machine learning algorithm called XGBoost, which is particularly good at finding patterns in data.

Then I used software to pair the XGBoost system with a simple, fast-running battery model that captures the basic physics but can miss finer details. The simpler model puts out an initial set of results, and the XGBoost element fine-tunes those to make corrections on the fly, especially when the battery is under strain.

The result is a hybrid model that is able to respond both quickly and accurately to changes in driving conditions. A driver who floors the accelerator with just the simple model wouldn’t get enough energy; a more detailed model would give the right amount of energy only after it finished all its calculations. My hybrid model delivers a rapid boost of energy without delays.

Other teams are working on similar hybrid approaches, blending physics and artificial intelligence in creative ways. Some are even building digital twinsreal-time virtual replicas of physical batteries – to offer sophisticated simulations that update constantly as conditions change.

What’s next

Battery research is moving quickly, and the field is already seeing signs of change. Models are becoming more reliable across a wider range of conditions. Engineers are using real-time monitoring to extend battery life, prevent overheating and improve energy efficiency. Machine learning lets researchers train battery management systems to optimize performance for specific applications, such as high power demands in electric vehicles, daily cycles of home electricity use, short power bursts for drones, or long-duration requirements for building-scale battery systems.

And there’s more to come: Researchers are working to include other important factors into their battery models, such as heat generation and mechanical stress.

Some teams are taking hybrid models and compiling their software into lightweight code that runs on microcontrollers inside battery hardware. In practice, that means each battery pack carries its own brain on-board, calculating state-of-charge, estimating aging and tracking thermal or mechanical stress in near-real time. By embedding the model in the device’s electronics, the pack can autonomously adjust its charging and discharging strategy on the fly, making every battery smarter, safer and more efficient.

As the energy landscape evolves – with more electric vehicles on the road, more renewable energy sources feeding into the grid, and more people relying on batteries in daily life – the ability to understand what a battery is doing in real time becomes more critical than ever.The Conversation

About the Author:

Emmanuel Olugbade, Ph.D. Candidate in Mechanical Engineering, Missouri University of Science and Technology

This article is republished from The Conversation under a Creative Commons license. Read the original article.


Tourists are cancelling trips to the US – here’s how this could affect its economy

By Ross Bennett-Cook, Leeds Beckett University 

The United States is one of the top three most visited countries in the world. The big draw cards – cities such as San Francisco, New York and Chicago and national parks such as Yosemite – have attracted international tourists for decades. This combined with its role as a global business powerhouse meant it had 66.5 million visitors in 2023 – and the 2024 figure is expected to be higher still.

But a lot has changed in recent months, and 2025’s figures may not be as strong. The 2024 reelection of Donald Trump as the president of the United States and the consequential changes in foreign diplomacy and relations, alongside internal cultural shifts, are starting to change global attitudes towards the US – attitudes that appear to be affecting tourists’ desire to visit the US.

In a recent report by research firm Tourism Economics, inbound travel to the US is now projected to decline by 5.5% this year, instead of growing by nearly 9% as had previously been forecast. A further escalation in tariff and trade wars could result in further reductions in international tourism, which could amount to a US$18 billion (£13.8 billion) annual reduction in tourist spending in 2025.

There is already some evidence of travel cancellations. Since Trump announced 25% tariffs on many Canadian goods, the number of Canadians driving across the border at some crossings has fallen by up to 45%, on some days, when compared to last year. Canada is the biggest source of international tourists to the US. Air Canada has announced it is reducing flights to some US holiday destinations, including Las Vegas, from March, as demand reduces.

According to a March poll by Canadian market researcher Leger, 36% of Canadians who had planned trips to the United States had already cancelled them. According to data from the aviation analytics company OAG, passenger bookings on Canada to US routes are down by over 70% compared to the same period last year. This comes after the U.S. Travel Association warned that even a 10% reduction in Canadian inbound travel could result in a US$2.1 billion (£1.6 billion) loss in spending, putting 140,000 hospitality jobs at risk.

An unwelcoming environment?

Some would-be visitors have cited an unwelcoming political climate as part of a concern about visiting the US – including angry rhetoric about foreigners, migrants and the LGBTQ+ community. The Tourism Economics report also cited “polarizing Trump Administration policies and rhetoric” as a factor in travel cancellations.

There are other factors that may influence travellers from, for instance, western Europe, which represented 37% of overseas travel to the US last year. These include US tariffs pushing prices up at home and the US administration’s perceived alignment with Russia in the war in Ukraine.

Canadian trips to the US are going down.

Research by YouGov in March found that western European attitudes towards the US have become more negative since Trump’s reelection last November. More than half of people in Britain (53%), Germany (56%), Sweden (63%) and Denmark (74%) now have an unfavourable opinion of the US. In five of the seven countries polled, figures for US favourability are at the lowest since polling began in November 2016.

Border issues

Some high-profile cases at the US border could also be putting off tourists. In March, a British woman was handcuffed and detained for more than ten days by US Customs Enforcement after a visa problem. In the same month, a Canadian tourist was detained after attempting to renew her visa at the US-Mexico border. During the 12-day detention, she was held in crowded jail cells and even put in chains.

Mexico is the US’s second largest inbound travel market. Tourism Economics suggests that issues around new border enforcement rules will raise concerns with potential Mexican tourists. During Trump’s first term in office, Mexican visits to the US fell by 3%. In February this year, air travel from Mexico had already fallen 6% when compared to 2024.

Many countries including Canada have been updating their travel advice for the US. For instance, on March 15 the UK Foreign and Commonwealth Office updated its advice for the US, warning visitors that “you may be liable to arrest or detention if you break the rules”. The previous version of advice, from February, had no mention of arrest or detention. Germany has made similar updates to its travel advisory, after several Germans were recently detained for weeks by US border officials.

Multiple European countries, including France, Germany, Denmark and Norway have also issued specific travel warnings to transgender and non-binary citizens, as US authorities demand tourists declare their biological sex at birth on visa applications. This comes as the US has stopped issuing of passports with a X marker – commonly used by those identifying as non-binary – for its own citizens.

Alternative destinations

As thousands of travellers cancel their trips to the US, other destinations are seeing a spike in interest. Hotels in Bermuda have reported a surge in enquiries as Canadians relocate business and leisure trips away from the US, with some predicting a 20% increase in revenue from Canadian visits.

Europe too has reported increased bookings from Canada, with rental properties experiencing a 32% jump in summer reservations when compared to last year, according to some reports.

There are already growing concerns that visa and entry restrictions will disrupt fans and athletes from enjoying 2026 men’s Fifa World Cup, held on sites in the US, Canada and Mexico. Visitors from some countries, such as Brazil, Turkey and Colombia, could wait up to 700 days to obtain visas. The International Olympic Committee has also raised concerns over the 2028 Olympics Games in Los Angeles, although US officials have insisted that “America will be open”.

With mounting visa delays, stricter border enforcement and growing concerns over human rights and anti-minority rhetoric, the United States risks losing its appeal as a top holiday destination. The long-term impact on its tourism industry may prove difficult to reverse.The Conversation

About the Author:

Ross Bennett-Cook, PhD Researcher, Carnegie School of Sport, Leeds Beckett University

This article is republished from The Conversation under a Creative Commons license. Read the original article.


IMF World Economic Outlook: economic uncertainty is now higher than it ever was during COVID

By Sergi Basco, Universitat de Barcelona 

The International Monetary Fund (IMF) has just published its World Economic Outlook, and it does not take an expert to deduce that, even among some of the world’s top economic minds, confident predictions are currently hard to come by.

Every spring the IMF and World Bank hold their Spring Meetings in Washington DC: a week of seminars, briefings and press conferences focusing on the global economy, international development and world financial markets. At both the Spring Meetings and the Annual Meeting, held each autumn, the IMF publishes its global economic growth forecasts.

For its 2025 Spring Meeting the IMF has published a baseline forecast, as well as an addendum analysing the tariff events that took place between 9 and 14 April. According to the Fund’s report, world GDP will grow by 2.8% in 2025 and 3.0% in 2026. For the euro area, growth will be 0.8% and 1.2% for 2025 and 2026 respectively.

These forecasts represent a substantial downward revision from IMF figures published just three months ago. Globally, growth in 2025 is down by 0.5% compared to the Fund’s January update, with a reduction of 0.2% for the euro area.

One major shift is key to understanding the most recent IMF report and its pessimistic predictions: we live in a much more uncertain world than we did three months ago.

Trump, tariffs and uncertainty

If one had to sum up the new US tariff policy in a word, “unpredictable” would suffice, as the so-called “Liberation Day” of 2 April 2025 represented the largest tariff increase in modern history.

Just one week later, the US president then made two further announcements. First, a 90-day freeze on tariff hikes, apparently in search of bilateral agreements with the countries to which he had applied tariffs above 10%. Second, that China would be excluded from this exception, with tariffs on its products being raised to 145%.

This freeze means that until July EU goods being sold to the US will have a 10% tariff instead of the 20% that was announced on 2 April. However, the 10% applied by the new US administration is still much higher than the average tariff of 1.34% that was in force before 5 April.

But what will the tariff be after these 90 days? What about in December? What about in 2 years’ time? What goods will be exempted? How far will the trade war between China and the US go? The answer to all of these questions is: nobody knows. This uncertainty is evident in of the IMF’s spring forecast.

Uncertainty is off the charts

The IMF’s world trade uncertainty index is currently 7 times higher than it was in October 2024, much higher than in the pandemic.

As far as the economy is concerned, this uncertainty is far worse than a high but definitive tariff. With a tariff, companies can at least reorganise their production chain, and consumers can look for alternative products. There is a cost, but at least businesses and consumers can plan for it.

However, nobody can calculate these costs today because nobody knows how tariffs will evolve. An American company may decide today to buy a particular product from the EU thinking that the tariff will be 10%, but upon the product’s arrival in the US it turns out the tariff has risen to 100% because a presidential advisor said it would be good for the US economy to raise tariffs on that product.

Unbelievable though it may sound, this appears to be how the tariffs are being decided and enacted. According to one account, the US Treasury and Commerce Secretaries were only able to persuade Trump to freeze recent tariff hikes because Peter Navarro – the president’s economic advisor and tariff ideologue – was in another room at the time.

The end result of this unpredictability is that the best course of action, for consumers and businesses alike, is inaction.

Fear and volatility

It is no surprise that these constant changes of plans are causing great instability in financial markets. Although Trump may have triumphantly celebrated rising stock prices immediately after the tariff freeze was announced, financial markets are now subject to levels of uncertainty and fear similar to those seen during COVID-19.

Five years ago, volatility was associated with increased demand for US government debt due to the “flight to safety” effect: investors selling higher risk investments and buying safer assets, such as gold and government bonds, in times of uncertainty.

Now we are seeing the exact opposite. The price of US bonds has fallen since “Liberation Day”, and this means that investors are selling them. In other words, markets no longer believe that US government debt is a safe asset. Given the role of the dollar and US debt in international markets, this paradigm shift may generate even more financial instability down the line.

Supply chains are breaking (again)

COVID-19, the last major global economic crisis, has one thing in common with the current situation: disruption of global supply chains. During the pandemic it was confinement that forced production to stop. Today, it is the imposition of tariffs.

However, there is another major difference. During COVID people knew it was a matter of time before vaccines became available and normality returned. Today, instability in financial markets comes not from any virus, but from President Trump’s own advisors selling him all manner of plans to protect US economic interests.The Conversation

About the Author:

Sergi Basco, Profesor Agregado de Economia, Universitat de Barcelona

This article is republished from The Conversation under a Creative Commons license. Read the original article.


Can Alphabet’s Q1 earnings arrest its stock’s slump?

By ForexTime 

  • Alphabet’s stocks down 19.2% year-to-date; market cap now US$ 1.86 trillion
  • Company set to unveil Q1 earnings after US markets close Thursday, April 24th
  • Investors eager for updates on Cloud margins, AI capex plans, tariff impact
  • Alphabet’s share price forecasted to move 5.8% up/down when US markets reopen Friday
  • Wall Street lowers 12-month target price; still a strong buy with 33% potential upside


After US markets close this Thursday, April 24th, Alphabet is set to unveil its Q1 financial results.

Despite a rebound yesterday (Tuesday, April 22nd), Big Tech stocks have been languishing in the run up to this upcoming set of earnings reports.

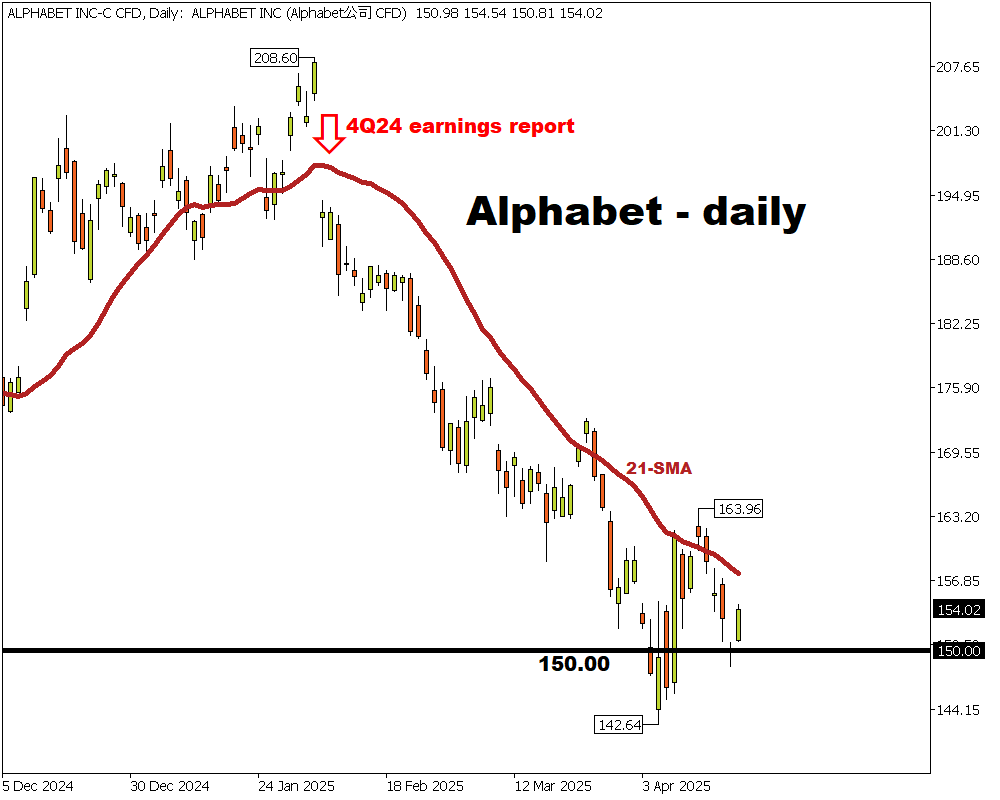
The current record high of US$208.60 for Alphabet’s C-class shares (no voting rights) were from February 4ththe day of its last earnings announcement – when it announced slowing growth in its Cloud segment and lower-than-expected revenue in Q4 2024.

Since then, this stock has fallen:

  • Intraday prices: as much as 31.6% (Feb 4th intraday high through April 7th intraday low)
  • Closing prices: 26.2% lower (Feb 4th close through April 22nd close)
Imagen
Alphabet’s Q1 earnings due after US markets close April 24, 2025

Why are US tech stocks falling?

US President Donald Trump’s erratic policy rollout, especially surrounding trade tariffs, have dented the aura surrounding “US exceptionalism”.

US tech stocks certainly have been one of the primary victims from this major blow to risk-taking activities across global financial markets.

For comparison, the 19.2% year-to-date drop in Alphabet’s C-class shares:

  • are almost double the S&P 500’s 10.1% decline so far this year
  • exceeds the tech-heavy Nasdaq 100 index’s 13% year-to-date drop


Alphabet’s Q1 earnings: What to look out for?


1) Cloud compression?

Revenue from its Cloud segment is expected to breach US$12.3 billion for Q1 2025 – the segment’s highest ever top line number.

However, the operating income for the segment is expected to dip back below the US$ 2 billion figure:

  • Q4 2024: $2.09B down to …
  • Q1 2025: US$1.94B … marking the first contraction for this line item since Q3 2023.

Investors and analysts will be keen to find out how Alphabet can buttress its Cloud margins, even as rising AI-fueled demand also requires more infrastructure investments.

NOTE: According to Alphabet CEO Sundar Pichai, Google’s Cloud is still smaller in size relative to Amazon’s and Microsoft’s.


And that brings us to the second key area to look out for …

2) AI integration (Gemini, AI agents) and capital expenditure (capex) plans

The integration of Gemini appears to be central to the growth of Alphabet’s Search segment – which accounts for more than half (55 – 57%) of total revenue in recent quarters.

Also, Gemini and other AI use cases are expected to help grow its Cloud segment from its:

  • Q1 2024: 11.9% of total company revenue for the quarter
  • Q1 2025: 13.8% of total company revenue for the quarter

Looking ahead, recall that the company had already issued capex guidance for US$75 billion for this year’s capex.

And that’s despite the risks posed DeepSeek’s apparent showing that AI gains can be achieved using lower-cost models.

The slightest hint of a pullback in capex plans could send Alphabet’s stocks tumbling on fears that the fervor for all things AI is losing momentum still.


3) Tariff impact

Since the flurry of tariff-related announcements this month, the expected impact on Alphabet’s financial figures appears limited to its:

  • hardware sales (think Pixel phones) and also …
  • Cloud infrastructure (think of the chips required to build out Alphabet’s data centers).

Hence, Alphabet’s share price is bound to reflect the company’s guidance on the tariffs’ impact on future earnings.


Beyond the main themes listed above, here are some headline Q1 figures to look out for:

  • Revenue: forecasted at US$75.4 billion
  • Net income: forecasted at US$24.7 billion
  • Earnings per share (EPS): forecasted at US$ 2.04


Potential Post-Earnings Scenarios

Note that markets currently predict that Alphabet’s stocks could move 5.8% up or down when US markets reopen on Friday, April 25th – the day after Alphabet’s Q1 earnings announcement.

  • BULLISH: Should Alphabet’s past quarterly financials and forward guidance help restore sentiment surrounding this stock, that could help pare its year-to-date declines.

Using Tuesday’s closing price of $154.02 as a reference point, a 5.8% climb would see this stock breaking above its 21-day simple moving average (SMA) and reaching around $163 – closing in on its mid-April intraday high.

  • BEARISH: Should Alphabet announce lower-than-expected Q1 2025 financial results, while citing greater concern about its earnings outlook, a 5.8% move downwards from Tuesday’s closing price should see this stock opening around $145 this Friday.

Still, much may yet happen across US stock markets over the next 2 days (Wednesday’s and Thursday’s cash sessions) which could drastically alter the above-listed numbers.


Over the next 12 months …

Wall Street analysts are still bullish on this stock, with:

  • 20 “Buy” calls
  • 1 “Hold”
  • 0 “Sells”

By this time in 2026, this stock is forecasted to have an upside potential of 34%, eventually touching $205.33.

To be clear, so far this month, many research houses including Morgan Stanley, UBS, Citi, Mizuho, and Bank of America have lowered their respective 12-month target prices on this stock.

And there’s bound to be more revisions after what Alphabet conveys to the world this week.

In short, this upcoming earnings release is set to hold great influence over how Alphabet’s shares perform, both in the immediate aftermath, and for the longer-term.


Forex-Time-LogoArticle by ForexTime

ForexTime Ltd (FXTM) is an award winning international online forex broker regulated by CySEC 185/12 www.forextime.com

Japanese Yen Appreciates Too Rapidly: Speed Poses Risks

By RoboForex Analytical Department 

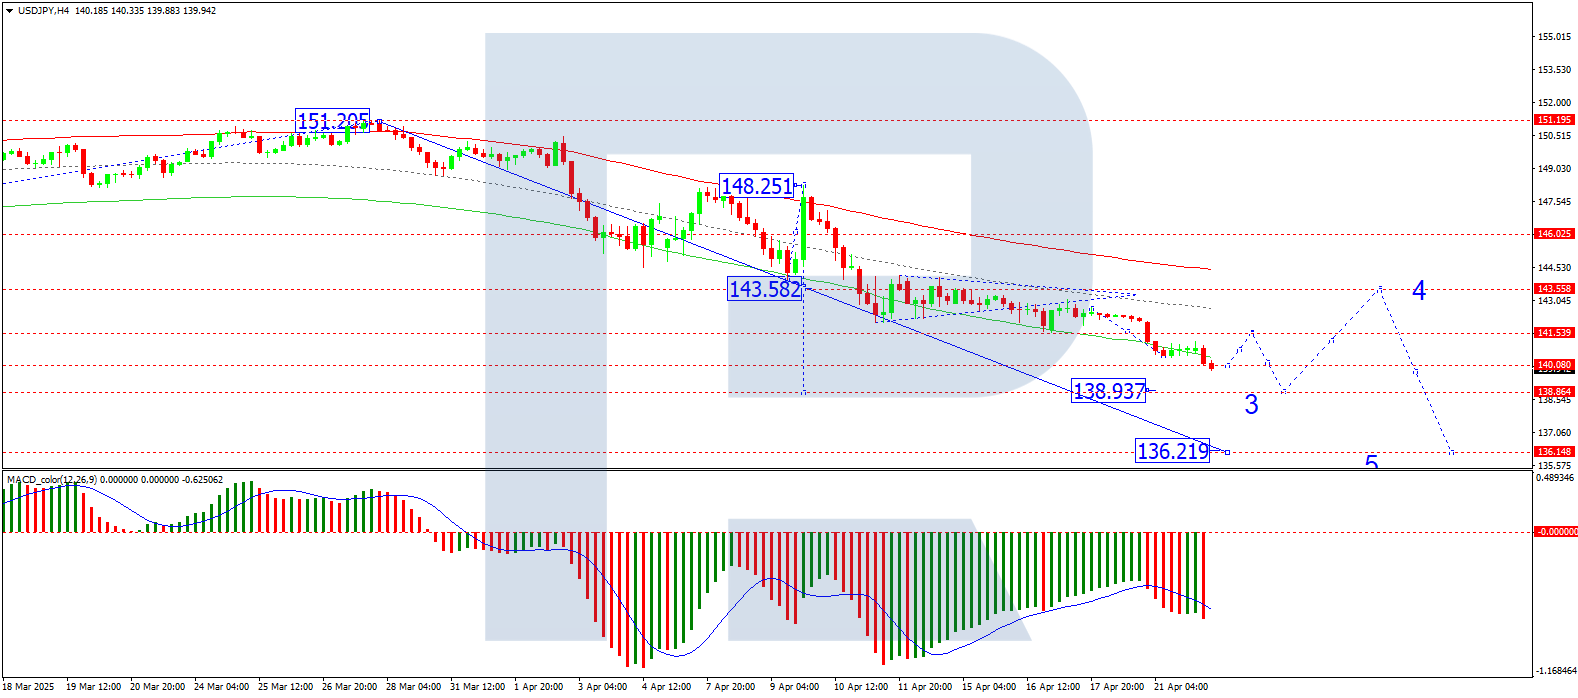
The USD/JPY pair dropped to 140.13 on Tuesday, marking yet another seven-month low.

Key Drivers Behind USD/JPY Movements

The yen’s rally is gaining momentum amid rising global trade risks. Additionally, investors are growing increasingly wary of US assets.

Last week’s tentative market optimism has now faded, with sentiment deteriorating following remarks from US President Donald Trump regarding the potential dismissal of Federal Reserve Chair Jerome Powell. Trump has expressed dissatisfaction with the Fed’s pace of decision-making, with the White House believing progress is too slow.

Domestically, Japanese investors are closely watching the upcoming Bank of Japan (BoJ) meeting on 1 May. While the key interest rate is expected to remain steady at 0.50% per annum, the central bank may revise its economic growth forecasts—prompted by mounting external risks, including the impact of US tariffs on Japanese exports.

The yen continues to perform strongly as a safe-haven asset. However, an excessively strong JPY also carries risks.

Technical Analysis: USD/JPY

H4 Chart

On the H4 chart, USD/JPY has broken below the 141.55 level, extending its downward wave towards 138.88. This is a near-term target, and upon reaching it, a corrective rebound towards 143.55 is possible. Beyond that, further downside towards 136.22 may be considered. This scenario is supported by the MACD indicator, with its signal line firmly below zero and pointing sharply downward.

H1 Chart

On the H1 chart, the pair continues to develop the third wave of its downtrend. The immediate target of 140.00 has been met, and a temporary rebound to 141.55 (testing from below) could occur today. Subsequently, another decline towards 138.88 may follow. This outlook is corroborated by the Stochastic oscillator, whose signal line is below 20 but turning upward towards 80.

Conclusion

While the yen’s strength reflects its defensive appeal, excessive appreciation could prove detrimental. Traders should monitor both fundamental developments and technical signals for further guidance.


Disclaimer

Any forecasts contained herein are based on the author’s particular opinion. This analysis may not be treated as trading advice. RoboForex bears no responsibility for trading results based on trading recommendations and reviews contained herein.

Speculator Extremes: Yen, Brazilian Real, 5-Year Bonds & WTI Crude Oil lead Weekly Positions

By InvestMacro 

The latest update for the weekly Commitment of Traders (COT) report was released by the Commodity Futures Trading Commission (CFTC) on Friday for data ending on April 15th.

This weekly Extreme Positions report highlights the Most Bullish and Most Bearish Positions for the speculator category. Extreme positioning in these markets can foreshadow strong moves in the underlying market.

To signify an extreme position, we use the Strength Index (also known as the COT Index) of each instrument, a common method of measuring COT data. The Strength Index is simply a comparison of current trader positions against the range of positions over the previous 3 years. We use over 80 percent as extremely bullish and under 20 percent as extremely bearish. (Compare Strength Index scores across all markets in the data table or cot leaders table)


Here Are This Week’s Most Bullish Speculator Positions:

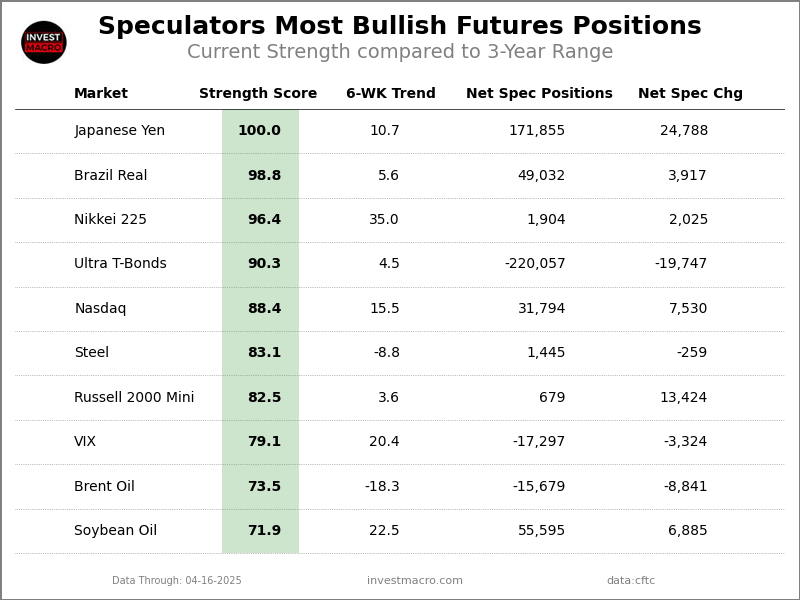
Japanese Yen


The Japanese Yen speculator position continues to make new all-time record highs and comes in as the most bullish extreme standing again this week. The Japanese Yen speculator level is currently at a maximum 100.0 percent score of its 3-year range.

The six-week trend for the percent strength score totaled a gain of 10.7 this week. The overall net speculator position was a total of 171,855 net contracts this week with a boost by 24,788 contracts in the weekly speculator bets.


Speculators or Non-Commercials Notes:

Speculators, classified as non-commercial traders by the CFTC, are made up of large commodity funds, hedge funds and other significant for-profit participants. The Specs are generally regarded as trend-followers in their behavior towards price action – net speculator bets and prices tend to go in the same directions. These traders often look to buy when prices are rising and sell when prices are falling. To illustrate this point, many times speculator contracts can be found at their most extremes (bullish or bearish) when prices are also close to their highest or lowest levels.

These extreme levels can be dangerous for the large speculators as the trade is most crowded, there is less trading ammunition still sitting on the sidelines to push the trend further and prices have moved a significant distance. When the trend becomes exhausted, some speculators take profits while others look to also exit positions when prices fail to continue in the same direction. This process usually plays out over many months to years and can ultimately create a reverse effect where prices start to fall and speculators start a process of selling when prices are falling.


Brazil Real


The Brazil Real speculator position comes next in the extreme standings this week as the Brazil Real speculator level has seen rising sentiment and is now at a 98.8 percent score of its 3-year range.

The six-week trend for the percent strength score was 5.6 this week. The speculator position registered 49,032 net contracts this week with a weekly rise of 3,917 contracts in speculator bets.


Nikkei 225


The Nikkei 225 speculator position comes in third this week in the extreme standings. The Nikkei 225 speculator level resides at a 96.4 percent score of its 3-year range.

The six-week trend for the speculator strength score came in at a rise of 35.0 this week. The overall speculator position was 1,904 net contracts this week following an increase by 2,025 contracts in the weekly speculator bets.


Ultra U.S. Treasury Bonds


The Ultra U.S. Treasury Bonds speculator position comes up number four in the extreme standings this week. The Ultra U.S. Treasury Bonds speculator level is at a 90.3 percent score of its 3-year range.

The six-week trend for the speculator strength score totaled a change of 4.5 this week. The overall speculator position was -220,057 net contracts this week with a decline of -19,747 contracts in the speculator bets.


Nasdaq


The Nasdaq speculator position rounds out the top five in this week’s bullish extreme standings as the Nasdaq speculator level sits at a 88.4 percent score of its 3-year range. The six-week trend for the speculator strength score was 15.5 this week.

The speculator position totaled 31,794 net contracts this week with a gain of 7,530 contracts in the weekly speculator bets.


This Week’s Most Bearish Speculator Positions:

5-Year Bond


The 5-Year Bond speculator position comes in as the most bearish extreme standing this week. The 5-Year Bond speculator level is at a 0.0 percent score of its 3-year range.

The six-week trend for the speculator strength score was -13.4 this week. The overall speculator position totals -2,061,575 net contracts this week with a drop of -40,000 contracts in the speculator bets.


WTI Crude Oil


The WTI Crude Oil speculator position comes in next for the most bearish extreme standing on the week. The WTI Crude Oil speculator level is at a 3.8 percent score of its 3-year range.

The six-week trend for the speculator strength score was -4.0 this week. The speculator position was 146,370 net contracts this week with a rise by 6,775 contracts in the weekly speculator bets.


US Dollar Index


The US Dollar Index speculator position comes in as third most bearish extreme standing of the week. The US Dollar Index speculator level resides at a 10.5 percent score of its 3-year range.

The six-week trend for the speculator strength score was -26.8 this week. The overall speculator position totaled 1,828 net contracts this week with a drop by -1,085 contracts in the speculator bets.


Wheat


The Wheat speculator position comes in as this week’s fourth most bearish extreme standing as the Wheat speculator level is at a 11.0 percent score of its 3-year range.

The six-week trend for the speculator strength score was -2.6 this week. The speculator position was -88,326 net contracts this week following an increase of 3,598 contracts in the weekly speculator bets.


E-mini SP MidCap400

Finally, the E-mini SP MidCap400 speculator position comes in as the fifth most bearish extreme standing for this week. The E-mini SP MidCap400 speculator level is at a 11.1 percent score of its 3-year range.

The six-week trend for the speculator strength score was -16.1 this week. The speculator position is a total of -91 net contracts this week with a change of -1,984 contracts in the weekly speculator bets.


Article By InvestMacroReceive our weekly COT Newsletter

*COT Report: The COT data, released weekly to the public each Friday, is updated through the most recent Tuesday (data is 3 days old) and shows a quick view of how large speculators or non-commercials (for-profit traders) were positioned in the futures markets.

The CFTC categorizes trader positions according to commercial hedgers (traders who use futures contracts for hedging as part of the business), non-commercials (large traders who speculate to realize trading profits) and nonreportable traders (usually small traders/speculators) as well as their open interest (contracts open in the market at time of reporting). See CFTC criteria here.

Week Ahead: GBPUSD “golden cross” sets stage for bullish breakout

By ForexTime 

  • GBPUSD ↑ almost 3% MTD, trading near 2025 high  
  • “Golden cross” chart pattern signals potential bullish move 
  • UK data + Bailey speech + US data = heightened volatility?
  • UK retail sales sparked moves of ↑ 0.3% & ↓ 0.4% over past year
  • Technical levels – 1.3400, 1.3300 & 1.3150

Stability may return to markets as investors adopt a wait-and-see approach toward tariff talks.

There is cautious optimism over the US striking a trade deal with Japan and Europe, while China has expressed interest in talks if Trump shows respect.

Easing trade tensions could lift sentiment in the week ahead, providing fresh opportunities across financial markets.

Beyond trade developments, key economic data and corporate earnings will be in focus:

Monday, 21st April

  • CN50: China loan prime rates

Tuesday, 22nd April  

  • AU200: S&P Global Australia PMI’s
  • NAS100: Tesla earnings

Wednesday, 23rd April   

  • EU50: Euro-Area Flash PMI’s
  • GER40: HCOB Germany PMI’s
  • GBP: S&P Global UK PMI’s, BoE Governor Bailey speech
  • US500: S&P Global US PMI’s, Fed Beige Book
  • US30: Boeing earnings

Thursday, 24th April   

  • GER40: Germany IFO Business Climate
  • GBP: GfK Consumer Confidence
  • NAS100: Initial jobless claims, Alphabet, Intel earnings

Friday, 25th April 

  • JP225: Tokyo CPI
  • GBP: UK Retail Sales
  • RUS2000: University of Michigan Sentiment

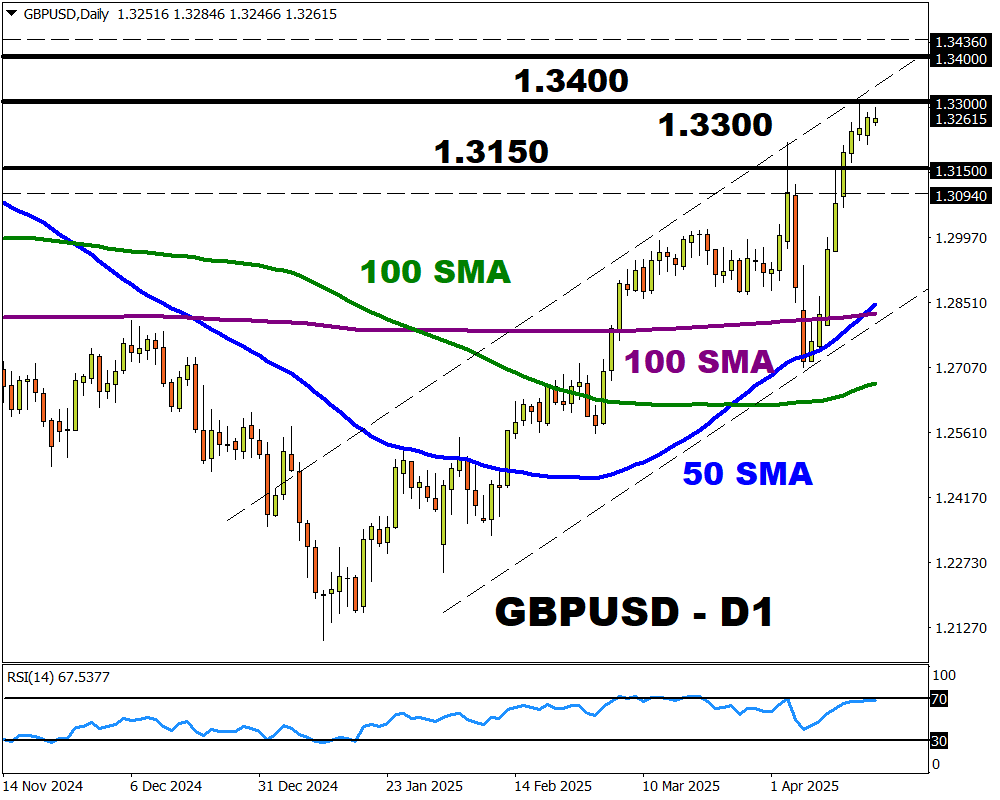
Our attention falls on the GBPUSD which has formed a “golden cross” pattern on the daily charts.

Imagen
GBPUSD 3

Note: A golden cross is when an asset’s 50-day simple moving average (SMA) crosses above its 200-day SMA. This event indicates that prices may push higher. 

Over the past two weeks, the GBPUSD has been on a tear thanks to a broadly weaker dollar. Prices have jumped almost 3% this month, pushing year-to-date gains to 6%.

With the major currency pair approaching resistance at 1.3300, a significant breakout could be on the horizon.

Here are 3 reasons why: 


1) UK data + BoE Bailey speech

The incoming UK data could provide insight into how the economy fared during mounting uncertainty over US tariff announcements.

On Wednesday, the latest S&P Global UK PMIs will be published, followed by the GfK consumer Confidence on Thursday and UK retail sales on Friday. Much attention will be paid to BoE Governor Bailey’s speech mid-week which may offer clues on future policy moves.

Note: Over the past 12 months, the UK retail sales report has sparked upside moves of as much as 0.3% or declines of 0.4% in the 6 hours post-release.

  • The GBPUSD could appreciate if overall data prints better than expected and Bailey strikes a hawkish note.
  • If UK economic data disappoints and Bailey expresses concern over the UK economic outlook, the GBPUSD may sink as BoE cut bets jump. 

As of writing traders are currently pricing in 3 BoE cuts in 2025 with the probability of a fourth one by December at 23%.

2) US data + Fed Beige Book

Upcoming US data and the Fed’s Beige Book may illustrate how the world’s largest economy has been impacted by trade uncertainty.

Mid-week, the latest US S&P PMIs and beige book will be published, followed by the initial jobless claims on Thursday and the University of Michigan Sentiment on Friday.

Note: Over the past 12 months, the US S&P PMI reports have triggered upside moves of as much as 0.5% or declines of 0.6% in a 6-hour window post-release.

  • A solid set of economic reports from the United States may boost the dollar, dragging the GBPUSD lower.
  • Should the dollar weaken on soft economic data, the GBPUSD may push higher.


3) Technical forces

The GBPUSD is firmly bullish on the daily charts with prices trading above the 50, 100 and 200-day SMA. As discussed earlier, the “golden cross” pattern is a strong bullish signal with key resistance at 1.3300.

  • A daily close above 1.3300 may trigger an incline toward 1.3400 and 1.3436 – the upper limit of Bloomberg’s FX model.
  • Sustained weakness below 1.3300, may see prices decline toward 1.3150 and 1.3094 – the lower bound of Bloomberg’s FX model.
Imagen
GBPUSD 2

Bloomberg’s FX model forecasts a 76% chance that GBPUSD will trade within the 1.3094 – 1.3436 range, using current levels as a base, over the next one-week period.


Forex-Time-LogoArticle by ForexTime

ForexTime Ltd (FXTM) is an award winning international online forex broker regulated by CySEC 185/12 www.forextime.com

Popular AIs head-to-head: OpenAI beats DeepSeek on sentence-level reasoning

By Manas Gaur, University of Maryland, Baltimore County 

ChatGPT and other AI chatbots based on large language models are known to occasionally make things up, including scientific and legal citations. It turns out that measuring how accurate an AI model’s citations are is a good way of assessing the model’s reasoning abilities.

An AI model “reasons” by breaking down a query into steps and working through them in order. Think of how you learned to solve math word problems in school.

Ideally, to generate citations an AI model would understand the key concepts in a document, generate a ranked list of relevant papers to cite, and provide convincing reasoning for how each suggested paper supports the corresponding text. It would highlight specific connections between the text and the cited research, clarifying why each source matters.

The question is, can today’s models be trusted to make these connections and provide clear reasoning that justifies their source choices? The answer goes beyond citation accuracy to address how useful and accurate large language models are for any information retrieval purpose.

I’m a computer scientist. My colleagues − researchers from the AI Institute at the University of South Carolina, Ohio State University and University of Maryland Baltimore County − and I have developed the Reasons benchmark to test how well large language models can automatically generate research citations and provide understandable reasoning.

We used the benchmark to compare the performance of two popular AI reasoning models, DeepSeek’s R1 and OpenAI’s o1. Though DeepSeek made headlines with its stunning efficiency and cost-effectiveness, the Chinese upstart has a way to go to match OpenAI’s reasoning performance.

Sentence specific

The accuracy of citations has a lot to do with whether the AI model is reasoning about information at the sentence level rather than paragraph or document level. Paragraph-level and document-level citations can be thought of as throwing a large chunk of information into a large language model and asking it to provide many citations.

In this process, the large language model overgeneralizes and misinterprets individual sentences. The user ends up with citations that explain the whole paragraph or document, not the relatively fine-grained information in the sentence.

Further, reasoning suffers when you ask the large language model to read through an entire document. These models mostly rely on memorizing patterns that they typically are better at finding at the beginning and end of longer texts than in the middle. This makes it difficult for them to fully understand all the important information throughout a long document.

Large language models get confused because paragraphs and documents hold a lot of information, which affects citation generation and the reasoning process. Consequently, reasoning from large language models over paragraphs and documents becomes more like summarizing or paraphrasing.

The Reasons benchmark addresses this weakness by examining large language models’ citation generation and reasoning.

How DeepSeek R1 and OpenAI o1 compare generally on logic problems.

Testing citations and reasoning

Following the release of DeepSeek R1 in January 2025, we wanted to examine its accuracy in generating citations and its quality of reasoning and compare it with OpenAI’s o1 model. We created a paragraph that had sentences from different sources, gave the models individual sentences from this paragraph, and asked for citations and reasoning.

To start our test, we developed a small test bed of about 4,100 research articles around four key topics that are related to human brains and computer science: neurons and cognition, human-computer interaction, databases and artificial intelligence. We evaluated the models using two measures: F-1 score, which measures how accurate the provided citation is, and hallucination rate, which measures how sound the model’s reasoning is − that is, how often it produces an inaccurate or misleading response.

Our testing revealed significant performance differences between OpenAI o1 and DeepSeek R1 across different scientific domains. OpenAI’s o1 did well connecting information between different subjects, such as understanding how research on neurons and cognition connects to human-computer interaction and then to concepts in artificial intelligence, while remaining accurate. Its performance metrics consistently outpaced DeepSeek R1’s across all evaluation categories, especially in reducing hallucinations and successfully completing assigned tasks.

OpenAI o1 was better at combining ideas semantically, whereas R1 focused on making sure it generated a response for every attribution task, which in turn increased hallucination during reasoning. OpenAI o1 had a hallucination rate of approximately 35% compared with DeepSeek R1’s rate of nearly 85% in the attribution-based reasoning task.

In terms of accuracy and linguistic competence, OpenAI o1 scored about 0.65 on the F-1 test, which means it was right about 65% of the time when answering questions. It also scored about 0.70 on the BLEU test, which measures how well a language model writes in natural language. These are pretty good scores.

DeepSeek R1 scored lower, with about 0.35 on the F-1 test, meaning it was right about 35% of the time. However, its BLEU score was only about 0.2, which means its writing wasn’t as natural-sounding as OpenAI’s o1. This shows that o1 was better at presenting that information in clear, natural language.

OpenAI holds the advantage

On other benchmarks, DeepSeek R1 performs on par with OpenAI o1 on math, coding and scientific reasoning tasks. But the substantial difference on our benchmark suggests that o1 provides more reliable information, while R1 struggles with factual consistency.

Though we included other models in our comprehensive testing, the performance gap between o1 and R1 specifically highlights the current competitive landscape in AI development, with OpenAI’s offering maintaining a significant advantage in reasoning and knowledge integration capabilities.

These results suggest that OpenAI still has a leg up when it comes to source attribution and reasoning, possibly due to the nature and volume of the data it was trained on. The company recently announced its deep research tool, which can create reports with citations, ask follow-up questions and provide reasoning for the generated response.

The jury is still out on the tool’s value for researchers, but the caveat remains for everyone: Double-check all citations an AI gives you.The Conversation

About the Author:

Manas Gaur, Assistant Professor of Computer Science and Electrical Engineering, University of Maryland, Baltimore County

This article is republished from The Conversation under a Creative Commons license. Read the original article.


What is reinforcement learning? An AI researcher explains a key method of teaching machines – and how it relates to training your dog

By Ambuj Tewari, University of Michigan 

Understanding intelligence and creating intelligent machines are grand scientific challenges of our times. The ability to learn from experience is a cornerstone of intelligence for machines and living beings alike.

In a remarkably prescient 1948 report, Alan Turing – the father of modern computer science – proposed the construction of machines that display intelligent behavior. He also discussed the “education” of such machines “by means of rewards and punishments.”

Turing’s ideas ultimately led to the development of reinforcement learning, a branch of artificial intelligence. Reinforcement learning designs intelligent agents by training them to maximize rewards as they interact with their environment.

As a machine learning researcher, I find it fitting that reinforcement learning pioneers Andrew Barto and Richard Sutton were awarded the 2024 ACM Turing Award.

What is reinforcement learning?

Animal trainers know that animal behavior can be influenced by rewarding desirable behaviors. A dog trainer gives the dog a treat when it does a trick correctly. This reinforces the behavior, and the dog is more likely to do the trick correctly the next time. Reinforcement learning borrowed this insight from animal psychology.

But reinforcement learning is about training computational agents, not animals. The agent can be a software agent like a chess-playing program. But the agent can also be an embodied entity like a robot learning to do household chores. Similarly, the environment of an agent can be virtual, like the chessboard or the designed world in a video game. But it can also be a house where a robot is working.

Just like animals, an agent can perceive aspects of its environment and take actions. A chess-playing agent can access the chessboard configuration and make moves. A robot can sense its surroundings with cameras and microphones. It can use its motors to move about in the physical world.

Agents also have goals that their human designers program into them. A chess-playing agent’s goal is to win the game. A robot’s goal might be to assist its human owner with household chores.

The reinforcement learning problem in AI is how to design agents that achieve their goals by perceiving and acting in their environments. Reinforcement learning makes a bold claim: All goals can be achieved by designing a numerical signal, called the reward, and having the agent maximize the total sum of rewards it receives.

Reinforcement learning from human feedback is key to keeping AIs aligned with human goals and values.

Researchers do not know if this claim is actually true, because of the wide variety of possible goals. Therefore, it is often referred to as the reward hypothesis.

Sometimes it is easy to pick a reward signal corresponding to a goal. For a chess-playing agent, the reward can be +1 for a win, 0 for a draw, and -1 for a loss. It is less clear how to design a reward signal for a helpful household robotic assistant. Nevertheless, the list of applications where reinforcement learning researchers have been able to design good reward signals is growing.

A big success of reinforcement learning was in the board game Go. Researchers thought that Go was much harder than chess for machines to master. The company DeepMind, now Google DeepMind, used reinforcement learning to create AlphaGo. AlphaGo defeated top Go player Lee Sedol in a five-match game in 2016.

A more recent example is the use of reinforcement learning to make chatbots such as ChatGPT more helpful. Reinforcement learning is also being used to improve the reasoning capabilities of chatbots.

Reinforcement learning’s origins

However, none of these successes could have been foreseen in the 1980s. That is when Barto and his then-Ph.D. student Sutton proposed reinforcement learning as a general problem-solving framework. They drew inspiration not only from animal psychology but also from the field of control theory, the use of feedback to influence a system’s behavior, and optimization, a branch of mathematics that studies how to select the best choice among a range of available options. They provided the research community with mathematical foundations that have stood the test of time. They also created algorithms that have now become standard tools in the field.

It is a rare advantage for a field when pioneers take the time to write a textbook. Shining examples like “The Nature of the Chemical Bond” by Linus Pauling and “The Art of Computer Programming” by Donald E. Knuth are memorable because they are few and far between. Sutton and Barto’s “Reinforcement Learning: An Introduction” was first published in 1998. A second edition came out in 2018. Their book has influenced a generation of researchers and has been cited more than 75,000 times.

Reinforcement learning has also had an unexpected impact on neuroscience. The neurotransmitter dopamine plays a key role in reward-driven behaviors in humans and animals. Researchers have used specific algorithms developed in reinforcement learning to explain experimental findings in people and animals’ dopamine system.

Barto and Sutton’s foundational work, vision and advocacy have helped reinforcement learning grow. Their work has inspired a large body of research, made an impact on real-world applications, and attracted huge investments by tech companies. Reinforcement learning researchers, I’m sure, will continue to see further ahead by standing on their shoulders.The Conversation

About the Author:

Ambuj Tewari, Professor of Statistics, University of Michigan

This article is republished from The Conversation under a Creative Commons license. Read the original article.


Stock Rotation Will Benefit Gold Stocks

Source: Adrian Day (4/8/25) 

Adrian Day of Adrian Day Asset Management shares a comprehensive portfolio review, which includes thoughts on the current state of the market, gold, silver, copper, oil and gas, and uranium.

The new U.S. Administration may have hastened some economic and market trends, but the underlying factors were already underway. Inflation has been picking up since last July; the U.S. consumer has been pulling on the reins for months now amid tapped-out credit; the Federal government has been careening towards a debt crisis.

The stock market was ripe for a correction, bonds have been weak, while gold had been on a tear for a couple of years. The new administration’s actions and policies, and the uncertainty created by them sparked some of these developments, but the trends were already underway.

The Move To Global Markets Starts

For the first time in several years, the U.S. market is underperforming global equities. The S&P fell 4.6% and Nasdaq just over 10% for the quarter, while stocks outside the U.S. rose 4.6% (per the Morgan Stanley-Capital International World ex-U.S. Index). Most European markets were up by the mid-teens, while most of Asia fell, with Hong Kong (up 15%) and Singapore (up 6.6%) the major exceptions. Tech stocks were the biggest losers.

Our global accounts outperformed the indexes, with our mid-risk growth accounts up just over 16% for the quarter.* (See disclosures below.)

Conservative accounts were up somewhat less — virtually 12% — and more aggressive accounts a tad more. In all cases, however, our global accounts outperformed the benchmarks. The main reasons were a low exposure to the U.S. markets and above-weight exposure to Hong Kong and Singapore, while a high allocation to gold stocks also clearly helped. Going forward, we expect these same factors to help us in the next quarter or more.

Gold Stocks Have Started To Move, Seniors First

As always, commodities were mixed, with the complex up just under 8% (per Bloomberg Commodity Index). Gold, silver, and copper led the metals, while natural gas was also strong. Oil was essentially flat. The major gold stocks finally outperformed the metal; while gold rose 20% in the first quarter, the senior gold stocks (per the XAU) jumped 29%.

Though our resource accounts, up 17.5%, well outperformed the resource index, our gold accounts, up 17.4%, lagged. The main reasons our resource accounts outperformed were a high exposure to the top-performing gold, silver, and copper and a low exposure to oil.

In gold accounts, our exposure to smaller companies hurt relative performance since these smaller stocks have barely budged as the seniors surged ahead. This will change as the bull market develops and retail investors return to the sector. In addition, the most leveraged stocks can have the most dramatic moves early on, but they don’t sustain those moves.

Uncertainty and Volatility Lie Ahead

The last quarter provides a look at what we can expect over the next four years, including a high degree of uncertainty. One thing is certain, though: it won’t be like the last four years.

The markets will be unpredictable and volatile, and the winners of the last four years — U.S. stocks, tech, and the dollar — may not be the winners of the period ahead.

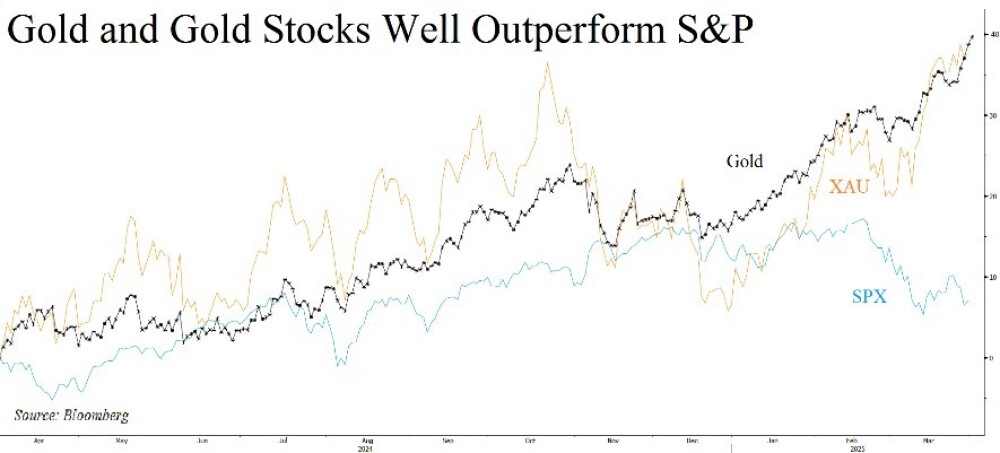
Gold, which has actually gained more than the S&P Index over the past four years, may continue to shine: it responds well to uncertainty, whether geopolitical, economic, or monetary.
Much of this uncertainty arises from what is known as the “Mar-A-Lago Accord,” notwithstanding that the primary author has walked back its import in recent weeks.

The “Accord” refers to a set of economic and monetary policies espoused by various people around President Trump to reset the global financial system. It is not (yet) a complete, specific plan.

Rather, it is a collection of ideas, some well-formulated, some aspirational, and some conflicting.

Security Will Be Linked With Debt

The aims behind the so-called “Accord” are to lower debt and interest payments, get foreign countries to pay more and end what is viewed as foreign countries living off the U.S., end what is deemed “persistent dollar overvaluation,” and bring manufacturing back to the U.S.

Among the ideas put forward is the concept advanced by Treasury Secretary Scott Bessent to monetize the U.S.’s assets, including revaluing the U.S. gold reserves. The idea has been floated of using government assets as collateral for loans, thus — theoretically, at least — reducing the interest rate required to be paid on these loans. Another proposal would require foreign governments to exchange Treasuries that they hold for 50-year, non-tradeable, zero-coupon bonds. In exchange, these countries would receive the military protection of the U.S. and access to U.S. market.

Many of the ideas came in a paper last November written by now-Chairman of the White House Council of Economic Advisors Stephen Miran, in which he termed the phrase “Mar-A-Lago Accord,” a riff on the 1985 Plaza Accord. He has since tried to walk back the idea of a restructuring of the global financial system, saying that his paper was “a catalog of available options…(not) the source of the policy agenda.” He added that the paper presented “various recipes (but) the President is the chef.”

We have seen specific moves towards some of this with the Trump tariffs, as well as demands for European nations to pay more towards NATO and the defense of Europe, but as yet no holistic plan towards implementing the restructuring of the global financial system. But whether it comes in one grand scheme or piecemeal, policy is moving in that direction. The implications for markets — let alone geopolitics and the  global economy — are vast and wide-ranging.

Respected advisor Jim Bianco hit the nail on the head when he warned, “Don’t take this literally, but do take it seriously.”

Having the Reserve Currency Comes With Benefits

The thinking behind some of the aims is real, if one-sided and exaggerated. But one fundamental is wrong or, at minimum, incomplete. Having the world’s reserve currency carries costs and obligations, but it also enables the country to print more money than it otherwise could, knowing that other countries will buy its debt.

Thus, it increases the country’s standard of living and exports inflation. This comes at the cost of a higher value of the currency, hurting exports and domestic industry. It is not for nothing that having the world’s reserve currency has been called (by then-French Finance Minister Valéry Giscard d’Estaing) “the exorbitant privilege.”

One major problem with having that privilege is what happens when one starts to lose it (in this case, either because other countries start to turn away from using the dollar or when the U.S. itself tries to lower the dollar’s value): money held abroad starts to come back, increasing inflation; imports become more expensive; interest rates increase (because other countries are less inclined to hold U.S. debt); and the debt becomes an intolerable burden. Look at what happened to Britain after 1945.

In 1985, at the time of the Plaza Accord, allies Japan, Taiwan, Canada, and Germany had the largest trade surpluses with the U.S. Today, China has the largest trade surplus with the U.S., while Vietnam has the third largest (Mexico the second), and they will not so readily succumb to U.S. carrots or sticks. Certainly, the leading trade surplus countries in 1985 relied on U.S. security, but that is not the case with many of today’s leading surplus countries. Similarly, the countries with the largest holdings of long-term Treasuries are not likely to take kindly to these threats. So, it is not even clear that a new currency accord would even work today, and certainly not with the agreement of leading trading countries.

Moves Could Hurt the Treasury Market

The mere idea of such a proposal is hardly an incentive for governments to buy more U.S. bonds, and is likely to only speed up the move away from the dollar in foreign central bank reserves. In the short term, this may well help depress the value of the dollar (over what it otherwise would be). And it would also make it more difficult for the U.S. to sell long-term bonds, thus driving up yields at the long end.

There is already an impending debt crisis in the U.S., rapidly moving towards denouement. The U.S. is issuing most of its debt in the short term because there is a shortage of traditional buyers of long-term bonds. The Treasury would have difficulty selling long-term bonds of any size without a meaningful increase in the interest paid.

The government has been doing this increasingly over the past 16 years after missing the opportunity to issue ultra-long-dated bonds when interest rates were at zero. This is a crisis that has to be dealt with, and probably before the end of this year, with or without broad restructuring and policy changes. It will likely lead to the end of Quantitative Tightening (QT) and another round of Quantitative Easing (QE).

The Fed is Changing Policy

This shift is already underway. Earlier in the month, the Federal Reserve decided to reduce the pace of the roll-off from the Fed’s balance sheet. While not changing the reduction in mortgage-backed securities, the Fed slashed the rate of the roll-off in Treasuries from an already-cut $25 billion a month to just $5 billion.

Given a balance sheet of $6.76 trillion ($4.23 trillion of which is in Treasuries), Bill Fleckenstein is right to call this “a rounding error.” The balance sheet remains higher, by more than 60%, from where it stood on the eve of COVID-19, despite three years of QT.

During his post-meeting press conference, Fed Chairman Jerome Powell was at pains to say repeatedly that nothing should be read into this. It was to do with money markets, he said, or maybe to do with the debt

ceiling, but “don’t take any signal from it.” That is just plain nonsense. This move is clearly to help the long-term Treasury market, which already has few buyers at current rates. Powell himself said the Fed would stop the reduction in Treasury holdings “at some point.” In my view, it is a precursor to a new round of QE from the Fed, likely later this year. It may not be called QE, but that is what it will be.

Whether we see just QE and tariffs or a broader set of policies, depending on whether they are implemented successfully, they would likely lead to more stock market weakness (probably after a near-term contrarian rally), bond market weakness, and some dollar weakness. But every one of these policies would be gold positive, if only by increasing uncertainty, both in the near term as well as over the longer term. Gold reacts positively to chaos and uncertainty, to disruption and volatility.

A Change in the Monetary System Presages Commodity Bull Market

Not only gold but also commodities will generally likely respond positively.

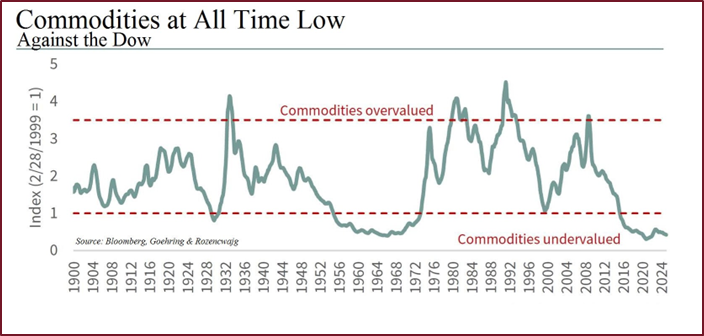
As analysts Goehring & Rozencwajg have noted, every past commodity bull market has been set in motion by a shock to the global monetary system, citing 1929 (end of the return to the gold standard), 1969 (end of Bretton Woods) and 1999 (end of the dollar pegs).

“A major shift in the global monetary system may be imminent,” and commodities are already responding to this, although fundamentally, commodities are as low relative to financial assets as they have been at any time in the last 100 years, cheaper even than at those three previous points of extreme under-valuation.
I must quote Goehring & Rozencwajg: “If gold is the canary in the coal mine, it is singing loudly.”

Each of those previous troughs in commodity prices against financial asset prices was followed not only by strong bull markets in commodities but also by weakness in stocks. In less than three years after the market crash in October 1929, the Dow fell 88%; stocks were still trading below their 1969 peak seven years later; while the S&P did not exceed its dot-com bubble highs until 2007, and then only very briefly, not to move sustainably higher until 2013.

The stock Rotation is Underway

U.S. stocks have been overvalued and extended for some time, with high valuation multiples, very narrow breadth, weak market internals, and so on. The February correction is but a beginning to what I expect will be an extended period of decline and rotation out of the erstwhile leaders and into markets and sectors that have lagged, or that offer attractive valuations.

(To be clear, we could see a contrarian bounce in the immediate term — the mid-March rally was very meager — but further out, we suspect the S&P will be lower.)

Respected market analyst John Hussman says that by many measures, the U.S. stock market is more overvalued today than even in 1999 or 1929. Price to sales; market cap vs GDP; market cap to Gross Value- added: all these and more show a market at historic valuation extremes. Other indicators, such as market breadth, support that assertion, while margin levels and excess speculation suggest a market that could drop sharply.

If we do see an extended period of weakness in the stock market, history would suggest that short-term Treasuries and gold are the assets most likely to do well. Other commodities also often do well. And even

within equities, some markets and sectors start to outperform as the old leaders fall. These include defensive and dividend-paying stocks, as well as small-cap value.

Global Stocks Start to Outperform

Global markets could also benefit from the weakness in the U.S. market; they have experienced the longest period of underperformance relative to the U.S. ever. The turn is beginning. Stocks outside the U.S. (per Morgan Stanely-Capital International World Ex-U.S. Index) are up 6.5% this year, against a negative 5% plus for U.S. stocks. European stock markets have done even better, up in the mid-teens this year.

In the U.S., growth stocks, which have dramatically and consistently outperformed value since the Great Financial Crisis, the trends have reversed, with value now outperforming growth and small-cap value even more so.

These styles, sectors, and markets are the ones that should outperform in the next period. The extent to which various groups outperform depends largely on how the dollar, interest rates, inflation, and other economic factors perform. Rising interest rates would dampen returns on dividend-paying stocks, while a declining dollar should help emerging markets, for example.

But as per above, the sector most likely to outperform is the commodity sector, and within that, gold has the best risk-reward. Though commodities generally are likely to outperform, they have a risk that gold does not, namely a sharp economic slowdown in China and global economic retraction.

Gold Drivers Remain Intact

Gold, however, does not have that risk. We have discussed several times over the past many quarters why gold has been going up. We do not see the drivers for gold demand changing, be it central banks buying to diversify their reserves amid increased dollar weaponization or Chinese consumers concerned at the loss of purchasing power and a fragile banking system. Western investors are concerned about political uncertainty amid unsustainably high debt levels in many governments.

None of this is likely to change, and gold thus is likely to be higher a year from now, notwithstanding the possibility of a pullback at some stage. Gold has moved well above trend line, but there is yet no manic buying, certainly not in North America; premiums on coins and bars tell the opposite story.

Why Are the Stocks Lagging?

The main investor concern of the past couple of years has been the disconnect between bullion and gold equities. Though the major gold stocks are up nearly 40% over the past 12 months — that’s five times the return on the S&P over the same period!  — they have only just matched gold’s returns and not exhibited the traditional leverage. At the same time, many intermediate and junior gold stocks have barely budged.

As we have explained previously, this is not surprising given where the demand for gold has come from. Whether it is central banks, Chinese consumers worried about their economy, or global investors concerned about uncertainty amid high debt levels, these buyers will focus on bullion, not gold miners.

Stock Rotation Will Benefit Gold Stocks

We can now see the first beginnings of a turn. Finally, the largest gold equity ETF, the VanEck Gold Miners ETF (GDX), has reported some net inflows.

This was a single day in mid-March, the first and only reported net inflow this year. Though it was just $6.4 million of inflows, and the subsequent two weeks have seen $317 million in net outflows — the fund has lost $1.99 billion in assets this year — it is a small sign of an impending shift. (See table)
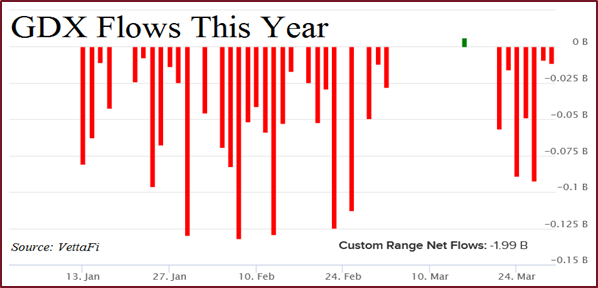
As a contrarian indicator, this is hopeful.

Further declines in the broad market will see money flow to undervalued sectors, including gold stocks. With the gold stocks having outperformed the S&P five-fold over the last year — did you read about that in The Wall Street Journal or hear it on CNBC? — With gold at record highs and mining company margins expanding, the broad investing public is going to notice sooner or later.

And despite the price moves, the valuations of the gold miners remain, in many cases, near their long-term lows.

Top Resource Sectors Have Supply Constraints

Other commodities may also do well. We favor the resources with growing demand and supply constraints.

Among these, copper and uranium stand out. The copper price has now moved above previous highs of 2010 to new all-time highs on the growing appreciation of a pending deficit by the end of this decade.
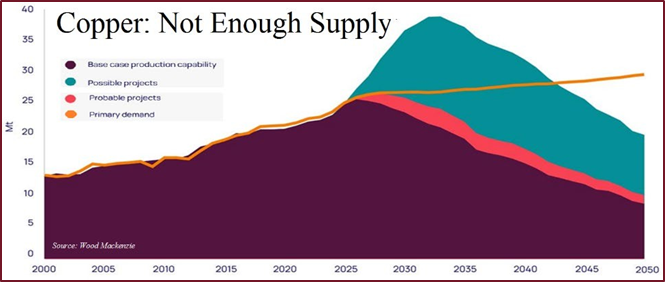
The huge potential increases in demand for copper from electrification, EVs, and AI are well known, but significantly, these uses represent only a relatively small part of the demand for copper over the next decade.

Even if EV adoption slows dramatically and the build-out for power for AI is behind us, demand for copper will continue to grow and exceed probable new supply. As we have written before, given the very long lags in bringing new copper online, the likely copper supply five or even 10 years into the future can be estimated with relative accuracy. There will not be enough copper in five years to meet demand.

The biggest risk to copper is on the demand side: a significant slowdown in China, which still purchases nearly two-thirds of the world’s copper. Longer term, there could be new technologies that speed up discovery and development, and in the U.S., the acceleration of the permitting process will bring some projects into production sooner. But none of this will meaningfully affect the global copper supply over the next five years.

Uranium Decline Is Short Term

The uranium price has declined from $95/lb to $65 over the past year. The liquidation of a physical fund (in Kazakhstan) put supply on the market somewhat indiscriminately. This came amid repeated references by the first candidate, then President Trump, to denuclearization. The last time the superpowers decommissioned nuclear warheads was in the late 1980s; it was followed by a sustained period of low uranium prices.

For various reasons, even if it were to happen, any new “Megatons to Megawatts program” would be relatively small, would be years in the future, and would be offset by increasing demand from end users amid growing realization that nuclear energy is the answer to the world’s energy problems. It is the cleanest, safest, most reliable, and lowest cost form of energy.

It must be emphasized that the decline in the uranium price is due to the spot price, which is far less significant than contract prices. Most uranium is sold on long-term contracts, since for the power plant end user, reliability of supply is more important than price.

A year ago, the spot price moved far above the contract price amid heavy speculation. As that speculative buying has unwound, the spot price is now back more-or- less to where contracts are priced, and attractive buying level once again. It should also be noted that the current uncertainty about tariffs has led to a slowdown in new contracts being signed. The need for the material remains, however, and we expect to see a pick-up in new contracts, which should see prices firm.

Overall, we are cautious about U.S. and major developed market financial assets, preferring to find attractive holdings mostly in smaller companies and smaller markets, always on a bottom- up approach. At the same time, we are increasing exposure to the commodity space, holding gold exposure while broadening the range of resources held. On balance, we expect to see cash holdings increase over the next few months as uncertainly increases.

Review of Individual Accounts

Global Accounts:

We have lowered our cash holdings in most accounts (though more conservative global accounts still have over 11% cash) as we took advantage of recent declines in global stock markets and topped up resource exposure.

Though we employ a bottom-up approach to stock picking, our largest exposures continue to be in Hong Kong and Singapore as we continue to reduce exposure to the U.S. market, including further trimming of Business Development Companies, which nonetheless remain a large holding for most accounts.

We exited a British banknote printer after a strong rally amid takeover activity. We also trimmed many stocks for various clients, depending on risk tolerance, cash levels, and overall portfolio weightings.

Adding to Japan:

With proceeds, we added to some Japanese companies in particular; the entire market seems ready for a move. And we bought two new companies, an intriguing property developer in southern Manhattan, and an innovative finance company, based in Canada, but operating both there and in the U.K. The long-term prospects for both are attractive.

Going forward, we expect to raise cash as we will be a little quicker to take profits in the current uncertain outlook, but will as always continue to look globally for quality companies that are undervalued. All global accounts retain high exposure to resources, particularly gold.

Gold Accounts:

Our gold accounts remain fully invested, with the same broad allocations to the different groups in the gold space. Allocation to large miners and senior royalty companies increased to 30% of accounts, as we added to some of the best companies for underweight accounts. The allocations to silver and exploration remained at little less than one-third each, with the rest to intermediate companies.

Other than a couple of small companies owned by few clients, we did not exit any holdings this quarter. Most of our selling was reducing positions to an intermediate that had rallied and to a large but trouble development company in Nevada. Otherwise, we trimmed various positions for different clients on rallies, mostly for clients overweight in a particular stock.

This provided us with cash to add a couple of smaller companies — a developer in an attractive part of Ontario and potential takeover target; and an exploration company in the high-potential southern Andes.

In addition, we added extensively to a U.S. company looking to bring back into production the U.S.’s most prolific historic gold mine, the Homestake mine.

Looking forward, we expect to remain fully invested, with a continued emphasis on larger, high-quality miners and royalty companies. We will continue to trim overweight positions, giving accounts cash with which to buy new opportunities. As the market develops, we will increase allocation to intermediates and smaller companies which tend to have higher potential, but usually have their strongest moves as the market matures.

Resource Accounts:

Our resource accounts are also fully invested, with gold, copper, and silver continuing to be our largest exposures. We are underweight oil and gas, but continue to add slowly to quality names on weakness, mostly in the intermediate size companies, and are also, once again, accumulating uranium holdings.

This quarter we had no wholesale sells, though did, as always, trim some positions for select clients. With cash, we added one copper company — returning to it again on stock price weakness — and have also been adding aggressively to a company with an advanced copper exploration project in Arizona.

Looking ahead, we expect to remain fully invested, with gold, copper and silver continuing to be our top individual resources, though we are also accumulating uranium again after a significant decline. Our focus is on resources with supply constraints in addition to demand growth.

In sum, with the increased uncertainly in the political and economic outlook amid a possible restructuring of the global monetary system, as the U.S. careens towards a funding crisis, it is time to be more defensive, to reduce exposure to the U.S. equity and bond markets, and increase exposure to uncorrelated global markets; to defensive stocks; and to commodities, particularly gold.

* Please note: Past performance is no guarantee of future results. For complete information on our past performance, including factors to be considered in viewing past performance and other disclosures, please contact our office. Specific stocks mentioned herein are intended solely as illustrative of strategies and types of stocks we are buying or selling, and are not intended as indicative of entire portfolios or of any individual client’s portfolio. The numbers mentioned represent our composite averages. They represent all accounts that fall within the stated objectives which have the ability to buy and sell options; they exclude accounts under $25,000 and accounts with significant limitations or restrictions that would make them unrepresentative of the account type. Performance figures for composites reflect the deduction of administrative fees, but do not take into account any performance fee that may be charged for the period stated.

The performance of any individual stock or stocks does not take into account fees. Performance numbers include dividends; dividends are not reinvested. Commissions charged may vary depending on the brokerage firm at which an individual account is held. All accounts are managed individually and are therefore different, even within the same broad objective. Factors such as an individual’s circumstances, the size of the portfolio, and the time the account opened can affect specific buy and sell decisions. Factors such as price movements and security liquidity can affect whether any trade is made for all accounts. Global Strategic Management, an SEC-registered investment advisor, does business as Adrian Day Asset Management.

 

Important Disclosures:

  1. Statements and opinions expressed are the opinions of the author and not of Streetwise Reports, Street Smart, or their officers. The author is wholly responsible for the accuracy of the statements. Streetwise Reports was not paid by the author to publish or syndicate this article. Streetwise Reports requires contributing authors to disclose any shareholdings in, or economic relationships with, companies that they write about. Any disclosures from the author can be found  below. Streetwise Reports relies upon the authors to accurately provide this information and Streetwise Reports has no means of verifying its accuracy.
  2. This article does not constitute investment advice and is not a solicitation for any investment. Streetwise Reports does not render general or specific investment advice and the information on Streetwise Reports should not be considered a recommendation to buy or sell any security. Each reader is encouraged to consult with his or her personal financial adviser and perform their own comprehensive investment research. By opening this page, each reader accepts and agrees to Streetwise Reports’ terms of use and full legal disclaimer. Streetwise Reports does not endorse or recommend the business, products, services or securities of any company.

For additional disclosures, please click here.

Adrian Day Asset Management Disclosures

Disclosure: Adrian Day Asset Management (“ADAM”) is an SEC-registered investment adviser located in San Juan, Puerto Rico. ADAM and its representatives are in compliance with the current filing requirements imposed upon SEC-registered investment advisers by those states in which ADAM maintains clients. ADAM may only transact business in those states in which it is registered or qualifies for an exemption or exclusion from registration requirements. (Note: Global Strategic Management, our legal name, is registered, or qualified to accept clients from all states and territories, including the District of Columbia.) A direct communication by ADAM with a prospective client shall be conducted by a representative that is either registered or qualifies for an exemption or exclusion from registration in the state where the prospective client resides. For information pertaining to the registration status of ADAM, please contact the SEC or the state securities regulators for those states in which ADAM maintains a notice filing. A copy of ADAM’s current written disclosure statement discussing ADAM’s business operations, services, and fees is available from ADAM upon written request. (Note, all clients receive this document prior to opening and account and are offered it annually.) ADAM does not make any representations or warranties as to the accuracy, timeliness, suitability, completeness, or relevance of any information prepared by any unaffiliated third party and takes no responsibility therefor. All such information is provided solely for convenience purposes only and all users thereof should be guided accordingly. Past performance may not be indicative of future results. Therefore, there can be no assurance (and no current or prospective client should assume) that future performance of any specific investment or investment strategy (including the investments and/or investment strategies recommended or undertaken by ADAM) made reference to directly or indirectly by ADAM will (i) be suitable or profitable for a client or prospective client’s investment portfolio or (ii) equal the corresponding indicated historical performance level(s). Different types of investments involve varying degrees of risk. Historical performance results for investment indices and/or categories generally do not reflect the deduction of transaction and/or custodial charges, the deduction of an investment management fee, or the impact of taxes. (Note, any performance number provided for Adrian Day Asset Management accounts is after the deduction of all transaction costs and fees.) The material contained herein is provided for informational purposes only and does not constitute an offer to buy or sell or a solicitation of an offer to buy or sell any option or any other security or other financial instruments. Certain content provided herein may contain a discussion of, and/or provide access to, ADAM’s positions and/or recommendations as of a specific prior date. Due to various factors, including changing market conditions, such discussion may no longer be reflective of current position(s) and/or recommendation(s). Moreover, no client or prospective client should assume that any such discussion serves as the receipt of, or a substitute for, personalized advice from ADAM, or from any other investment professional. ADAM is neither an attorney nor an accountant, and no portion of the content provided herein should be interpreted as legal, accounting, or tax advice. Rankings and/or recognition by unaffiliated rating services and/or publications should not be construed by a client or prospective client as a guarantee that he/she will experience a certain level of results if ADAM is engaged, or continues to be engaged, to provide investment advisory services, nor should it be construed as a current or past endorsement of ADAM by any of its clients. Rankings published by magazines, and others, generally base their selections exclusively on information prepared and/or submitted by the recognized adviser.