With the possibility of a Fed pivot looming, expert Clive Maund touches on his views of the precious metals sector and why he believes you should invest in it sooner rather than later.
On the 1-year chart for gold shown below, we can see precisely why it has been in a quite severe downtrend from its peak last March. It is because the dollar and interest rates, shown at the top and bottom of the chart, have been in strong uptrends during this period.
A very important point to note is that while gold has dropped about $400 from its March peak, in real terms, this decline is much more serious because of the robust inflation during this period.
So if the Fed does pivot soon, that is to say, it stops raising rates and starts lowering them, or other Central Banks start raising rates, thus reducing the dollar’s appeal.
It will mean a reversal to the downside in the dollar and to the upside in gold and commodities and risk-on assets generally, and as we saw on Friday 21st, even talk of a pivot is enough to generate a recovery.
Gold
A very important point to note is that while gold has dropped about $400 from its March peak, in real terms, this decline is much more serious because of the robust inflation during this period.
So when you talk about $1600 gold now, it means that in, say, 2019 prices, it’s probably about $1200. This gives us more of an idea about how undervalued gold and especially silver are now. Before leaving this chart, observe that gold may be making a Double Bottom here with its September lows.
The next chart, the 1-year chart for PM sector proxy GDX, is most interesting as it makes plain that, even on a log chart as this is, the downtrend in the sector from its April highs has been decelerating steadily to the point that the MACD indicator has recovered back almost to the zero line.
If this interpretation is correct, then we are at a point of huge opportunity to buy the sector before it breaks out.
This is the sort of behavior that usually precedes a reversal to the upside, so it is not surprising to see that a small Head-and-Shoulders appears to be completed within the downtrend channel, whose validity is endorsed by the bullish volume pattern that has accompanied it, with strong volume on the rise to form the right side of the Head of the pattern and again on the rise late last week as it completes what is believed to be the Right Shoulder of the pattern.
If this interpretation is correct, then we are at a point of huge opportunity to buy the sector before it breaks out.
In the context of the foregoing, it’s useful for us to consider the extent to which the PM sector has markedly underperformed even the frail stock market in recent months.
Silver is regarded as probably the most undervalued asset in the world.
On the 1-year chart for GDX over the S&P500 index, we can see that it has seriously underperformed due, of course, to the strong rise in the dollar and interest rates.
This is important because it means that the PM sector is even better value here compared to the broad market.
Alright, so if we are at or close to a bottom in gold and the PM sector, then we would expect to see the normally wrong Large Specs having Little interest in gold, and that is exactly what we see on the latest COT chart for gold, which shows that they have pretty much given up on it.
This COT chart alone augurs well for a new bull market phase in gold . . .
Silver
What about silver?
On its 1-year chart, we can see that it has dropped back from its March highs for the same reasons that gold has, the strong uptrends in the dollar, and interest rates.
This is looking like a great place to load up on the better gold and silver stocks.
However, since July, a potential base pattern has been building out that is now starting to look like a completing Triple Bottom, and with the steadily uptrending momentum (MACD) now about to swing positive, the outlook is brightening and the strong volume on the rally out of the low in the middle of the month, better seen on a 6-month chart, looks like the beginnings of a rally up towards the resistance at the upper boundary of the pattern.
Silver is regarded as probably the most undervalued asset in the world, and in the dark times that we are headed towards, physical silver is probably the best asset to have in your possession, along with some firearms to make sure that it stays in your possession.
If silver is close to an optimum point to buy, then we would expect to see the dumb Large Specs having no interest in it all, and that is exactly what we see on silver’s latest COT chart, which shows the Large Specs net long positions to be virtually non-existent . . .
It’s useful here to take a quick look at the 5-year chart for the dollar index because, on this chart, we see that it has gone parabolic in recent months, and it’s possible that it just topped out.
Two possible reasons for it to turn and break down that have already been mentioned are a “Fed pivot” and other countries or trading blocs, such as the European Union, following the Fed’s lead and raising rates too.
The U.S. Dollar and British Pound
Just for laughs, let’s take a quick look at the 5-year chart for the British Pound.
It shows that it has been terribly weak, dropping an incredible 40% in less than 18 months . . .
For U.S. readers who’ve always wanted to see the sights in Britain, and have the time and money, now is a good time to vacation there while the exchange rate is good before the Winter.
If you want ideas on what to visit, I can give you a list as long as your arm.
The Risk of a Market Crash
Finally, what about the ongoing risk of an all-out market crash? Would that not drag gold and silver, and PM stocks down even further?
Well, it could, although it may not because, this time, there will be no hiding place for investors in the Treasury market, which is already on the rocks.
So with this option closed off, funk money will probably flee into gold and silver instead. This time round is very different in that the powers that be fully intend to destroy the world economy kill off most of the population, and turn the survivors into cyborg-like slaves, and have made their intentions very clear to anyone with more than a few functioning brain cells.
This would best be achieved by a state of hyperinflation, Venezuela style, that would render the population destitute and totally at the mercy of the State (except for some preppers, who will probably be identified and rounded up anyway).
Following this logic, they will continue to create money to defer the debt market collapse for as long as possible, and the hyperinflation that will result, which we are already close to, must mean an exponential rise in the price of hard assets like gold and silver, with physical being very highly prized and hard to obtain.
The charts that we have reviewed in this update strongly suggest that, whatever the broad market does from here, the PM sector has bottomed out and is going to rally soon. An important article posted by Adam Hamilton a couple of days ago, Gold Stocks’ Winter Rally 7, strongly supports this contention.
Although long, this common sense article presents reasoned arguments based on his many years of experience with this sector and should thus be taken seriously.
Conclusion — This is looking like a great place to load up on the better gold and silver stocks.
CliveMaund.com Disclosures
The above represents the opinion and analysis of Mr. Maund, based on data available to him, at the time of writing. Mr. Maund’s opinions are his own, and are not a recommendation or an offer to buy or sell securities. Mr. Maund is an independent analyst who receives no compensation of any kind from any groups, individuals or corporations mentioned in his reports. As trading and investing in any financial markets may involve serious risk of loss, Mr. Maund recommends that you consult with a qualified investment advisor, one licensed by appropriate regulatory agencies in your legal jurisdiction and do your own due diligence and research when making any kind of a transaction with financial ramifications. Although a qualified and experienced stock market analyst, Clive Maund is not a Registered Securities Advisor. Therefore Mr. Maund’s opinions on the market and stocks can only be construed as a solicitation to buy and sell securities when they are subject to the prior approval and endorsement of a Registered Securities Advisor operating in accordance with the appropriate regulations in your area of jurisdiction.
Disclosures: 1) Statements and opinions expressed are the opinions of Clive Maund and not of Streetwise Reports or its officers. The author is wholly responsible for the validity of the statements. Streetwise Reports was not involved in any aspect of the article preparation. The author was not paid by Streetwise Reports LLC for this article. Streetwise Reports was not paid by the author to publish or syndicate this article.
2) This article does not constitute investment advice. Each reader is encouraged to consult with his or her individual financial professional and any action a reader takes as a result of information presented here is his or her own responsibility. By opening this page, each reader accepts and agrees to Streetwise Reports’ terms of use and full legal disclaimer. This article is not a solicitation for investment. Streetwise Reports does not render general or specific investment advice and the information on Streetwise Reports should not be considered a recommendation to buy or sell any security. Streetwise Reports does not endorse or recommend the business, products, services or securities of any company mentioned on Streetwise Reports.
3) From time to time, Streetwise Reports LLC and its directors, officers, employees or members of their families, as well as persons interviewed for articles and interviews on the site, may have a long or short position in securities mentioned. Directors, officers, employees or members of their immediate families are prohibited from making purchases and/or sales of those securities in the open market or otherwise from the time of the decision to publish an article until three business days after the publication of the article. The foregoing prohibition does not apply to articles that in substance only restate previously published company releases.
An uneasy calm settled across financial markets ahead of the Federal Reserve’s policy meeting this evening. Equities struggled for direction; the dollar index remained static while gold prices were little changed.
Sentiment in general remains shaky and fragile thanks to concerns over slowing global growth with investors adopting a guarded approach ahead of what could be a volatile event. Markets widely expect the Federal Reserve to raise interest rates by 75bp in November but much attention will be directed towards the press conference which could offer fresh clues into monetary policy.
Our focus this afternoon will be directed toward the global equity arena, especially US indices which remain highly reactive to Fed rate hike expectations.
S&P 500 tangled between MA’s
After failing to secure a daily close above the 100-day SMA, the S&P 500 has the potential to trade lower if the 50-day SMA is breached. A strong breakdown below 3810 could trigger a selloff towards 3760 and 3700, respectively. Should 3810 prove to be reliable support, prices could rebound towards 3945 and 4000. It is worth keeping in mind that the short-term outlook will be influenced by the Fed meeting this evening and the US jobs report on Friday.
Nasdaq trapped below 11650?
It looks like the Nasdaq could gearing up for a selloff. After failing to break above the 11650 resistances, prices have tumbled with bears eyeing the 11037 supports. The Fed rate decision and press conference may influence the Nasdaq’s short-term outlook. Technical levels to watch out for are 11037 and 10716. Given how prices are trading below the 50, 100, and 200 Simple Moving Average – bears still have some power. A strong break under 10716 could signal a selloff towards 10436.
FTSE100 lingers below resistance
Since punching above the 7200-resistance level, prices have struggled to push higher as the 100-day Simple Moving Average offered another line of resistance. Although the FTSE100 has staged a rebound from the 6705 regions, prices still remain in a bearish channel. Should 7200 prove to be a tough nut to crack for bulls, prices could sink back towards 7000. Alternatively, a strong breakout above 7200 may open the doors towards 7340 – a level where the 200-day SMA resides.
EURO STOXX 50 breakout or fakeout?
This index remains in an uptrend on the daily charts as there have been consistently higher highs and higher lows. Prices are trading above the 50 and 100-day SMA but below the 200-day which could offer strong resistance. If bulls lose momentum and secure a solid daily close below 3650, this may trigger a selloff back towards 3550 – a level just above the 100-day SMA. Alternatively, a strong daily close above the 3685 regions could inject bulls with enough confidence to push above the 200-day SMA. Such a development may result in an incline towards 3700, 3770, and 3820, respectively.
Pushing up interest rates isn’t something the Reserve Bank does lightly.
But what’s worrying the Reserve Bank – and why it increased interest rates for a record seventh consecutive month on Melbourne Cup Tuesday – is that inflation seems to become completely detached from the bank’s target band.
That target band of 2-3% was introduced in the early 1990s, at a time when that’s where inflation was. With one brief exception during the introduction of the goods and services tax, at the start of the 2000s, inflation has never since been far away from the band – until now.
The jump in inflation from 6.1% to 7.3%, revealed last Wednesday, made it clear that, even after six consecutive interest rate hikes, inflation was further away from the Bank’s target band than it had ever been.
Inflation breaks free of the target band
Annual increases in the consumer price index. The RBA’s 2-3% inflation target band was adopted in the early 1990s. ABS
When the Reserve Bank began hiking its so-called cash rate during the May election campaign, the National Australia Bank’s standard variable mortgage rate was 3.45%. It’s now 5.95% and about to go to 6.2%.
For a borrower with a $500,000 mortgage, the increase in payments amounts to $800 per month. For a borrower on a fixed-rate loan of 2% that’s about to expire, the burden will be even greater.
So the Reserve Bank wants to be sure the jump in inflation to 7.3% is real.
How the cost of buying a home skews inflation
The first thing to say is that 7.3% is almost the real thing, but not quite.
The Bureau of Statistics collects information on millions of prices per week, at times by going into stores in eight cities and noting down what’s on price tags, at times by direct feeds from supermarkets, petrol stations and electricity suppliers, and at times by “scraping” prices quoted on the web for home deliveries.
The bureau categorises the things it prices as either essential or non-essential (its words are “non-discretionary” and “discretionary”).
It’s found that the prices of essential items (those we generally have to buy) climbed by more than 7.3% in the year to September – by an extraordinary 8.4% – whereas the prices of things we generally don’t need climbed 5.5%.
For obvious reasons, food is among the bureau’s list of essential or “non-discretionary” items. Food prices continue to be pushed up by floods and labour shortages.
But what many people don’t realise is that also among that list of supposedly “non-discertionary” items is one type of purchase people don’t make often – and which some of Australians will never make.
Buying a home is so expensive compared to the other things we buy (such as bread and milk) that it accounts for almost 9% of the consumer price index.
Worse still, being classified as essential, it makes up almost 15% of the “essentials” index, even though for most of us in any given year buying a home is optional.
In most years, this anomaly doesn’t matter much. The price of a new home (what’s priced is only the construction of the home, not the land) climbs pretty much in line with everything else.
But building material shortages, COVID-induced labour shortages, and an explosion in demand for building fed by the government’s HomeBuilder grant have pushed up the price of new dwellings by an astonishing 20.7% in the past year. That’s enough to add an awful lot to the reported rate of inflation.
The real cost of living is probably up 6%
A rough calculation suggests Australia’s inflation rate would be 6%, instead of 7.3%, if the price of new homes didn’t have such an outsized influence.
We will know more by mid-Wednesday. The bureau actually produces separate living cost indexes a week after the consumer price index that substitute mortgage payments for the cost of home-building.
Lately these indexes have been pointing to increases one to two percentage points below the official rate of inflation.
Accurately measuring rent rises
Another peculiarity is that the rent increases recorded in the consumer price index are so far below those we keep hearing about.
The bureau says in the year to September, average capital city rents climbed just 2.8%, compared to the figures of 10%, and in some suburbs, 20%, quoted by real estate analysts.
In part, this is because the bureau only reports capital city rents. But more importantly it is because it does its job better than real estate analysts.
It collects data on not only the rents that are advertised (these are climbing strongly), but also on the hundreds of thousands of rents paid by continuing renters, which either aren’t climbing at all or aren’t climbing as strongly.
The water in the tub represents all rents being paid by households, while the water entering the tub from the tap represents new rental agreements. The consumer price index is measuring the overall temperature of the bathtub whereas an advertised rents series measures the temperature of the water flowing into the tub.
Worse news ahead
Perhaps surprisingly, the bureau finds the average retail price of electricity only climbed 3.2% in the year to September, and the price of gas by only 16.6%, much less than the 56% and 44% mentioned in last week’s federal budget.
But the budget numbers were predictions of what’ll happen over the next two years unless the government provides relief. The bureau was telling us what has happened.
Which is why the Reserve Bank is worried. While gas and electricity prices will subside eventually, inflation is likely to climb even higher before it falls – the bank says to around 8%.
The way back to the target band of 2-3% is anything but clear. That means for homebuyers, there’s no relief in sight just yet.
The war against inflation remains fierce and relentless.
Central banks across the world are on the offensive, unleashing aggressive rate hikes despite the growing risks of collateral damage to their respective economies.
Last week, the Bank of Canada (BoC) announced a smaller-than-expected hike of 50bp as recession fears intensified. However, the European Central Bank (ECB) hiked rates by 75 basis points for the second consecutive time thanks to soaring inflation in the Euro Area.
Over the next few days, the Federal Reserve is poised to raise rates by 75 basis points for the fourth consecutive time while the Bank of England could finally join the jumbo hike club!
Before we take a deep dive into what to expect from the BoE on Thursday, it’s safe to say that the past few weeks have been wild for not only the UK economy but Pound. A toxic combination of political drama and central bank intervention sent the GBPUSD on a chaotic roller-coaster ride.
After making a swift recovery in recent days, the GBPUSD is trading back above 1.15 for the first time in 6 weeks. This move has been the product of dollar weakness and improving sentiment toward the UK economy after Rishi Sunak became Prime Minister. The currency pair will most likely be influenced by the Fed rate decision on Wednesday and the BoE meeting on Thursday.
The low down…
The Bank of England remains in a tricky position as it potentially delivers what would be the biggest UK rate hike in 33 years.
Sentiment towards the UK economy is fragile due to fears that the country is probably already in a recession while the recent political drama over ex-Prime Minister Liz Truss’s controversial mini-budget has left a bitter aftertaste. With inflation through the roof at 10.1%, expectations remain elevated over the Bank of England joining the heavy hitters by unleashing a 75bp monetary policy bazooka. However, recent economic data including retail sales, monthly GDP, and manufacturing data among many others have shown signs of a slowing economy.
At the peak of the political crisis when the pound tumbled to an all-time low, markets were pricing in a gargantuan 200 basis point hike in November. But with some normality returning to UK markets and sterling staging a strong recovery, BoE rate hike expectations have cooled.
Although according to Bloomberg, traders have fully priced in a 75bp rate hike at the BoE’s November meeting – expectations can differ from reality.
Other things to watch out for…
Mid-week, the Federal Reserve is expected to raise interest rates by 75 basis points. Given how such a move has already been priced, much attention will be on the press conference for clues on future monetary policy. Should the central bank strike a cautious tone with doves entering the scene, this could weaken the dollar as aggressive rate hike bets cool. A weaker dollar may push the GBPUSD higher ahead of the BoE meeting on Thursday 3rd November.
Possible outcomes of BoE meeting
BoE hikes rates by 75-basis points. This decision could inject some life into pound bulls but gains may be limited if the central bank signals that this is a “one-off” move. Expect the pound to weaken eventually as expectations rise over the BoE adopting a less aggressive approach towards rates beyond November and 2023.
BoE hikes rate by 50-basis points. This decision could be based on the gloomy macroeconomic decisions and fears of the UK already entering a recession. Such a move could trigger a pound selloff as the BoE rejects the 75bp club membership.
Unlikely outcomes of BoE meeting
BoE hikes rates by 100 basis points. Given how UK inflation remains at a 40-year high, the central bank decides to go full-auto to contain rising prices. Pound is likely to rally aggressively following such a move but the upside may be capped by recession fears.
GBPUSD to breakout or breakdown?
The next few days could be volatile for the GBPUSD thanks to the Fed & BoE policy meetings.
Fundamentally, the GBPUSD remains bearish but the technicals could be singing a different tune. Prices are trading above 1.1500 due to the recent weakness in the USD as traders bet over the Fed slowing the pace of rate hikes. Should 1.1500 prove to be reliable support a move back towards 1.1750 and 1.1850 could be on the cards. If bears succeed in dragging the GBPUSD back under 1.1500, the first point of interest can be found at 1.1400 where the 50-day SMA resides. Below this point, prices could sink towards 1.1200 and 1.0925.
Here are the latest charts and statistics for the Commitment of Traders (COT) data published by the Commodities Futures Trading Commission (CFTC).
The latest COT data is updated through Tuesday October 25th and shows a quick view of how large market participants (for-profit speculators and commercial traders) were positioned in the futures markets. All currency positions are in direct relation to the US dollar where, for example, a bet for the euro is a bet that the euro will rise versus the dollar while a bet against the euro will be a bet that the euro will decline versus the dollar.
Weekly Speculator Changes led by Mexican Peso & Euro
The COT currency market speculator bets were mostly higher this week as seven out of the eleven currency markets we cover had higher positioning while the other four markets had lower speculator contracts.
Leading the gains for the currency markets was the Mexican peso (34,868 contracts) with the Euro (26,759 contracts), the New Zealand dollar (5,561 contracts), the British pound sterling (3,406 contracts), the Brazilian real (2,681 contracts), the Canadian dollar (2,418 contracts) and Bitcoin (1 contracts) also showing positive weeks.
The currencies leading the declines in speculator bets this week were the Australian dollar (-16,087 contracts) with the Japanese yen (-8,282 contracts), the Swiss franc (-4,214 contracts) and the US Dollar Index (-2,592 contracts) also registering lower bets on the week.
Highlighting the COT currency positioning this week is the further push higher for the Euro speculators. The large speculator position in Euro futures jumped again this week and is higher for the seventh time in the past eight weeks. This week’s rise by over +26,000 contracts follows a gain by over +10,000 contracts last week. The past eight-week gains for Euro speculator bets now stands at +122,585 contracts and the current bullish position (+74,909 contracts currently) is at the most bullish level in 68-weeks, dating back to July 6th of 2021.
The strong bullishness in the Euro is despite the Euro price remaining at parity against the US Dollar (near 20-year lows). The European Central Bank raised their interest rate by 75 basis points on Thursday to try and offset high inflation in the Eurozone and brought the interest rate differential with the US Dollar a little narrower. Going forward, this divergence in the speculator positioning and the weak Euro price brings up some interesting questions. Does the sharply improving speculator sentiment foreshadow an improvement in the Euro price or will it set up a short squeeze with prices going lower if the speculators throw in the towel and bail out of their bullish bets?
Brazilian Real, Bitcoin and US Dollar Index lead Strength Scores
Strength Scores (a normalized measure of Speculator positions over a 3-Year range, from 0 to 100 where above 80 is extreme bullish and below 20 is extreme bearish) showed that Brazilian Real (79.1 percent), Bitcoin (77.3 percent) and the US Dollar Index (75.1 percent) lead the currency markets near the top of their respective ranges. The EuroFX (58.0 percent) comes in as the next highest in the currency markets in strength scores and above the 50 percent level.
On the downside, the Japanese Yen (5.7 percent) comes in at the lowest strength level currently and is in an extreme bearish position below 20 percent.
Strength Statistics: US Dollar Index (75.1 percent) vs US Dollar Index previous week (79.5 percent) EuroFX (58.0 percent) vs EuroFX previous week (49.8 percent) British Pound Sterling (28.0 percent) vs British Pound Sterling previous week (25.0 percent) Japanese Yen (5.7 percent) vs Japanese Yen previous week (10.8 percent) Swiss Franc (27.8 percent) vs Swiss Franc previous week (38.5 percent) Canadian Dollar (19.0 percent) vs Canadian Dollar previous week (16.3 percent) Australian Dollar (37.1 percent) vs Australian Dollar previous week (52.1 percent) New Zealand Dollar (46.5 percent) vs New Zealand Dollar previous week (36.6 percent) Mexican Peso (32.7 percent) vs Mexican Peso previous week (17.8 percent) Brazilian Real (79.1 percent) vs Brazilian Real previous week (76.4 percent) Bitcoin (77.3 percent) vs Bitcoin previous week (77.3 percent)
Euro leads the Strength Trends
Strength Score Trends (or move index, calculates the 6-week changes in strength scores) show that the EuroFX (26.6 percent) leads the past six weeks trends for the currency markets this week. The British Pound Sterling (17.4 percent), the Mexican Peso (16.2 percent) and the Australian Dollar (5.9 percent) fill out the other positive movers in the latest trends data.
The Canadian Dollar (-34.3 percent) leads the downside trend scores currently while the next market with lower trend scores were the New Zealand Dollar (-13.5 percent), Japanese Yen (-13.5 percent) and the Swiss Franc (-10.1 percent).
Strength Trend Statistics: US Dollar Index (-9.3 percent) vs US Dollar Index previous week (-5.7 percent) EuroFX (26.6 percent) vs EuroFX previous week (25.9 percent) British Pound Sterling (17.4 percent) vs British Pound Sterling previous week (-0.7 percent) Japanese Yen (-13.5 percent) vs Japanese Yen previous week (-22.3 percent) Swiss Franc (-10.1 percent) vs Swiss Franc previous week (-7.7 percent) Canadian Dollar (-34.3 percent) vs Canadian Dollar previous week (-43.2 percent) Australian Dollar (5.9 percent) vs Australian Dollar previous week (19.6 percent) New Zealand Dollar (-13.5 percent) vs New Zealand Dollar previous week (-28.0 percent) Mexican Peso (16.2 percent) vs Mexican Peso previous week (3.1 percent) Brazilian Real (-3.7 percent) vs Brazilian Real previous week (-4.3 percent) Bitcoin (-1.8 percent) vs Bitcoin previous week (-22.7 percent)
Individual COT Forex Markets:
US Dollar Index Futures:
The US Dollar Index large speculator standing this week equaled a net position of 30,098 contracts in the data reported through Tuesday. This was a weekly lowering of -2,592 contracts from the previous week which had a total of 32,690 net contracts.
This week’s current strength score (the trader positioning range over the past three years, measured from 0 to 100) shows the speculators are currently Bullish with a score of 75.1 percent. The commercials are Bearish with a score of 21.2 percent and the small traders (not shown in chart) are Bullish with a score of 63.1 percent.
US DOLLAR INDEX Statistics
SPECULATORS
COMMERCIALS
SMALL TRADERS
– Percent of Open Interest Longs:
76.2
9.5
11.7
– Percent of Open Interest Shorts:
25.2
67.6
4.5
– Net Position:
30,098
-34,360
4,262
– Gross Longs:
44,998
5,587
6,921
– Gross Shorts:
14,900
39,947
2,659
– Long to Short Ratio:
3.0 to 1
0.1 to 1
2.6 to 1
NET POSITION TREND:
– Strength Index Score (3 Year Range Pct):
75.1
21.2
63.1
– Strength Index Reading (3 Year Range):
Bullish
Bearish
Bullish
NET POSITION MOVEMENT INDEX:
– 6-Week Change in Strength Index:
-9.3
6.4
17.0
Euro Currency Futures:
The Euro Currency large speculator standing this week equaled a net position of 74,909 contracts in the data reported through Tuesday. This was a weekly increase of 26,759 contracts from the previous week which had a total of 48,150 net contracts.
This week’s current strength score (the trader positioning range over the past three years, measured from 0 to 100) shows the speculators are currently Bullish with a score of 58.0 percent. The commercials are Bearish with a score of 49.4 percent and the small traders (not shown in chart) are Bearish-Extreme with a score of 9.2 percent.
EURO Currency Statistics
SPECULATORS
COMMERCIALS
SMALL TRADERS
– Percent of Open Interest Longs:
34.0
52.0
11.4
– Percent of Open Interest Shorts:
22.8
66.1
8.5
– Net Position:
74,909
-93,832
18,923
– Gross Longs:
226,734
346,949
75,890
– Gross Shorts:
151,825
440,781
56,967
– Long to Short Ratio:
1.5 to 1
0.8 to 1
1.3 to 1
NET POSITION TREND:
– Strength Index Score (3 Year Range Pct):
58.0
49.4
9.2
– Strength Index Reading (3 Year Range):
Bullish
Bearish
Bearish-Extreme
NET POSITION MOVEMENT INDEX:
– 6-Week Change in Strength Index:
26.6
-23.4
-6.9
British Pound Sterling Futures:
The British Pound Sterling large speculator standing this week equaled a net position of -47,805 contracts in the data reported through Tuesday. This was a weekly boost of 3,406 contracts from the previous week which had a total of -51,211 net contracts.
This week’s current strength score (the trader positioning range over the past three years, measured from 0 to 100) shows the speculators are currently Bearish with a score of 28.0 percent. The commercials are Bullish with a score of 79.3 percent and the small traders (not shown in chart) are Bearish with a score of 21.2 percent.
BRITISH POUND Statistics
SPECULATORS
COMMERCIALS
SMALL TRADERS
– Percent of Open Interest Longs:
16.8
73.0
8.1
– Percent of Open Interest Shorts:
35.3
47.3
15.4
– Net Position:
-47,805
66,560
-18,755
– Gross Longs:
43,511
189,146
21,012
– Gross Shorts:
91,316
122,586
39,767
– Long to Short Ratio:
0.5 to 1
1.5 to 1
0.5 to 1
NET POSITION TREND:
– Strength Index Score (3 Year Range Pct):
28.0
79.3
21.2
– Strength Index Reading (3 Year Range):
Bearish
Bullish
Bearish
NET POSITION MOVEMENT INDEX:
– 6-Week Change in Strength Index:
17.4
-14.1
0.9
Japanese Yen Futures:
The Japanese Yen large speculator standing this week equaled a net position of -102,618 contracts in the data reported through Tuesday. This was a weekly decline of -8,282 contracts from the previous week which had a total of -94,336 net contracts.
This week’s current strength score (the trader positioning range over the past three years, measured from 0 to 100) shows the speculators are currently Bearish-Extreme with a score of 5.7 percent. The commercials are Bullish-Extreme with a score of 93.3 percent and the small traders (not shown in chart) are Bearish with a score of 22.0 percent.
JAPANESE YEN Statistics
SPECULATORS
COMMERCIALS
SMALL TRADERS
– Percent of Open Interest Longs:
13.8
75.2
9.4
– Percent of Open Interest Shorts:
51.4
31.9
15.0
– Net Position:
-102,618
118,082
-15,464
– Gross Longs:
37,579
205,120
25,555
– Gross Shorts:
140,197
87,038
41,019
– Long to Short Ratio:
0.3 to 1
2.4 to 1
0.6 to 1
NET POSITION TREND:
– Strength Index Score (3 Year Range Pct):
5.7
93.3
22.0
– Strength Index Reading (3 Year Range):
Bearish-Extreme
Bullish-Extreme
Bearish
NET POSITION MOVEMENT INDEX:
– 6-Week Change in Strength Index:
-13.5
9.6
4.4
Swiss Franc Futures:
The Swiss Franc large speculator standing this week equaled a net position of -11,300 contracts in the data reported through Tuesday. This was a weekly reduction of -4,214 contracts from the previous week which had a total of -7,086 net contracts.
This week’s current strength score (the trader positioning range over the past three years, measured from 0 to 100) shows the speculators are currently Bearish with a score of 27.8 percent. The commercials are Bullish-Extreme with a score of 80.4 percent and the small traders (not shown in chart) are Bearish-Extreme with a score of 17.4 percent.
SWISS FRANC Statistics
SPECULATORS
COMMERCIALS
SMALL TRADERS
– Percent of Open Interest Longs:
11.9
68.3
19.5
– Percent of Open Interest Shorts:
36.1
18.6
45.0
– Net Position:
-11,300
23,161
-11,861
– Gross Longs:
5,538
31,843
9,097
– Gross Shorts:
16,838
8,682
20,958
– Long to Short Ratio:
0.3 to 1
3.7 to 1
0.4 to 1
NET POSITION TREND:
– Strength Index Score (3 Year Range Pct):
27.8
80.4
17.4
– Strength Index Reading (3 Year Range):
Bearish
Bullish-Extreme
Bearish-Extreme
NET POSITION MOVEMENT INDEX:
– 6-Week Change in Strength Index:
-10.1
10.6
-9.0
Canadian Dollar Futures:
The Canadian Dollar large speculator standing this week equaled a net position of -18,155 contracts in the data reported through Tuesday. This was a weekly gain of 2,418 contracts from the previous week which had a total of -20,573 net contracts.
This week’s current strength score (the trader positioning range over the past three years, measured from 0 to 100) shows the speculators are currently Bearish-Extreme with a score of 19.0 percent. The commercials are Bullish-Extreme with a score of 83.8 percent and the small traders (not shown in chart) are Bearish with a score of 30.3 percent.
CANADIAN DOLLAR Statistics
SPECULATORS
COMMERCIALS
SMALL TRADERS
– Percent of Open Interest Longs:
24.8
51.6
21.7
– Percent of Open Interest Shorts:
37.5
39.1
21.6
– Net Position:
-18,155
18,053
102
– Gross Longs:
35,607
74,064
31,123
– Gross Shorts:
53,762
56,011
31,021
– Long to Short Ratio:
0.7 to 1
1.3 to 1
1.0 to 1
NET POSITION TREND:
– Strength Index Score (3 Year Range Pct):
19.0
83.8
30.3
– Strength Index Reading (3 Year Range):
Bearish-Extreme
Bullish-Extreme
Bearish
NET POSITION MOVEMENT INDEX:
– 6-Week Change in Strength Index:
-34.3
26.3
-1.9
Australian Dollar Futures:
The Australian Dollar large speculator standing this week equaled a net position of -51,446 contracts in the data reported through Tuesday. This was a weekly decrease of -16,087 contracts from the previous week which had a total of -35,359 net contracts.
This week’s current strength score (the trader positioning range over the past three years, measured from 0 to 100) shows the speculators are currently Bearish with a score of 37.1 percent. The commercials are Bullish with a score of 68.4 percent and the small traders (not shown in chart) are Bearish-Extreme with a score of 16.2 percent.
AUSTRALIAN DOLLAR Statistics
SPECULATORS
COMMERCIALS
SMALL TRADERS
– Percent of Open Interest Longs:
19.3
69.1
9.0
– Percent of Open Interest Shorts:
50.1
29.4
17.9
– Net Position:
-51,446
66,319
-14,873
– Gross Longs:
32,159
115,337
15,022
– Gross Shorts:
83,605
49,018
29,895
– Long to Short Ratio:
0.4 to 1
2.4 to 1
0.5 to 1
NET POSITION TREND:
– Strength Index Score (3 Year Range Pct):
37.1
68.4
16.2
– Strength Index Reading (3 Year Range):
Bearish
Bullish
Bearish-Extreme
NET POSITION MOVEMENT INDEX:
– 6-Week Change in Strength Index:
5.9
-0.5
-13.9
New Zealand Dollar Futures:
The New Zealand Dollar large speculator standing this week equaled a net position of -12,884 contracts in the data reported through Tuesday. This was a weekly increase of 5,561 contracts from the previous week which had a total of -18,445 net contracts.
This week’s current strength score (the trader positioning range over the past three years, measured from 0 to 100) shows the speculators are currently Bearish with a score of 46.5 percent. The commercials are Bullish with a score of 58.9 percent and the small traders (not shown in chart) are Bearish-Extreme with a score of 12.5 percent.
NEW ZEALAND DOLLAR Statistics
SPECULATORS
COMMERCIALS
SMALL TRADERS
– Percent of Open Interest Longs:
30.9
62.4
5.9
– Percent of Open Interest Shorts:
56.3
30.2
12.6
– Net Position:
-12,884
16,289
-3,405
– Gross Longs:
15,639
31,568
2,983
– Gross Shorts:
28,523
15,279
6,388
– Long to Short Ratio:
0.5 to 1
2.1 to 1
0.5 to 1
NET POSITION TREND:
– Strength Index Score (3 Year Range Pct):
46.5
58.9
12.5
– Strength Index Reading (3 Year Range):
Bearish
Bullish
Bearish-Extreme
NET POSITION MOVEMENT INDEX:
– 6-Week Change in Strength Index:
-13.5
11.2
8.1
Mexican Peso Futures:
The Mexican Peso large speculator standing this week equaled a net position of 12,574 contracts in the data reported through Tuesday. This was a weekly gain of 34,868 contracts from the previous week which had a total of -22,294 net contracts.
This week’s current strength score (the trader positioning range over the past three years, measured from 0 to 100) shows the speculators are currently Bearish with a score of 32.7 percent. The commercials are Bullish with a score of 64.5 percent and the small traders (not shown in chart) are Bullish with a score of 73.7 percent.
MEXICAN PESO Statistics
SPECULATORS
COMMERCIALS
SMALL TRADERS
– Percent of Open Interest Longs:
64.9
31.6
3.4
– Percent of Open Interest Shorts:
59.9
39.6
0.5
– Net Position:
12,574
-19,809
7,235
– Gross Longs:
161,558
78,742
8,379
– Gross Shorts:
148,984
98,551
1,144
– Long to Short Ratio:
1.1 to 1
0.8 to 1
7.3 to 1
NET POSITION TREND:
– Strength Index Score (3 Year Range Pct):
32.7
64.5
73.7
– Strength Index Reading (3 Year Range):
Bearish
Bullish
Bullish
NET POSITION MOVEMENT INDEX:
– 6-Week Change in Strength Index:
16.2
-17.2
13.5
Brazilian Real Futures:
The Brazilian Real large speculator standing this week equaled a net position of 29,179 contracts in the data reported through Tuesday. This was a weekly advance of 2,681 contracts from the previous week which had a total of 26,498 net contracts.
This week’s current strength score (the trader positioning range over the past three years, measured from 0 to 100) shows the speculators are currently Bullish with a score of 79.1 percent. The commercials are Bearish with a score of 20.5 percent and the small traders (not shown in chart) are Bullish-Extreme with a score of 93.0 percent.
BRAZIL REAL Statistics
SPECULATORS
COMMERCIALS
SMALL TRADERS
– Percent of Open Interest Longs:
72.9
16.1
8.6
– Percent of Open Interest Shorts:
6.1
88.5
3.1
– Net Position:
29,179
-31,590
2,411
– Gross Longs:
31,835
7,041
3,746
– Gross Shorts:
2,656
38,631
1,335
– Long to Short Ratio:
12.0 to 1
0.2 to 1
2.8 to 1
NET POSITION TREND:
– Strength Index Score (3 Year Range Pct):
79.1
20.5
93.0
– Strength Index Reading (3 Year Range):
Bullish
Bearish
Bullish-Extreme
NET POSITION MOVEMENT INDEX:
– 6-Week Change in Strength Index:
-3.7
2.9
9.2
Bitcoin Futures:
The Bitcoin large speculator standing this week equaled a net position of 23 contracts in the data reported through Tuesday. This was a weekly advance of 1 contracts from the previous week which had a total of 22 net contracts.
This week’s current strength score (the trader positioning range over the past three years, measured from 0 to 100) shows the speculators are currently Bullish with a score of 77.3 percent. The commercials are Bearish with a score of 46.1 percent and the small traders (not shown in chart) are Bearish with a score of 21.1 percent.
BITCOIN Statistics
SPECULATORS
COMMERCIALS
SMALL TRADERS
– Percent of Open Interest Longs:
74.6
4.0
7.9
– Percent of Open Interest Shorts:
74.5
6.6
5.5
– Net Position:
23
-380
357
– Gross Longs:
11,084
601
1,176
– Gross Shorts:
11,061
981
819
– Long to Short Ratio:
1.0 to 1
0.6 to 1
1.4 to 1
NET POSITION TREND:
– Strength Index Score (3 Year Range Pct):
77.3
46.1
21.1
– Strength Index Reading (3 Year Range):
Bullish
Bearish
Bearish
NET POSITION MOVEMENT INDEX:
– 6-Week Change in Strength Index:
-1.8
-2.9
3.7
Article By InvestMacro – Receive our weekly COT Newsletter
*COT Report: The COT data, released weekly to the public each Friday, is updated through the most recent Tuesday (data is 3 days old) and shows a quick view of how large speculators or non-commercials (for-profit traders) were positioned in the futures markets.
The CFTC categorizes trader positions according to commercial hedgers (traders who use futures contracts for hedging as part of the business), non-commercials (large traders who speculate to realize trading profits) and nonreportable traders (usually small traders/speculators) as well as their open interest (contracts open in the market at time of reporting). See CFTC criteria here.
Here are the latest charts and statistics for the Commitment of Traders (COT) data published by the Commodities Futures Trading Commission (CFTC).
The latest COT data is updated through Tuesday October 25th and shows a quick view of how large traders (for-profit speculators and commercial entities) were positioned in the futures markets.
Copper and Platinum lead Weekly Speculator Changes
The COTprecious metals speculator bets were lower this week as two out of the five metals markets we cover had higher positioning this week while three markets had lower contracts.
Leading the gains for the precious metals markets was Copper (3,383 contracts) with Platinum (2,887 contracts) also showing a positive week.
The metals markets leading the declines in speculator bets this week was Gold (-8,924 contracts) with Silver (-1,368 contracts) and Palladium (-536 contracts) also registering lower bets on the week.
Highlighting the COT metals data this week is the decline in the speculators positions for Silver. The large speculators dropped their Silver bets for the third straight week following gains in the previous four weeks. This has brought the overall net position back into a small bearish standing this week (-101 contracts) for the first time in the past five weeks. Previously, the Silver net positioning had spent five weeks from August 23rd to September 20th in bearish territory before seeing speculator positions improve and regain their bullishness on September 27th.
The Silver price, like the other precious metals, remains under pressure and saw a small decline this week. The futures price trades around the $19.15 level and has been in a range between $18 and $20 over the past three weeks.
Data Snapshot of Commodity Market Traders | Columns Legend
Oct-25-2022
OI
OI-Index
Spec-Net
Spec-Index
Com-Net
COM-Index
Smalls-Net
Smalls-Index
WTI Crude
1,436,942
0
249,079
10
-268,026
92
18,947
32
Gold
456,072
7
68,032
5
-80,213
94
12,181
10
Silver
139,085
12
-101
14
-8,857
87
8,958
14
Copper
179,344
17
-16,919
23
15,907
79
1,012
31
Palladium
7,343
7
-1,745
14
2,228
87
-483
13
Platinum
56,117
15
11,381
24
-14,971
77
3,590
16
Natural Gas
970,872
5
-151,766
33
133,397
73
18,369
24
Brent
166,931
14
-40,301
44
36,912
55
3,389
55
Heating Oil
272,663
25
20,411
72
-38,238
31
17,827
60
Soybeans
651,685
17
57,385
31
-35,301
76
-22,084
34
Corn
1,445,842
25
329,784
72
-273,645
33
-56,139
11
Coffee
208,280
18
11,351
37
-13,326
68
1,975
27
Sugar
723,503
6
111,888
59
-140,147
43
28,259
43
Wheat
324,137
16
-12,913
2
19,896
88
-6,983
74
Strength Scores led by Platinum and Copper
Strength scores (a measure of the 3-Year range of Speculator positions, from 0 to 100 where above 80 is extreme bullish and below 20 is extreme bearish) show that Platinum (24.4 percent) and Copper (22.9 percent) lead the metals category.
On the downside, Gold (5.3 percent), Palladium (13.6 percent) and Silver (14.0 percent) are at the lowest strength levels currently and all are in extreme bearish positions (below 20 percent).
Strength Statistics: Gold (5.3 percent) vs Gold previous week (8.2 percent) Silver (14.0 percent) vs Silver previous week (15.5 percent) Copper (22.9 percent) vs Copper previous week (20.2 percent) Platinum (24.4 percent) vs Platinum previous week (20.5 percent) Palladium (13.6 percent) vs Palladium previous week (16.7 percent)
Platinum leads the Strength Trends
Strength Score Trends (or move index, calculates the 6-week changes in strength scores) show that Platinum (17.8 percent) leads the past six weeks trends for metals this week. Silver (5.0 percent) and Copper (1.6 percent) fill out the other positive movers in the latest trends data.
Gold (-9.7 percent) leads the downside trend scores currently while the next market with lower trend scores was Palladium (-2.8 percent).
Move Statistics: Gold (-9.7 percent) vs Gold previous week (-8.9 percent) Silver (5.0 percent) vs Silver previous week (15.5 percent) Copper (1.6 percent) vs Copper previous week (2.9 percent) Platinum (17.8 percent) vs Platinum previous week (20.5 percent) Palladium (-2.8 percent) vs Palladium previous week (2.3 percent)
Individual Markets:
Gold Comex Futures:
The Gold Comex Futures large speculator standing this week reached a net position of 68,032 contracts in the data reported through Tuesday. This was a weekly lowering of -8,924 contracts from the previous week which had a total of 76,956 net contracts.
This week’s current strength score (the trader positioning range over the past three years, measured from 0 to 100) shows the speculators are currently Bearish-Extreme with a score of 5.3 percent. The commercials are Bullish-Extreme with a score of 94.4 percent and the small traders (not shown in chart) are Bearish-Extreme with a score of 10.1 percent.
Gold Futures Statistics
SPECULATORS
COMMERCIALS
SMALL TRADERS
– Percent of Open Interest Longs:
46.7
27.0
8.7
– Percent of Open Interest Shorts:
31.8
44.6
6.0
– Net Position:
68,032
-80,213
12,181
– Gross Longs:
212,853
123,085
39,637
– Gross Shorts:
144,821
203,298
27,456
– Long to Short Ratio:
1.5 to 1
0.6 to 1
1.4 to 1
NET POSITION TREND:
– Strength Index Score (3 Year Range Pct):
5.3
94.4
10.1
– Strength Index Reading (3 Year Range):
Bearish-Extreme
Bullish-Extreme
Bearish-Extreme
NET POSITION MOVEMENT INDEX:
– 6-Week Change in Strength Index:
-9.7
9.5
-3.6
Silver Comex Futures:
The Silver Comex Futures large speculator standing this week reached a net position of -101 contracts in the data reported through Tuesday. This was a weekly reduction of -1,368 contracts from the previous week which had a total of 1,267 net contracts.
This week’s current strength score (the trader positioning range over the past three years, measured from 0 to 100) shows the speculators are currently Bearish-Extreme with a score of 14.0 percent. The commercials are Bullish-Extreme with a score of 86.9 percent and the small traders (not shown in chart) are Bearish-Extreme with a score of 13.7 percent.
Silver Futures Statistics
SPECULATORS
COMMERCIALS
SMALL TRADERS
– Percent of Open Interest Longs:
36.8
38.1
16.1
– Percent of Open Interest Shorts:
36.9
44.4
9.6
– Net Position:
-101
-8,857
8,958
– Gross Longs:
51,163
52,952
22,331
– Gross Shorts:
51,264
61,809
13,373
– Long to Short Ratio:
1.0 to 1
0.9 to 1
1.7 to 1
NET POSITION TREND:
– Strength Index Score (3 Year Range Pct):
14.0
86.9
13.7
– Strength Index Reading (3 Year Range):
Bearish-Extreme
Bullish-Extreme
Bearish-Extreme
NET POSITION MOVEMENT INDEX:
– 6-Week Change in Strength Index:
5.0
-6.0
8.5
Copper Grade #1 Futures:
The Copper Grade #1 Futures large speculator standing this week reached a net position of -16,919 contracts in the data reported through Tuesday. This was a weekly increase of 3,383 contracts from the previous week which had a total of -20,302 net contracts.
This week’s current strength score (the trader positioning range over the past three years, measured from 0 to 100) shows the speculators are currently Bearish with a score of 22.9 percent. The commercials are Bullish with a score of 79.3 percent and the small traders (not shown in chart) are Bearish with a score of 31.1 percent.
Copper Futures Statistics
SPECULATORS
COMMERCIALS
SMALL TRADERS
– Percent of Open Interest Longs:
27.9
44.5
8.6
– Percent of Open Interest Shorts:
37.3
35.6
8.0
– Net Position:
-16,919
15,907
1,012
– Gross Longs:
50,000
79,742
15,339
– Gross Shorts:
66,919
63,835
14,327
– Long to Short Ratio:
0.7 to 1
1.2 to 1
1.1 to 1
NET POSITION TREND:
– Strength Index Score (3 Year Range Pct):
22.9
79.3
31.1
– Strength Index Reading (3 Year Range):
Bearish
Bullish
Bearish
NET POSITION MOVEMENT INDEX:
– 6-Week Change in Strength Index:
1.6
-3.6
14.7
Platinum Futures:
The Platinum Futures large speculator standing this week reached a net position of 11,381 contracts in the data reported through Tuesday. This was a weekly boost of 2,887 contracts from the previous week which had a total of 8,494 net contracts.
This week’s current strength score (the trader positioning range over the past three years, measured from 0 to 100) shows the speculators are currently Bearish with a score of 24.4 percent. The commercials are Bullish with a score of 77.1 percent and the small traders (not shown in chart) are Bearish-Extreme with a score of 16.3 percent.
Platinum Futures Statistics
SPECULATORS
COMMERCIALS
SMALL TRADERS
– Percent of Open Interest Longs:
50.7
33.3
12.2
– Percent of Open Interest Shorts:
30.5
60.0
5.8
– Net Position:
11,381
-14,971
3,590
– Gross Longs:
28,471
18,686
6,825
– Gross Shorts:
17,090
33,657
3,235
– Long to Short Ratio:
1.7 to 1
0.6 to 1
2.1 to 1
NET POSITION TREND:
– Strength Index Score (3 Year Range Pct):
24.4
77.1
16.3
– Strength Index Reading (3 Year Range):
Bearish
Bullish
Bearish-Extreme
NET POSITION MOVEMENT INDEX:
– 6-Week Change in Strength Index:
17.8
-16.3
-4.5
Palladium Futures:
The Palladium Futures large speculator standing this week reached a net position of -1,745 contracts in the data reported through Tuesday. This was a weekly reduction of -536 contracts from the previous week which had a total of -1,209 net contracts.
This week’s current strength score (the trader positioning range over the past three years, measured from 0 to 100) shows the speculators are currently Bearish-Extreme with a score of 13.6 percent. The commercials are Bullish-Extreme with a score of 86.8 percent and the small traders (not shown in chart) are Bearish-Extreme with a score of 12.7 percent.
Palladium Futures Statistics
SPECULATORS
COMMERCIALS
SMALL TRADERS
– Percent of Open Interest Longs:
22.0
60.0
14.6
– Percent of Open Interest Shorts:
45.8
29.6
21.2
– Net Position:
-1,745
2,228
-483
– Gross Longs:
1,618
4,403
1,074
– Gross Shorts:
3,363
2,175
1,557
– Long to Short Ratio:
0.5 to 1
2.0 to 1
0.7 to 1
NET POSITION TREND:
– Strength Index Score (3 Year Range Pct):
13.6
86.8
12.7
– Strength Index Reading (3 Year Range):
Bearish-Extreme
Bullish-Extreme
Bearish-Extreme
NET POSITION MOVEMENT INDEX:
– 6-Week Change in Strength Index:
-2.8
4.5
-18.1
Article By InvestMacro – Receive our weekly COT Newsletter
*COT Report: The COT data, released weekly to the public each Friday, is updated through the most recent Tuesday (data is 3 days old) and shows a quick view of how large speculators or non-commercials (for-profit traders) were positioned in the futures markets.
The CFTC categorizes trader positions according to commercial hedgers (traders who use futures contracts for hedging as part of the business), non-commercials (large traders who speculate to realize trading profits) and nonreportable traders (usually small traders/speculators) as well as their open interest (contracts open in the market at time of reporting). See CFTC criteria here.
Here are the latest charts and statistics for the Commitment of Traders (COT) reports data published by the Commodities Futures Trading Commission (CFTC).
The latest COT data is updated through Tuesday October 25th and shows a quick view of how large traders (for-profit speculators and commercial entities) were positioned in the futures markets.
Live Cattle, Corn & Soybean Meal lead the Weekly Speculator Changes
The COT soft commodities speculator bets were slightly higher this week as six out of the eleven soft commodities markets we cover had higher positioning this week while the other five markets had decreases in contracts.
Leading the gains for soft commodities markets was Live Cattle (22,470 contracts) with Corn (17,365 contracts), Soybean Meal (17,014 contracts), Soybean Oil (16,918 contracts), Lean Hogs (13,290 contracts) and Soybeans (2,702 contracts) also showing positive weeks.
The softs market leading the declines in speculator bets this week was Sugar (-14,524 contracts) with Cocoa (-12,763 contracts), Wheat (-9,372 contracts), Coffee (-7,872 contracts) and Cotton (-7,787 contracts) also registering lower bets on the week.
Highlighting the COT softs data this week is the continued fall in Coffee speculator positioning. Coffee large speculator bets have decreased for four straight weeks and in seven out of the past eight weeks. The recent weakness has taken a total of -37,336 contracts off the Coffee speculator position in just the past eight weeks. The overall position now sits at a total of +11,351 contracts, marking the lowest weekly level since July 21st of 2020, a span of 118 weeks.
The Coffee price has dropped by approximately 23 percent over the past three weeks and with a decline of almost 10 percent this week alone. The narrative for the Coffee price decline is that price increases have curtailed demand while a potential increase in supply out of Brazil is coming. However, the Intercontinental Exchange that monitors warehouse stocks of Arabica coffee beans has showed that Coffee stocks are at the lowest levels of the past 20 years. The short-term volatility notwithstanding, the big-picture Coffee story is one of rising worldwide demand and revenue but with some measures showing Coffee supply being hampered (current ICE Coffee stocks) and with climate change also likely to play a role in shaping the future Coffee production story as well.
Data Snapshot of Commodity Market Traders | Columns Legend
Oct-25-2022
OI
OI-Index
Spec-Net
Spec-Index
Com-Net
COM-Index
Smalls-Net
Smalls-Index
WTI Crude
1,436,942
0
249,079
10
-268,026
92
18,947
32
Gold
456,072
7
68,032
5
-80,213
94
12,181
10
Silver
139,085
12
-101
14
-8,857
87
8,958
14
Copper
179,344
17
-16,919
23
15,907
79
1,012
31
Palladium
7,343
7
-1,745
14
2,228
87
-483
13
Platinum
56,117
15
11,381
24
-14,971
77
3,590
16
Natural Gas
970,872
5
-151,766
33
133,397
73
18,369
24
Brent
166,931
14
-40,301
44
36,912
55
3,389
55
Heating Oil
272,663
25
20,411
72
-38,238
31
17,827
60
Soybeans
651,685
17
57,385
31
-35,301
76
-22,084
34
Corn
1,445,842
25
329,784
72
-273,645
33
-56,139
11
Coffee
208,280
18
11,351
37
-13,326
68
1,975
27
Sugar
723,503
6
111,888
59
-140,147
43
28,259
43
Wheat
324,137
16
-12,913
2
19,896
88
-6,983
74
Strength Scores led by Soybean Meal
Strength Scores (a normalized measure of Speculator positions over a 3-Year range, from 0 to 100 where above 80 is extreme bullish and below 20 is extreme bearish) showed that Soybean Meal (92.1 percent) continues to lead the soft commodity markets and is in a bullish extreme position (above 80 percent). Corn (72.2 percent) and Soybean Oil (67.0 percent) come in as the next highest soft commodity markets in strength scores.
On the downside, Wheat (2.3 percent) and Cocoa (15.3 percent) come in at the lowest strength levels currently and are both in bearish extreme standings (below 20 percent).
Strength Statistics: Corn (72.2 percent) vs Corn previous week (69.9 percent) Sugar (58.7 percent) vs Sugar previous week (61.7 percent) Coffee (36.8 percent) vs Coffee previous week (45.2 percent) Soybeans (31.0 percent) vs Soybeans previous week (30.2 percent) Soybean Oil (67.0 percent) vs Soybean Oil previous week (55.4 percent) Soybean Meal (92.1 percent) vs Soybean Meal previous week (82.7 percent) Live Cattle (59.8 percent) vs Live Cattle previous week (31.6 percent) Lean Hogs (50.7 percent) vs Lean Hogs previous week (36.3 percent) Cotton (29.6 percent) vs Cotton previous week (35.3 percent) Cocoa (15.3 percent) vs Cocoa previous week (27.9 percent) Wheat (2.3 percent) vs Wheat previous week (14.4 percent)
Strength Trends led by Soybean Oil and Sugar
Strength Score Trends (or move index, calculates the 6-week changes in strength scores) show that Soybean Oil (26.6 percent) leads the past six weeks trends for soft commodity markets this week. Sugar (9.2 percent), Corn (4.5 percent) and Cocoa (4.3 percent) are the next highest movers in the latest trends data.
Coffee (-32.9 percent) leads the downside trend scores currently while the next markets with lower trend scores were Cotton (-17.0 percent) followed by Soybeans (-10.7 percent).
Strength Trend Statistics: Corn (4.5 percent) vs Corn previous week (3.3 percent) Sugar (9.2 percent) vs Sugar previous week (14.4 percent) Coffee (-32.9 percent) vs Coffee previous week (-29.7 percent) Soybeans (-10.7 percent) vs Soybeans previous week (-8.2 percent) Soybean Oil (26.6 percent) vs Soybean Oil previous week (18.9 percent) Soybean Meal (1.1 percent) vs Soybean Meal previous week (-4.5 percent) Live Cattle (-5.4 percent) vs Live Cattle previous week (-26.5 percent) Lean Hogs (1.3 percent) vs Lean Hogs previous week (-10.1 percent) Cotton (-17.0 percent) vs Cotton previous week (-13.2 percent) Cocoa (4.3 percent) vs Cocoa previous week (6.7 percent) Wheat (-6.2 percent) vs Wheat previous week (8.1 percent)
Individual Soft Commodities Markets:
CORN Futures:
The CORN large speculator standing this week was a net position of 329,784 contracts in the data reported through Tuesday. This was a weekly rise of 17,365 contracts from the previous week which had a total of 312,419 net contracts.
This week’s current strength score (the trader positioning range over the past three years, measured from 0 to 100) shows the speculators are currently Bullish with a score of 72.2 percent. The commercials are Bearish with a score of 32.9 percent and the small traders (not shown in chart) are Bearish-Extreme with a score of 10.8 percent.
CORN Futures Statistics
SPECULATORS
COMMERCIALS
SMALL TRADERS
– Percent of Open Interest Longs:
31.3
43.3
8.9
– Percent of Open Interest Shorts:
8.5
62.2
12.8
– Net Position:
329,784
-273,645
-56,139
– Gross Longs:
453,036
625,537
129,121
– Gross Shorts:
123,252
899,182
185,260
– Long to Short Ratio:
3.7 to 1
0.7 to 1
0.7 to 1
NET POSITION TREND:
– Strength Index Score (3 Year Range Pct):
72.2
32.9
10.8
– Strength Index Reading (3 Year Range):
Bullish
Bearish
Bearish-Extreme
NET POSITION MOVEMENT INDEX:
– 6-Week Change in Strength Index:
4.5
-5.6
2.5
SUGAR Futures:
The SUGAR large speculator standing this week was a net position of 111,888 contracts in the data reported through Tuesday. This was a weekly decline of -14,524 contracts from the previous week which had a total of 126,412 net contracts.
This week’s current strength score (the trader positioning range over the past three years, measured from 0 to 100) shows the speculators are currently Bullish with a score of 58.7 percent. The commercials are Bearish with a score of 43.3 percent and the small traders (not shown in chart) are Bearish with a score of 42.8 percent.
SUGAR Futures Statistics
SPECULATORS
COMMERCIALS
SMALL TRADERS
– Percent of Open Interest Longs:
27.6
50.8
10.1
– Percent of Open Interest Shorts:
12.1
70.1
6.2
– Net Position:
111,888
-140,147
28,259
– Gross Longs:
199,761
367,374
72,823
– Gross Shorts:
87,873
507,521
44,564
– Long to Short Ratio:
2.3 to 1
0.7 to 1
1.6 to 1
NET POSITION TREND:
– Strength Index Score (3 Year Range Pct):
58.7
43.3
42.8
– Strength Index Reading (3 Year Range):
Bullish
Bearish
Bearish
NET POSITION MOVEMENT INDEX:
– 6-Week Change in Strength Index:
9.2
-12.0
21.2
COFFEE Futures:
The COFFEE large speculator standing this week was a net position of 11,351 contracts in the data reported through Tuesday. This was a weekly lowering of -7,872 contracts from the previous week which had a total of 19,223 net contracts.
This week’s current strength score (the trader positioning range over the past three years, measured from 0 to 100) shows the speculators are currently Bearish with a score of 36.8 percent. The commercials are Bullish with a score of 67.7 percent and the small traders (not shown in chart) are Bearish with a score of 26.9 percent.
COFFEE Futures Statistics
SPECULATORS
COMMERCIALS
SMALL TRADERS
– Percent of Open Interest Longs:
20.2
50.9
4.7
– Percent of Open Interest Shorts:
14.8
57.3
3.8
– Net Position:
11,351
-13,326
1,975
– Gross Longs:
42,119
106,110
9,859
– Gross Shorts:
30,768
119,436
7,884
– Long to Short Ratio:
1.4 to 1
0.9 to 1
1.3 to 1
NET POSITION TREND:
– Strength Index Score (3 Year Range Pct):
36.8
67.7
26.9
– Strength Index Reading (3 Year Range):
Bearish
Bullish
Bearish
NET POSITION MOVEMENT INDEX:
– 6-Week Change in Strength Index:
-32.9
33.3
-1.6
SOYBEANS Futures:
The SOYBEANS large speculator standing this week was a net position of 57,385 contracts in the data reported through Tuesday. This was a weekly rise of 2,702 contracts from the previous week which had a total of 54,683 net contracts.
This week’s current strength score (the trader positioning range over the past three years, measured from 0 to 100) shows the speculators are currently Bearish with a score of 31.0 percent. The commercials are Bullish with a score of 75.9 percent and the small traders (not shown in chart) are Bearish with a score of 33.8 percent.
SOYBEANS Futures Statistics
SPECULATORS
COMMERCIALS
SMALL TRADERS
– Percent of Open Interest Longs:
19.4
54.4
7.9
– Percent of Open Interest Shorts:
10.6
59.8
11.3
– Net Position:
57,385
-35,301
-22,084
– Gross Longs:
126,693
354,542
51,670
– Gross Shorts:
69,308
389,843
73,754
– Long to Short Ratio:
1.8 to 1
0.9 to 1
0.7 to 1
NET POSITION TREND:
– Strength Index Score (3 Year Range Pct):
31.0
75.9
33.8
– Strength Index Reading (3 Year Range):
Bearish
Bullish
Bearish
NET POSITION MOVEMENT INDEX:
– 6-Week Change in Strength Index:
-10.7
8.1
14.6
SOYBEAN OIL Futures:
The SOYBEAN OIL large speculator standing this week was a net position of 93,241 contracts in the data reported through Tuesday. This was a weekly increase of 16,918 contracts from the previous week which had a total of 76,323 net contracts.
This week’s current strength score (the trader positioning range over the past three years, measured from 0 to 100) shows the speculators are currently Bullish with a score of 67.0 percent. The commercials are Bearish with a score of 33.6 percent and the small traders (not shown in chart) are Bullish with a score of 61.2 percent.
SOYBEAN OIL Futures Statistics
SPECULATORS
COMMERCIALS
SMALL TRADERS
– Percent of Open Interest Longs:
29.0
43.0
8.7
– Percent of Open Interest Shorts:
7.1
67.9
5.7
– Net Position:
93,241
-106,036
12,795
– Gross Longs:
123,538
183,248
37,167
– Gross Shorts:
30,297
289,284
24,372
– Long to Short Ratio:
4.1 to 1
0.6 to 1
1.5 to 1
NET POSITION TREND:
– Strength Index Score (3 Year Range Pct):
67.0
33.6
61.2
– Strength Index Reading (3 Year Range):
Bullish
Bearish
Bullish
NET POSITION MOVEMENT INDEX:
– 6-Week Change in Strength Index:
26.6
-26.1
11.0
SOYBEAN MEAL Futures:
The SOYBEAN MEAL large speculator standing this week was a net position of 116,146 contracts in the data reported through Tuesday. This was a weekly gain of 17,014 contracts from the previous week which had a total of 99,132 net contracts.
This week’s current strength score (the trader positioning range over the past three years, measured from 0 to 100) shows the speculators are currently Bullish-Extreme with a score of 92.1 percent. The commercials are Bearish-Extreme with a score of 9.5 percent and the small traders (not shown in chart) are Bullish with a score of 62.9 percent.
SOYBEAN MEAL Futures Statistics
SPECULATORS
COMMERCIALS
SMALL TRADERS
– Percent of Open Interest Longs:
33.6
39.7
12.6
– Percent of Open Interest Shorts:
3.7
76.0
6.1
– Net Position:
116,146
-141,232
25,086
– Gross Longs:
130,508
153,931
48,845
– Gross Shorts:
14,362
295,163
23,759
– Long to Short Ratio:
9.1 to 1
0.5 to 1
2.1 to 1
NET POSITION TREND:
– Strength Index Score (3 Year Range Pct):
92.1
9.5
62.9
– Strength Index Reading (3 Year Range):
Bullish-Extreme
Bearish-Extreme
Bullish
NET POSITION MOVEMENT INDEX:
– 6-Week Change in Strength Index:
1.1
-1.8
7.7
LIVE CATTLE Futures:
The LIVE CATTLE large speculator standing this week was a net position of 64,126 contracts in the data reported through Tuesday. This was a weekly lift of 22,470 contracts from the previous week which had a total of 41,656 net contracts.
This week’s current strength score (the trader positioning range over the past three years, measured from 0 to 100) shows the speculators are currently Bullish with a score of 59.8 percent. The commercials are Bearish with a score of 28.8 percent and the small traders (not shown in chart) are Bullish-Extreme with a score of 86.7 percent.
LIVE CATTLE Futures Statistics
SPECULATORS
COMMERCIALS
SMALL TRADERS
– Percent of Open Interest Longs:
37.5
32.1
10.8
– Percent of Open Interest Shorts:
14.7
53.9
11.7
– Net Position:
64,126
-61,708
-2,418
– Gross Longs:
105,722
90,481
30,509
– Gross Shorts:
41,596
152,189
32,927
– Long to Short Ratio:
2.5 to 1
0.6 to 1
0.9 to 1
NET POSITION TREND:
– Strength Index Score (3 Year Range Pct):
59.8
28.8
86.7
– Strength Index Reading (3 Year Range):
Bullish
Bearish
Bullish-Extreme
NET POSITION MOVEMENT INDEX:
– 6-Week Change in Strength Index:
-5.4
1.8
12.3
LEAN HOGS Futures:
The LEAN HOGS large speculator standing this week was a net position of 40,379 contracts in the data reported through Tuesday. This was a weekly advance of 13,290 contracts from the previous week which had a total of 27,089 net contracts.
This week’s current strength score (the trader positioning range over the past three years, measured from 0 to 100) shows the speculators are currently Bullish with a score of 50.7 percent. The commercials are Bullish with a score of 57.6 percent and the small traders (not shown in chart) are Bearish with a score of 44.4 percent.
LEAN HOGS Futures Statistics
SPECULATORS
COMMERCIALS
SMALL TRADERS
– Percent of Open Interest Longs:
40.1
33.2
9.2
– Percent of Open Interest Shorts:
19.7
48.6
14.3
– Net Position:
40,379
-30,337
-10,042
– Gross Longs:
79,180
65,528
18,149
– Gross Shorts:
38,801
95,865
28,191
– Long to Short Ratio:
2.0 to 1
0.7 to 1
0.6 to 1
NET POSITION TREND:
– Strength Index Score (3 Year Range Pct):
50.7
57.6
44.4
– Strength Index Reading (3 Year Range):
Bullish
Bullish
Bearish
NET POSITION MOVEMENT INDEX:
– 6-Week Change in Strength Index:
1.3
-0.1
-5.9
COTTON Futures:
The COTTON large speculator standing this week was a net position of 24,776 contracts in the data reported through Tuesday. This was a weekly decline of -7,787 contracts from the previous week which had a total of 32,563 net contracts.
This week’s current strength score (the trader positioning range over the past three years, measured from 0 to 100) shows the speculators are currently Bearish with a score of 29.6 percent. The commercials are Bullish with a score of 72.3 percent and the small traders (not shown in chart) are Bearish-Extreme with a score of 16.2 percent.
COTTON Futures Statistics
SPECULATORS
COMMERCIALS
SMALL TRADERS
– Percent of Open Interest Longs:
29.0
49.3
5.3
– Percent of Open Interest Shorts:
18.9
59.7
4.9
– Net Position:
24,776
-25,690
914
– Gross Longs:
71,296
121,240
13,075
– Gross Shorts:
46,520
146,930
12,161
– Long to Short Ratio:
1.5 to 1
0.8 to 1
1.1 to 1
NET POSITION TREND:
– Strength Index Score (3 Year Range Pct):
29.6
72.3
16.2
– Strength Index Reading (3 Year Range):
Bearish
Bullish
Bearish-Extreme
NET POSITION MOVEMENT INDEX:
– 6-Week Change in Strength Index:
-17.0
19.5
-37.1
COCOA Futures:
The COCOA large speculator standing this week was a net position of -1,545 contracts in the data reported through Tuesday. This was a weekly fall of -12,763 contracts from the previous week which had a total of 11,218 net contracts.
This week’s current strength score (the trader positioning range over the past three years, measured from 0 to 100) shows the speculators are currently Bearish-Extreme with a score of 15.3 percent. The commercials are Bullish-Extreme with a score of 87.1 percent and the small traders (not shown in chart) are Bearish-Extreme with a score of 16.5 percent.
COCOA Futures Statistics
SPECULATORS
COMMERCIALS
SMALL TRADERS
– Percent of Open Interest Longs:
31.3
46.1
4.2
– Percent of Open Interest Shorts:
31.8
46.2
3.5
– Net Position:
-1,545
-456
2,001
– Gross Longs:
96,233
141,758
12,844
– Gross Shorts:
97,778
142,214
10,843
– Long to Short Ratio:
1.0 to 1
1.0 to 1
1.2 to 1
NET POSITION TREND:
– Strength Index Score (3 Year Range Pct):
15.3
87.1
16.5
– Strength Index Reading (3 Year Range):
Bearish-Extreme
Bullish-Extreme
Bearish-Extreme
NET POSITION MOVEMENT INDEX:
– 6-Week Change in Strength Index:
4.3
-2.4
-19.6
WHEAT Futures:
The WHEAT large speculator standing this week was a net position of -12,913 contracts in the data reported through Tuesday. This was a weekly decrease of -9,372 contracts from the previous week which had a total of -3,541 net contracts.
This week’s current strength score (the trader positioning range over the past three years, measured from 0 to 100) shows the speculators are currently Bearish-Extreme with a score of 2.3 percent. The commercials are Bullish-Extreme with a score of 88.0 percent and the small traders (not shown in chart) are Bullish with a score of 74.2 percent.
WHEAT Futures Statistics
SPECULATORS
COMMERCIALS
SMALL TRADERS
– Percent of Open Interest Longs:
26.6
41.6
9.0
– Percent of Open Interest Shorts:
30.6
35.5
11.1
– Net Position:
-12,913
19,896
-6,983
– Gross Longs:
86,299
134,862
29,102
– Gross Shorts:
99,212
114,966
36,085
– Long to Short Ratio:
0.9 to 1
1.2 to 1
0.8 to 1
NET POSITION TREND:
– Strength Index Score (3 Year Range Pct):
2.3
88.0
74.2
– Strength Index Reading (3 Year Range):
Bearish-Extreme
Bullish-Extreme
Bullish
NET POSITION MOVEMENT INDEX:
– 6-Week Change in Strength Index:
-6.2
9.8
-11.1
Article By InvestMacro – Receive our weekly COT Newsletter
*COT Report: The COT data, released weekly to the public each Friday, is updated through the most recent Tuesday (data is 3 days old) and shows a quick view of how large speculators or non-commercials (for-profit traders) were positioned in the futures markets.
The CFTC categorizes trader positions according to commercial hedgers (traders who use futures contracts for hedging as part of the business), non-commercials (large traders who speculate to realize trading profits) and nonreportable traders (usually small traders/speculators) as well as their open interest (contracts open in the market at time of reporting). See CFTC criteria here.
With global interest and use of copper rising, copper may not be able to meet demand. Expert Rick Mills of Ahead of the Herd reviews the demand for copper, the push for more infrastructure, and what he believes the future holds for this metal.
Copper is one of the most important metals, with more than 20 million tonnes consumed each year across a variety of industries, including building construction (wiring & piping,) power generation/ transmission, and electronic product manufacturing.
World mined copper production, in thousands of tonnes. Source: US Geological Survey
In recent years, the global transition towards clean energy has stretched the need for the tawny-colored metal even further. More copper will be required to feed our renewable energy infrastructure, such as photovoltaic cells used for solar power and wind turbines.
The metal is also a key component in transportation, and with increasing emphasis on electrification, demand is only going to increase.
According to S&P Global’s report, via Reuters, “Efforts to reach carbon neutrality by 2050 are likely to remain out of reach as copper supply fails to match demand amid the growing use of solar panels, electric vehicles, and other renewable technologies.”
A major rise in copper demand from new “blacktop” infrastructure (think roads, bridges, airports, etc.), combined with high demand for copper from large-scale efforts on behalf of governments to decarbonize and electrify, is not being met with an adequate supply of the industrial metal.
Trillions worth of new projects is thus in danger of falling by the wayside unless much more copper is discovered — more than is currently possible, in my opinion.
My position is supported by a recent report from S&P Global, which predicts the world’s appetite for copper will reach 53 million tonnes, on an annual basis, by mid-century. This is more than double the current global mine production of 21Mt, according to the U.S. Geological Survey.
How are we going to find the copper?
The Green Economy
According to S&P Global’s report via Reuters, “Efforts to reach carbon neutrality by 2050 are likely to remain out of reach as copper supply fails to match demand amid the growing use of solar panels, electric vehicles, and other renewable technologies.”
The continued move towards electric vehicles is a huge copper driver. In EVs, copper is a major component used in the electric motor, batteries, inverters, wiring, and in charging stations. An average electric vehicle contains about four times as much copper as regular vehicles.
Compared with traditional energy systems, renewables contain 12 times more copper. Wind farms use anywhere between 4 to 15 million pounds, while solar photovoltaic farms require 9,000 pounds per megawatt.
The big question is, will there be enough copper for future electrification needs globally? And remember, in addition to electrification, copper will still be required for all the standard uses.
The short answer is no, not without a massive acceleration of copper production worldwide.
According to a joint report from Ernst & Young (EY) and Eurelectric, Europe will have 130 million EVs by 2025. Each takes about 85 kg (187 pounds) of copper.
The report’s projections, cited by Bloomberg, show Europe’s EV fleet growing from its current <5 million to 65 million by 2030, then doubling over the following five years. This number of EVS will require 65 million chargers. Charging stations take 0.7 kg (for a 3.3 kW slow charger) or 8 kg (for a 200 kW fast charger), according to the Copper Alliance.
An EY leader notes it took 10 years to install 400,000 chargers; now, we will need about 500,000 per year until 2030 and 1 million every year between 2030 and 2035.
That would mean an extra million tonnes a year, over and above what we mine now, every year for the next 20 years! The world’s copper miners need to discover the equivalent of one Escondida, the largest copper mine on the planet, each and every year while keeping current production at ~20Mt.
There is also no shift from fossil fuels to green energy without copper, which has no substitutes for its uses in EVs (electric motors and wiring, batteries, inverters, charging stations), wind, and solar energy.
Many countries need to reduce their so-called “infrastructure deficits.” Basic infrastructure, such as roads, bridges, water and sewer systems, has been poorly maintained and requires hefty investments, measured in trillions of dollars, to repair or replace.
China, the world’s biggest commodities consumer, has committed to spend at least US$2.3 trillion this year on major infrastructure projects. They are part of Beijing’s most recent five-year plan that calls for developing “core technologies,” including high-speed rail, power infrastructure, and new energy. More money will be aside in years two to five.
There is also the “Made in China 2025″ initiative, which seeks to end Chinese reliance on foreign technology by investing in a number of key sectors, including IT and robotics, and China’s $900 billion “Belt and Road Initiative,” designed to open channels between China and its neighbors, mostly through infrastructure investments. Dozens of countries have signed up for it, including Russia.
Research commissioned by the International Copper Association, quoted by Mining Technology, found that Belt and Road projects in over 60 Eurasian countries will push the demand for copper to 6.5 million tonnes by 2027.
China’s Belt and Road Initiative
That much copper equates to nearly a third of the 21Mt of copper produced in 2021 — a new copper supply that would need to be either mined from existing operations or discovered.
The U.S. is pursuing its own US$1.2 trillion infrastructure package, to be spent on roads, bridges, power & water systems, transit, rail, electric vehicles, and upgrades to broadband, airports, ports, and waterways, among many other items.
According to S&P Global, Among the metals-intensive funding in the legislation is US$110 billion for roads, bridges, and major projects, US$66 billion for passenger and freight rail, US$39 billion for public transit, and US$7.5 billion for electric vehicles.
Some of the largest copper mines are seeing their reserves dwindle; they are having to slow production due to major capital-intensive projects to move operations from open pit to underground. Examples include the world’s two largest copper mines, Escondida in Chile and Grasberg in Indonesia, along with Chuquicamata, the biggest open-pit mine on Earth.
Without new capital investments, Commodities Research Unit (CRU) predicts global copper mined production will drop from the current 21Mt to below 12Mt, leading to a supply shortfall of more than 15Mt. Over 200 copper mines are expected to run out of ore before 2035, with not enough new mines in the pipeline to take their place.
Graph courtesy of Hamish Sampson, analyst at CRU’s copper team
Bank of America, in a recent report, predicts the copper market will flip into a deficit as early as 2025 following the completion of the current wave of project buildouts, the latest being Ivanhoe Mines’ massive Kamoa-Kakula project in the Democratic Republic of the Congo.
Five years later, analysts at Rystad Energy project that copper demand will outstrip supply by more than 6 million tonnes. That equates to nearly the entire annual production of Chile, the world’s top producer.
By 2040, the supply shortfall grows to 14Mt, according to a BloombergNEF August report, with a “best-case scenario” shortage of >5 million short tons possible by 2040.
In fact, we don’t have to wait to see signs of an emerging copper crisis. Some of the world’s largest copper miners this year have proven unable to produce as much as they said they would. BHP, Rio Tinto, Anglo American, First Quantum Minerals, and Glencore have all pared back production forecasts, blaming higher costs for their lower output figures. (see ‘Cost creep’ below)
Following a 14% drop in copper production in Q1, Glencore cut its 2022 guidance by 3% or 40,000 tonnes.
According to Goldman Sachs, the incentive price to make mining attractive is now 30% higher than in 2018, at roughly US$9,000 a ton (as I write this copper is US$7060.00t).
Some of this has to do with deposits getting mined out. As grades decline, higher amounts of ore need to be processed to yield an equivalent amount of copper.
New deposits are getting trickier and pricier to find and develop. There is a lot of anti-mining sentiment in Canada and the United States, and politicians are beholden to these pressure groups. It can take up to 20 years to build a mine after all the stakeholders have been consulted and the many permitting requirements have been satisfied.
Overall, it is getting harder and taking longer for new projects to be green-lit.
Source: Energy & Capital
According to Goehring & Rozencwajg Associates, the number of new world-class copper discoveries coming online this decade “will decline substantially and depletion problems at existing mines will accelerate.”
According to the Wall Street firm’s model, the industry is “approaching the lower limits of cut-off grades,” and brownfield expansions are no longer a viable solution. “If this is correct, then we are rapidly approaching the point where reserves cannot be grown at all,” the report concluded.
It also shines a light on the importance of making new discoveries in establishing a sustainable copper supply chain.
Over the past 10 years, greenfield additions to copper reserves have slowed dramatically. S&P Global estimates that new discoveries averaged nearly 50Mt annually between 1990 and 2010. Since then, new discoveries have fallen by 80% to only 8Mt per year.
In fact, new copper supply is concentrated in just five mines — Chile’s Escondida, Spence and Quebrada Blanca, Cobre Panama, and the Kamoa-Kakula project in the DRC. Our analysis shows that in four of the five mines where new copper supply is concentrated, there are offtake agreements, either in place or implied, with non-Western buyers.
In the case of Kamoa-Kaukula, 100% of initial production will be split between two Chinese companies, one of which owns 39.6% of the joint venture project. Nearly half of Cobre Panama’s annual production goes to a Korean smelter under a 2017 offtake agreement.
Escondida and Quebrada Blanca are both partially owned by Japanese companies — one can make the assumption that a corresponding percentage of production will be going there.
Companies that diversify into copper now would be well-positioned to benefit from the coming copper shortfall, which should result in a much higher realized copper price.
Barrick Gold Corp. (ABX:TSX; GOLD:NYSE) and Agnico Eagle Mines Ltd. (AEM:TSX; AEM:NYSE) are two recent examples.
Agnico Eagle paid US$580 million for a 50% share in Teck’s San Nicolas copper-zinc mine in Zacatecas, Mexico.
About 20% of Barrick Gold’s production now comes from copper.
Cost Creep
Copper mining has become an especially capital-intensive industry – the average capital intensity for a new copper mine in 2000 was US$4,000-5,000 to build the capacity to produce a tonne of copper; in 2012, capital intensity was US$10,000/t, on average, for new projects.
Today, building a new copper mine can cost up to US$44,000 per tonne of production, an AOTH analysis has found.
Capex costs are escalating because:
Declining copper ore grades means a much larger relative scale of required mining and milling operations.
A growing proportion of mining projects are in remote areas of developing economies where there’s little to no existing infrastructure.
Many inputs necessary for mine-building are getting more expensive as cross-the-board inflation, the highest in 40 years, infiltrates the industry. This includes two of the largest costs, wages and diesel fuel used to run mining equipment.
The bottom line?
It is becoming increasingly costly to bring new copper mines online and run them. According to Goldman Sachs, the incentive price to make mining attractive is now 30% higher than in 2018, at roughly US$9,000 a ton (as I write this, copper is US$7060.00t).
Along with technical issues such as falling grades/deteriorating ore quality, there is also supply pressure from growing resource nationalism.
There is a need to go further afield and dig deeper to find copper at the grades needed to economically produce copper products. This usually means riskier jurisdictions that are often ruled by shaky governments.
In February, Goldman Sachs predicted a “scarcity episode” by the end of 2022 as global stocks of copper fell to dangerously low levels.
Peru and Chile, which together account for more than a third of global copper output, are both seeing a wave of resource nationalism, where governments try to exact a greater share of resource revenues through various means, such as higher royalties and export bans of raw ores.
Chile has attracted substantial mining investment in recent years, including from leading copper producers like BHP and Teck. But long-term, Chile’s declining ore grades present a key downside risk to production forecasts.
The chart below shows Chile’s average copper grades were more than cut in half between 1999 and 2016.
Source: Cochilco
Chile is also producing less copper. According to Cochilco, the country’s state copper commission, in 2000, Chile produced 34.7% of the world’s copper; by 2017, the percentage had fallen to 26.7% (the USGS’s latest figures show Chilean mine production at 26% of the global total).
State-owned copper miner Codelco, which is the largest copper company in the world, is facing challenges linked to the redevelopment of its copper mines, meaning it will produce 1.5 million tonnes of copper this year and next, compared with 1.7 million tonnes in 2021, Reuters said this week.
Making matters worse, after more than a decade of drought, freshwater supplies are becoming a big problem in Chile. Copper mines there require lots of water to process sulfide ores, and the lower the grade, the more water must be used.
Like Chile, the world’s second-largest copper miner has underperformed. Copper production in July totaled 195,234 tonnes, following a respective 9.1% and 14.5% drop in output at the Antamina and Southern Copper mines. The result was a 6.6% year-on-year loss.
While copper production at China-owned Las Bambas recovered in June, following a truce with indigenous communities who oppose the mine, the agreement ended in July, and renewed protests could risk copper supplies, Reuters said.
The Chinese copper market is at its tightest in more than a decade as traders pay massive premiums for immediate supplies.
Peru’s President Pedro Castillo has proposed to raise taxes on the mining sector by at least 3%, which the country’s mining chamber says could cost USD$50 billion in future investments.
In the Democratic Republic of Congo (DRC), weak infrastructure, including a lack of power, is limiting the growth potential for major copper deposits. This past summer, the Congolese government suspended metal exports from Tenke Fungurume, a large copper-cobalt mine owned by China’s CMOC.
The DRC is the world’s top producer of cobalt and Africa’s leading copper-mining country. Tenke Fugurume accounted for more than 10% of global cobalt output in 2021.
Dwindling Inventories
In February, Goldman Sachs predicted a “scarcity episode” by the end of 2022 as global stocks of copper fell to dangerously low levels. That never happened due to the abrupt fall in the copper price, owing to the Federal Reserve’s interest rate increases, the high US dollar, a slowdown in China, and talk of a global recession. Still, Goldman’s warning about a “stock-out” remains well supported.
Goehring & Rozencwajg, the Wall Street firm, published a chart of copper warehouse inventories showing a four-year down-trend from around April 2018 to the present.
These days, there is a puzzling disconnect between the copper price, which has dropped to a five-week low of US$3.54 a pound (at the time of writing), and market tightness.
The latter is aptly demonstrated by what is happening in Shanghai, China, where for the past 15 years, a huge copper stockpile, larger even than the London Metal Exchange, has been used by Chinese companies as collateral for cheap financing.
Now, according to Bloomberg, China’s bonded warehouses are all but empty. The once-frenetic flow of metal into the stockpile has come to a juddering halt as two dominant financiers of Chinese metals, JPMorgan Chase & Co. and ICBC Standard Bank Plc, have halted new business there. Numerous traders and bankers interviewed by Bloomberg said they believe the trade is dead for now, and some predicted the bonded stocks could drop to zero or close to it.
The implications are being felt across the market as the world’s largest copper consumer becomes more reliant on imports to meet its near-term needs at a time when global stocks are already at historically low levels. The Chinese copper market is at its tightest in more than a decade as traders pay massive premiums for immediate supplies.
At their peak in 2011-12, China’s bonded stocks held about a million tons of copper. This month they totaled just 30,000 tons — down nearly 300,000t from earlier this year, the lowest level in decades.
Bloomberg explains that the decline began several years ago, with a massive warehousing fraud in 2014 that soured many banks and traders in the Chinese metals industry. This year, the country’s economic slump, rising interest rates, and several high-profile losses caused more participants to stay away.
The key point is, without the Shanghai buffer of bonded stocks, any pickup in Chinese demand could send copper prices soaring.
In short, says Woodmac, “the global energy transition presents an almost unattainable mine supply challenge, with significant investment and price incentives required.”
It’s not only in China that copper stockpiles are getting depleted. As of this week, CRU Group estimates global stocks are down to just 1.6 weeks of consumption. That’s the lowest ever in the copper consultancy’s data going back to 2001, Bloomberg said.
On October 19, Reuters reported the available copper in London Metal Exchange warehouses halved within eight days.
A squeeze on the Shanghai Futures Exchange (ShFE) has generated a scramble for metal, metals columnist Andy Home explained, adding that, As bonded stocks rapidly deplete to fill on-shore ShFE warehouses, physical premiums are, in turn, rising to attract more metal from the international market.
The Yangshan copper premium, a useful proxy for China’s spot import demand, has soared to $147.50 per tonne over LME cash, its highest trading level since 2013.
Western sanctions on Russian companies due to the war in Ukraine are also factoring into low copper inventories. The LME is reportedly talking about suspending deliveries of Russian metal (aluminum, copper, and nickel), which at the end of September comprised over 60% of the exchange’s copper stocks.
Locking In
Some copper buyers are so worried about the future availability of the metal that they are looking to secure longer-term deals than normal. For example, Bloomberg said that Codelco recently signed contracts with customers in Europe for three to five years versus the traditional annual deals.
“We are prepared to continue to strengthen our long-term relations with customers because we can understand that in their risk matrix, their concern about copper supply is one of their priorities,” Codelco’s Chairman Maximo Pacheco said in an interview.
Pointing to forecasts for strong copper demand growth, he said, “Obviously, they have a question: ‘Where are we going to get this copper from?’.”
Supply-Demand Gap
It’s a good question, we find ourselves asking it repeatedly.
A new report from Wood Mackenzie estimates that 9.7 million tonnes of new copper supply is needed over 10 years to meet the targets set out in the Paris Climate Agreement. As stated earlier, this is the equivalent of putting a new Escondida Mine into production every year.
Source: Wood Mackenzie
Figures from the commodities consultancy show that mining project approval rates have stalled despite historically high copper prices (in Q1).
During the first half of 2022, the volume of committed projects totaled just 260,000 tonnes of production per year (against total annual mine production of around 21 million tonnes).
Source: Wood Mackenzie
“To successfully meet zero-carbon targets, the mining industry needs to deliver new projects at a frequency and consistent level of financing never previously accomplished,” said Nick Pickens, research director of copper markets at Wood Mackenzie.
In short, says Woodmac, “the global energy transition presents an almost unattainable mine supply challenge, with significant investment and price incentives required.”
The firm estimates over US$23 billion a year will be needed over 30 years to deliver new projects under the 1.5 degrees Celsius Paris scenario — a level of investment previously seen only for a limited period from 2012 to 2016, following the China-induced commodity super-cycle.
The copper price needed to meet demand under this scenario is US$4.25 a pound, about 25% higher than currently.
Source: Wood Mackenzie
In an article titled ‘A Great Copper Squeeze Is Coming for the Global Economy,’ Bloomberg reported in September that the recent downturn in copper prices stands to worsen the coming deficit because the slump discourages new copper investments.
A massive copper shortfall that could be visited upon the industry in as short as two years’ time could, says Bloomberg, hold back global growth, stoke inflation by raising manufacturing costs, and throw global climate goals off course. . .
And the latest market downturn stands to exacerbate future supply problems by offering a false sense of security, choking off cash flow, and chilling investments. It takes at least 10 years to develop a new mine and get it running, which means that the decisions producers are making today will help determine supplies for at least a decade. [in North America, the time frame is more like 20 years — Rick]
The coming supply squeeze will be truly breathtaking and deserves more of a numerical explanation.
According to a study from S&P Global, emissions goals commensurate with decarbonization and electrification will double copper demand to 50 million tonnes by 2035. Bloomberg New Energy Finance estimates demand will increase by over 50% from 2022 to 2040.
Supply growth is expected to peak around 2024, the result of very few new projects in the works and as existing mines are depleted. According to S&P’s research, this is setting up a supply deficit of 10 million tons in 2035 — the equivalent of 10 Escondidas.
Goldman Sachs thinks mining companies need to spend about US$150 billion over the next decade to solve an 8Mt deficit. BloombergNEF predicts that by 2040 the mined output gap could reach 14Mt.
Copper Prices
The next question is what this means for copper prices going forward. In 2021, when the copper deficit was 441,000 tons, copper prices jumped about 25%. 441,000t is less than 2% of demand, but in S&P Global’s worst-case scenario, 2035’s shortfall will be the equivalent of about 20% of consumption.
Goldman Sachs is forecasting the LME copper price to more than double its current level to US$15,000 a ton in 2025. Let’s step back here and remember the incentive price to make mining copper attractive is US$9,000.00 a ton copper is trading currently at US$7,000.00t.
Copper will have to rise from its current price of US$3.54 to a minimum of US$4.50lb to incentivize miners to build mines.
Of course, one of the biggest wildcards in all this is China, the world’s largest metals consumer, accounting for about half of global copper demand. If the country’s property sector contracts significantly, it would obviously mean less copper-demanded construction.
Another unknown is the potential for a global recession. Citigroup, via CNBC, sees copper prices in the short-term falling due to an economic slowdown driven by Europe. The bank forecasted copper at US$6,600 a ton in the first quarter of 2023.
Other forecasters, and that includes us at AOTH, believe a recession will only delay demand, which is inevitable due to the trillions of dollars being planned for electrification and infrastructure investments. An August 31 presentation from BloombergNEF states that a recession will not “significantly dent” consumption projections going into 2040.
Bloomberg points out there is already very little wiggle room on the supply side: The physical copper market is already so tight that despite the slump in futures prices, the premiums paid for immediate delivery of the metal have been moving higher.
Richard Adkerson, the CEO of Freeport McMoRan, recently weighed in on the disconnect between supply tightness and the lower copper price, saying during a conference call with analysts, “It’s striking how negative financial markets feel about this market, and yet the physical market is so tight.”
“We’re not seeing customers scaling back orders. Customers are really fighting to get products,” Adkerson said. He added that such a pricing environment will defer new copper projects and mine expansions just when the world’s epic shift to electrification requires a massive amount of the metal.
The copper price rose on Wednesday, October 26, to US$3.54 a pound, the highest since September 16, buoyed by a weaker US dollar. Hope for a rebound has also been strengthened due to recent news out of China.
The country is considering lessening its quarantine period for inbound visitors from 10 to seven days, an indication it is winning its war against the coronavirus pandemic that has resulted in nationwide lockdowns.
Conclusion
The demand pressure about to be exerted on copper producers in the coming years all but guarantees a market imbalance, resulting in copper becoming scarcer and dearer with each infrastructure initiative and with each ambitious green initiative rolled out by governments.
The problem is that existing copper mines are running out of ore, and the capital invested in new mines is far below the needed level.
In sum, the copper industry is in the grips of a structural supply deficit that, combined with inflationary cost pressures and creeping resource nationalism in some of the world’s largest copper producers, is only expected to get worse.
According to S&P Global Market Intelligence research, of 224 sizable copper deposits discovered in the past 30 years, only 16 have been found in the last decade.
It takes seven to 10 years, at minimum, to move a copper mine from discovery to production. In regulation-happy jurisdictions like Canada and the U.S., the time frame is more like 20 years.
The pipeline of copper development projects is the lowest it’s been in decades.
Why can’t we just mine more copper?
Over the past two decades, big mining companies have approached the problem of dwindling reserves by doing exactly that.
Historical Copper Price
Between 2001 and 2014, 80% of new reserves came from re-classifying what was once waste rock into mineable ore, i.e., lowering the cut-off grade.
The problem is that between lowering their cut-off grades and high-grading (removing all the best ore and leaving the rest), the grade of new reserves each year has steadily declined.
In 2001, the new reserves grade was 0.80% copper, but by 2012, it had fallen to 0.26%. The copper industry was still able to replace all the ore used in production with new reserves, but the quality of those reserves, i.e., the grade, had dropped by nearly two-thirds.
The authors of a recent report contend that even with prices above $10,000 per tonne, reserves cannot keep growing, specifically at porphyry deposits, where most copper is mined.
Their analysis also suggests that we are quickly approaching the lower limits of cut-off grades, concluding that we are rapidly approaching the point where reserves cannot be grown at all. In other words, peak copper.
The industry can no longer re-classify itself out of its problem. Billions and billions of dollars need to be invested in the exploration and development of new copper mines.
In sum, the copper industry is in the grips of a structural supply deficit that, combined with inflationary cost pressures and creeping resource nationalism in some of the world’s largest copper producers, is only expected to get worse.
Ahead of the Herd newsletter, aheadoftheherd.com, hereafter known as AOTH.
Please read the entire Disclaimer carefully before you use this website or read the newsletter. If you do not agree to all the AOTH/Richard Mills Disclaimer, do not access/read this website/newsletter/article, or any of its pages. By reading/using this AOTH/Richard Mills website/newsletter/article, and whether you actually read this Disclaimer, you are deemed to have accepted it.
Any AOTH/Richard Mills document is not, and should not be, construed as an offer to sell or the solicitation of an offer to purchase or subscribe for any investment.
Disclosures:
1) Rick Mills: I, or members of my immediate household or family, own securities of the following companies mentioned in this article: None. I personally am, or members of my immediate household or family are, paid by the following companies mentioned in this article: None. I determined which companies would be included in this article based on my research and understanding of the sector.
2) The following companies mentioned in this article are billboard sponsors of Streetwise Reports: None. Click here for important disclosures about sponsor fees. The information provided above is for informational purposes only and is not a recommendation to buy or sell any security.
3) Statements and opinions expressed are the opinions of the author and not of Streetwise Reports or its officers. The author is wholly responsible for the validity of the statements. The author was not paid by Streetwise Reports for this article. Streetwise Reports was not paid by the author to publish or syndicate this article. Streetwise Reports requires contributing authors to disclose any shareholdings in, or economic relationships with, companies that they write about. Streetwise Reports relies upon the authors to accurately provide this information and Streetwise Reports has no means of verifying its accuracy.
4) This article does not constitute investment advice. Each reader is encouraged to consult with his or her individual financial professional and any action a reader takes as a result of information presented here is his or her own responsibility. By opening this page, each reader accepts and agrees to Streetwise Reports’ terms of use and full legal disclaimer. This article is not a solicitation for investment. Streetwise Reports does not render general or specific investment advice and the information on Streetwise Reports should not be considered a recommendation to buy or sell any security. Streetwise Reports does not endorse or recommend the business, products, services, or securities of any company mentioned on Streetwise Reports.
5) From time to time, Streetwise Reports LLC and its directors, officers, employees, or members of their families, as well as persons interviewed for articles and interviews on the site, may have a long or short position in the securities mentioned. Directors, officers, employees, or members of their immediate families are prohibited from making purchases and/or sales of those securities in the open market or otherwise from the time of the decision to publish an article until three business days after the publication of the article. The foregoing prohibition does not apply to articles that in substance only restate previously published company release. As of the date of this article, officers and/or employees of Streetwise Reports LLC (including members of their household) own securities of Agnico Eagle, a company mentioned in this article.
Recent changes in the UK’s top job have had a positive effect on pound sterling and long-term sovereign bond yields. But the financial market reaction has been muted compared with the financial turmoil blamed on former prime minister Liz Truss and ex-chancellor Kwasi Kwarteng in recent weeks.
After the mini-budget on September 23, the markets reacted to a bad policy: Truss’s strategy to undertake massive tax cuts without providing much certainty on how this would be funded. Its reversal brought bond yields down from recent highs (essentially reducing the cost of government borrowing) and saw the pound appreciate. But overall, the market losses seen following the mini-budget have barely been recovered.
To investors, sound and stable economic policies matter much more than the person residing in Number 10. And that’s why, even with a new prime minister, recent market movements indicate investors continue to see more significant issues with the UK economy, both immediately and over the longer term.
In the short term, yields on UK sovereign bonds have shot up after the mini-budget, increasing the government’s cost of borrowing. The lack of an accompanying forecast by the Office of Budgetary Responsibility (OBR) exacerbated this negative reaction.
Before this, the Bank of England had been contemplating a bond-selling exercise to try to bring rising inflation back to its 2% target by reducing the supply of money in circulation (this is known as quantitative tightening). Instead, it had to quickly change course after the mini-budget. It not only postponed this tightening, but also restarted quantitative easing and bond purchases, promising to buy up to £10 billion in gilts per day to address a related crisis among pension funds.
Two things will now determine future sovereign bond yield dynamics and dictate government borrowing costs.
First, clarity on how long the Bank of England plans to continue its policy of quantitative easing (buying bonds to keep yields low) before it reverts to quantitative tightening again. Markets are watching these actions very carefully and any suggestion that this support by the Bank will be cut off could make traders and investors nervous.
Second, the government’s medium-term fiscal plan, currently scheduled for October 31, will also affect bond yields. Unlike the mini-budget, this plan will come with an in-depth assessment from the OBR, giving markets more information. Plus, the current chancellor, Jeremy Hunt, has brought some of the fiscal plan measures forward to ease market concerns.
It’s still unclear what kind of plan it will be, however. A debt-cutting strategy from Hunt and the new government headed by Rishi Sunak should assure the markets about the UK’s fiscal stability, but it’s still unknown whether this would happen via more taxes or less spending. Some evidence on what would be best for the economy supports raising capital income taxes (capital gains tax and inheritance tax) rather than cutting public spending or raising income taxes.
In the long term, the UK’s major problems are stagnating growth and lack of productivity. And if the new government addresses current problems by raising taxes and cutting spending – alongside higher interest rates from the Bank of England – there will be more economic pain.
Changing global economy
Many countries are suffering similar issues to the UK, contributing to a weak global economic outlook in general right now. After a prolonged period of historically ultra-low interest rates, increases – so-called normalisation of monetary policy – were expected in most countries. But a sharp surge in inflation due to Russia’s invasion of Ukraine and pandemic-era supply chain issues have caused most central banks to scramble to tighten monetary policy even further by increasing rates more rapidly.
Recent rate changes by central banks
Interest rate changes by central banks in the UK, Japan, the US and the Eurozone between October 2012 and October 2022. Author’s chart using Bank for International Settlements data.
These rate hikes and policy tightening strategies by central banks could create significant financial and fiscal instability. Already, the US Federal Reserve’s unwinding of its balance sheet from a peak of US$8.97 trillion (£7.9 trillion) in April 2022, for example, caused the dollar to appreciate by more than 13% in the last six months. This has created challenges for emerging market currencies, as well as major currencies – the yen, pound sterling and the euro – which have all depreciated considerably against the US dollar.
This has added to inflationary pressures, particularly in the Eurozone and UK, but it also affects sovereign bond yields, challenging economic stability in these countries. Since August, the cost of borrowing has more than doubled for many.
The rising cost of government borrowing
10-year sovereign bond yields from August to October 2022. Author’s chart using Thomson Reuters data.
But to address rising inflation, even more central banks will want to shrink their balance sheets by selling bonds. The total size of the asset purchase programmes of the main four central banks alone is about US$26.7 trillion. With a weak global economy and these other financial fragilities, this is going to be a painful exercise for the global economy.
Indeed, such tightening will increase the cost of government borrowing further, creating major issues, particularly for highly leveraged governments, and those still paying off pandemic-era support such as the UK and Eurozone.
The UK specifically, is also dealing with a shift in the global economic centre of gravity away from its economy. In less than two decades, the UK has shrunk in relative terms from being an economy larger than China to being about nine times smaller. And the pound no longer enjoys the same status as the US dollar, meaning financial markets will punish it severely if it steps out of line.
This means the new UK government faces a tricky task in reigniting global investor confidence in its economic stability, even with a new prime minister widely seen as a steady hand.
Kenya recently lifted a ban on the cultivation and importation of genetically modified crops amid the worst drought in 40 years and soaring food prices. This includes white maize, the country’s main staple. The decision was welcomed by scientists who see GM crops as the answer for food security. But it is opposed by a spirited lobby who are concerned about potential risks to health and the environment. Benard Odhiambo Oloo, who is a food safety and quality expert, provides insights into the debate.
What are GMOs?
Genetically modified organisms (GMOs) refer to plants, microbes or animals that have had their genetic make-up altered through the introduction of a select gene from another unrelated species. For crops this is usually for the purpose of conferring a desired characteristic such as increased yield, insect tolerance or drought resistance among others.
Genetic engineering refers to the science involved in the selection of desired genes responsible for specific traits from a species and transferring them into the genes of another organism, thus modifying the second species’ genetic makeup.
Conventional breeding would typically take 10-15 years. The turnaround for genetic engineering is usually less than five years. But, due to the strict regulations on commercialisation, most GM crops have been in the pipeline for decades especially in Africa.
How prevalent is their cultivation in Africa?
The approval and cultivation of GMOs in Africa has been slow. Only a few countries have allowed their commercialisation. South Africa has been a leader in adoption of GMO crops in Africa and has had experience spanning over a decade. The number of countries in Africa where GM crops are cultivated has grown from three in 2016 to 10 by 2022. These 10 countries have commercialised different types of GMO crops.
Apart from South Africa, Egypt, Sudan, Ethiopia, Burkina Faso, Malawi, Nigeria, Ghana and eSwatini have allowed the planting of GMO seeds. A number of other countries are at different stages of development and commercialisation of a number of GMOs.
The leading GMO crops under consideration across different countries (Kenya, Malawi, Uganda, Nigeria, Ghana and others) are GM cotton (tolerant to African bollworm), GM cassava (resistant to cassava brown streak disease) and GM maize (resistant to stem borer) among many more.
This year Ghana approved the release of pod borer resistant cowpea, thus joining the growing list of African countries to commercialise GM crops. This is the first genetically modified crop to be approved in the country.
In December 2019 the Kenyan government gave the nod for the commercialisation of GMO cotton. After more than two seasons of growing GM cotton, Kenyan farmers have expressed satisfaction with the good yield from Bt cotton in spite of the drought conditions in the last few seasons.
Elsewhere in Africa, farmers have also reported significant reduction in the cost of production through reduced spraying for control of insect pests and diseases. Controlling African bollworm, for example, was costly and the pest caused losses in cotton farming.
This list is expected to keep growing even though in most African countries the cultivation of GMOs has experienced protracted delays through regulatory, political and social blockades.
Why did Kenya ban GMOs? What has changed?
Kenya banned GM crops in 2012. The ministerial statement on the ban was largely informed by a 2012 a scientific report dubbed the Séralini study that associated GMOs with cancer in rats.
Anti-GMO activists have often referred to that report and in addition presented the unknown impact of the modifications as the main reason for pushing for bans. The other issues range from fears about the effect of GMO, the mixed signals from EU about health and safety of GM foods, and the potential risk of GMOs to the environment and biodiversity.
The activists also cite the fear of possible effects of GMOs on non-target organisms and potential development of resistance to insect-pests by the GM crops. Lastly, food safety fears of GMOs remain pertinent in some parts of the continent.
The Kenyan government’s change of stance was underpinned by a number of developments. First of which was the report by a task force on genetically modified foods that resulted in proper scientific regulation and presence of a strong regulatory framework.
Another factor is the lingering drought in which over 4 million Kenyans currently face food insecurity. This may have led the government to consider more radical solutions despite opposition.
The government has decided to review each application for introduction of GMOs on a case-by-case basis.
What could go wrong? And what mitigation plans are there?
There are three main concerns about what could go wrong with GMOs. These are unintended harmful effects, food safety, environmental safety and social attitudes, including fears that GMOs are a case of “man playing God”.
There is also the concern of unintended harmful effects of GMOs on the environment. In anticipation of these risks, scientists working in the field of GMO have created a raft of regulations. These regulations aim to evaluate whether GMOs are just as safe to humans and the environment as their conventional counterparts before they can be accepted for commercialisation.
Food safety: Food safety studies including tests of allergenicity (the ability of an antigen to induce an abnormal immune response) are a mandatory requirement for commercialisation of GMOs. Countries have also instituted biosafety authorities with a mandate to regulate the development and commercialisation of GMOs.
Environmental safety: An international agreement provides a framework for handling, transport and use of GMOs. It provides a clear road-map for evaluation of the impact of GMOs on the environment. It has instituted the practice of post release monitoring and evaluation for 10 years or more after the release of a GM crop.
The potential development of weeds that can resist one or more specific herbicides – so-called super weeds – is a case in point. Herbicide tolerance has helped farmers to control weeds and significantly reduce cost of GM crop production. This is because crops can be genetically modified to confer resistance to common herbicides, such as glyphosate. There is a chance however that farmers can over-rely on this technique of weed control to the detriment of the weeds developing resistance.
The potential for such resistance must be closely monitored. In Kenya, it would fall upon county governments through the extension officers to report any early cases – and to take action – if there are any potential signs of resistance. The aim should be to use multiple approaches to weeds and pest control also referred to as integrated pest managanent systems.
Socio-cultural aspects: The government must make every effort to address people’s concerns about GMOs. This includes pointing out that humans have modified crops for thousands of years. GM foods have now been grown and consumed for over 20 years in different countries. There is so far no scientific evidence to confirm any of the fears. GM crops have been evaluated to be just as safe for human consumption and to the environment as conventional crops.

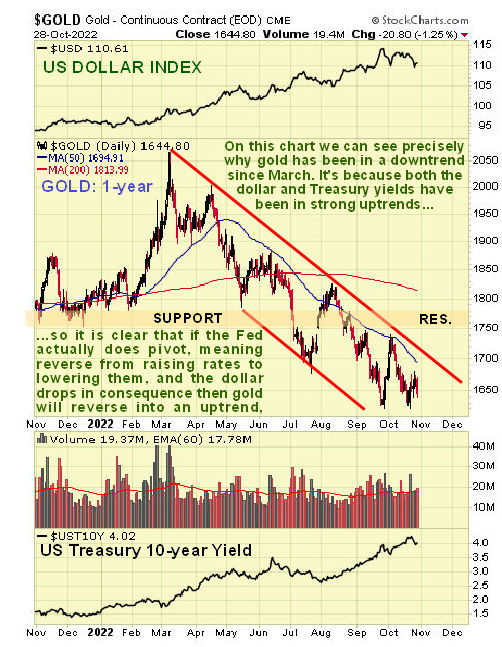
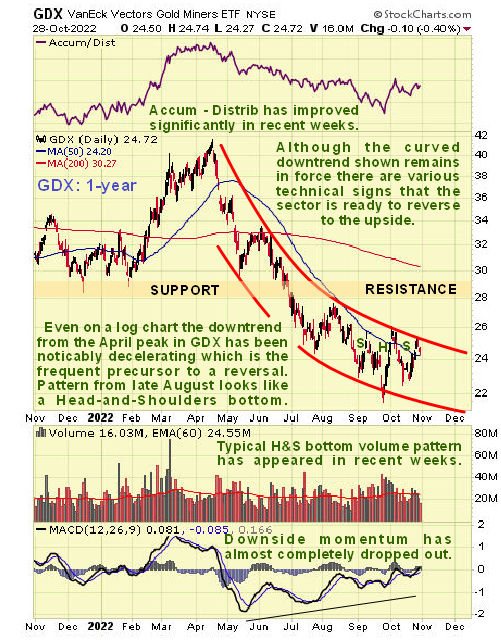
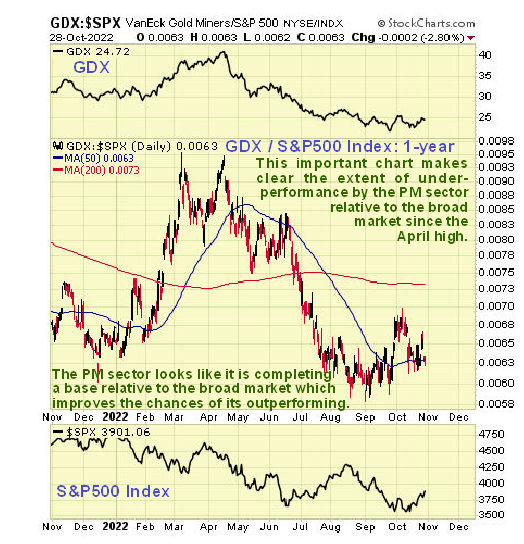
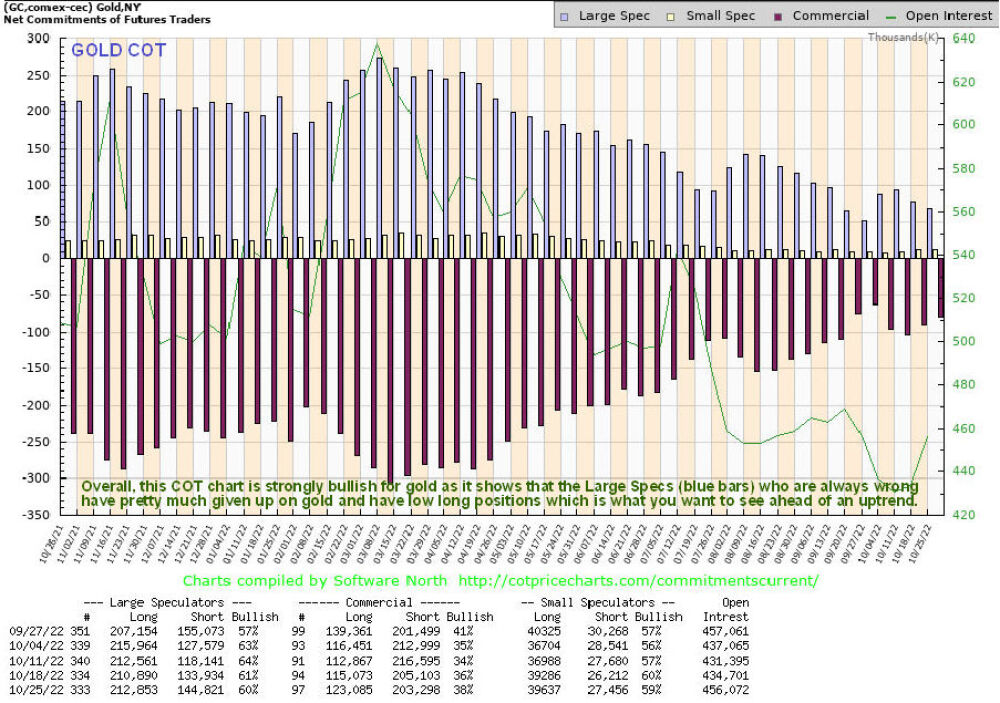
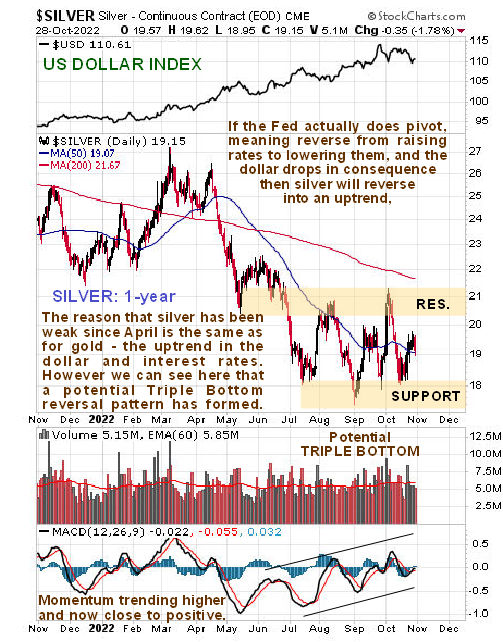
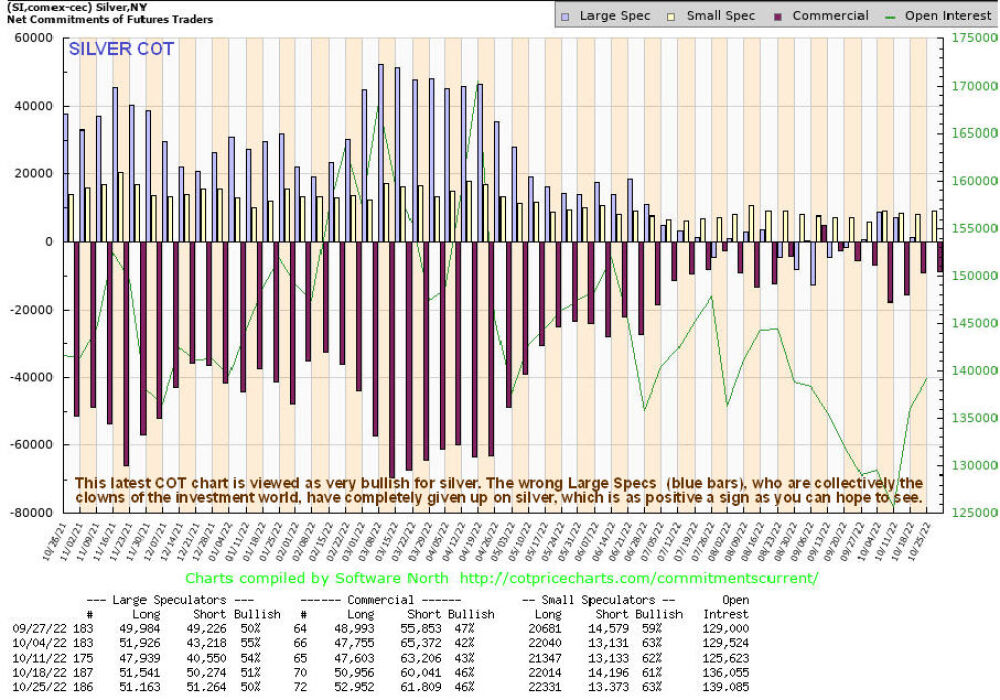
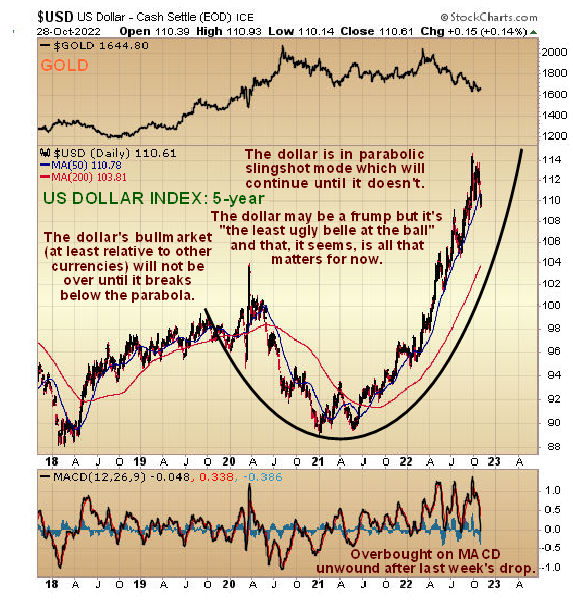
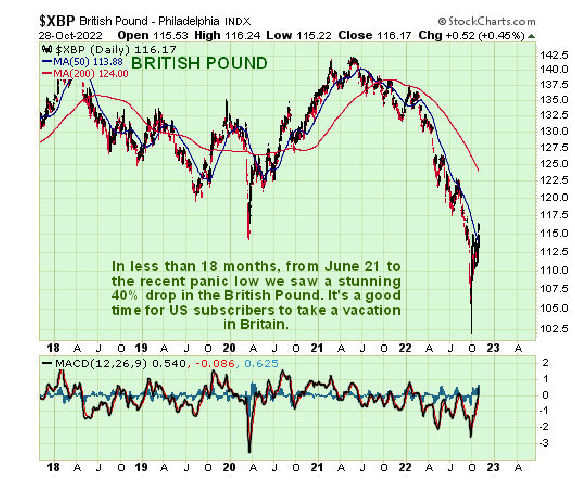


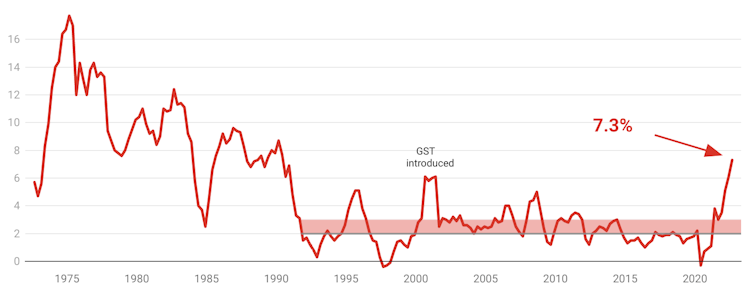


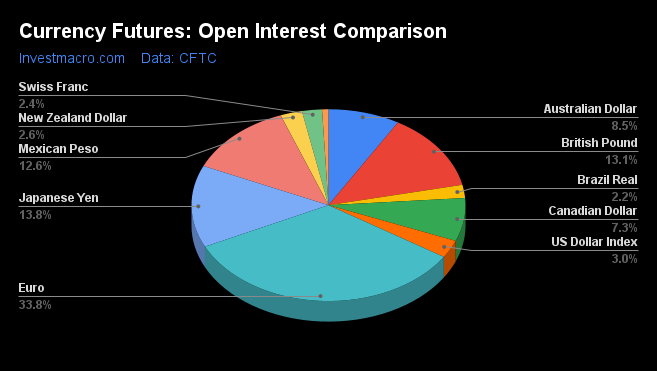
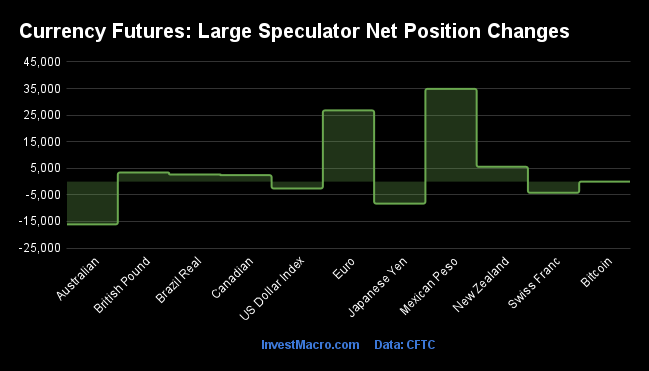
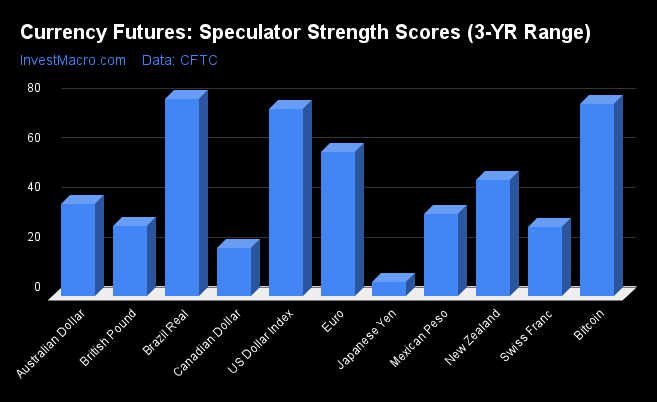
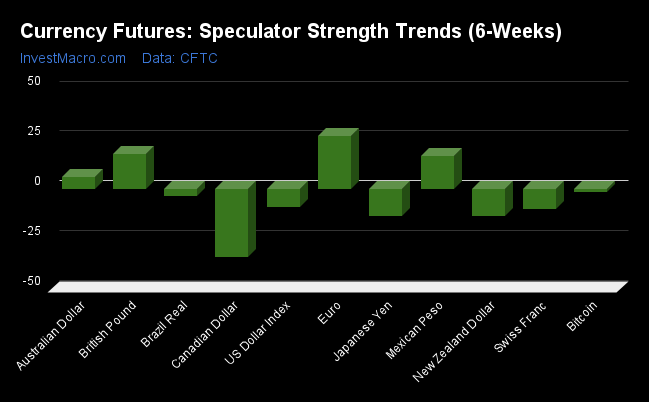
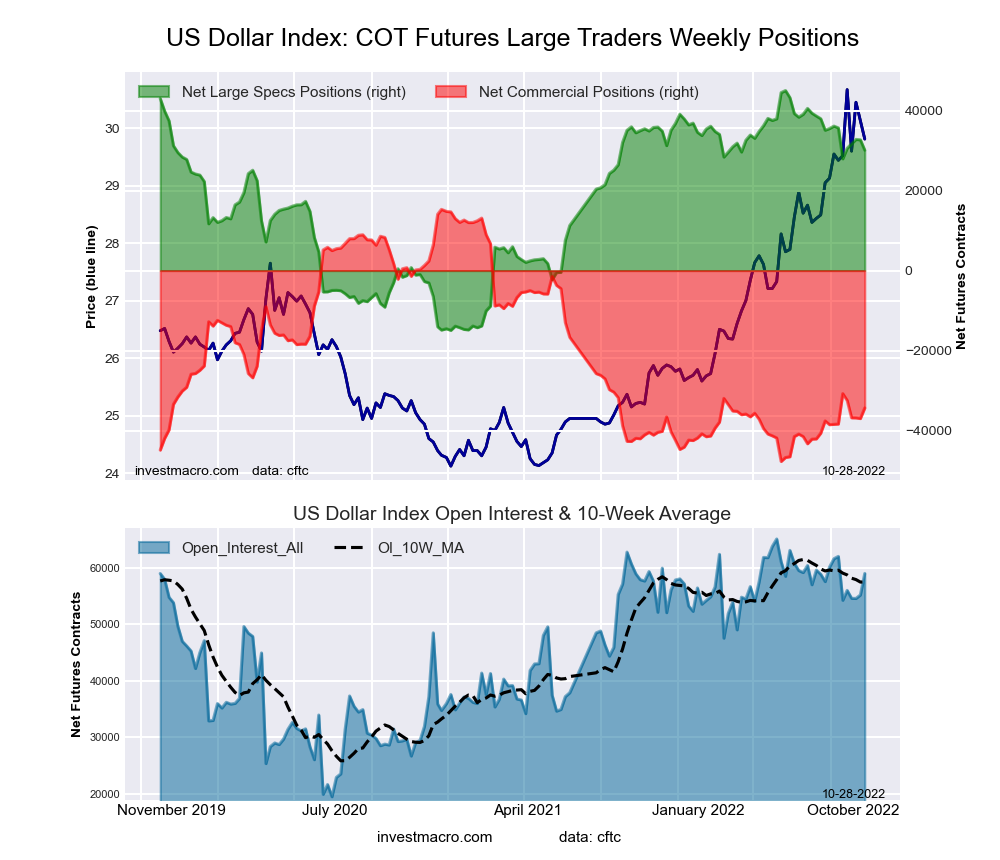
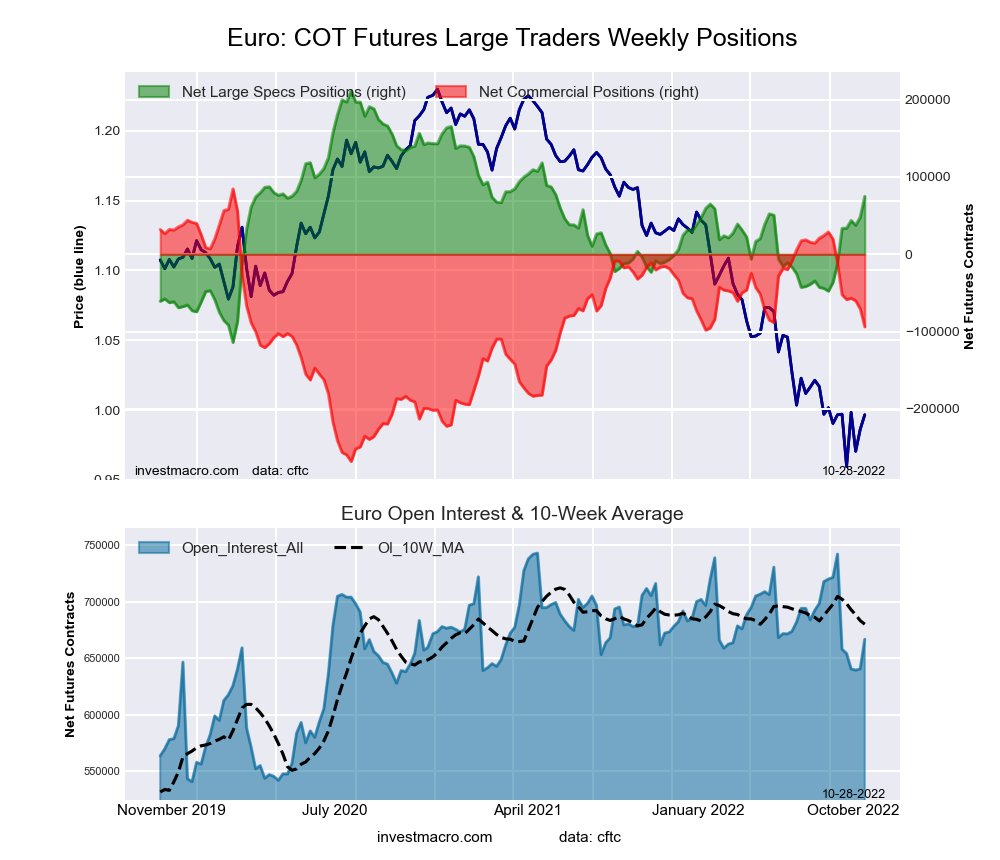
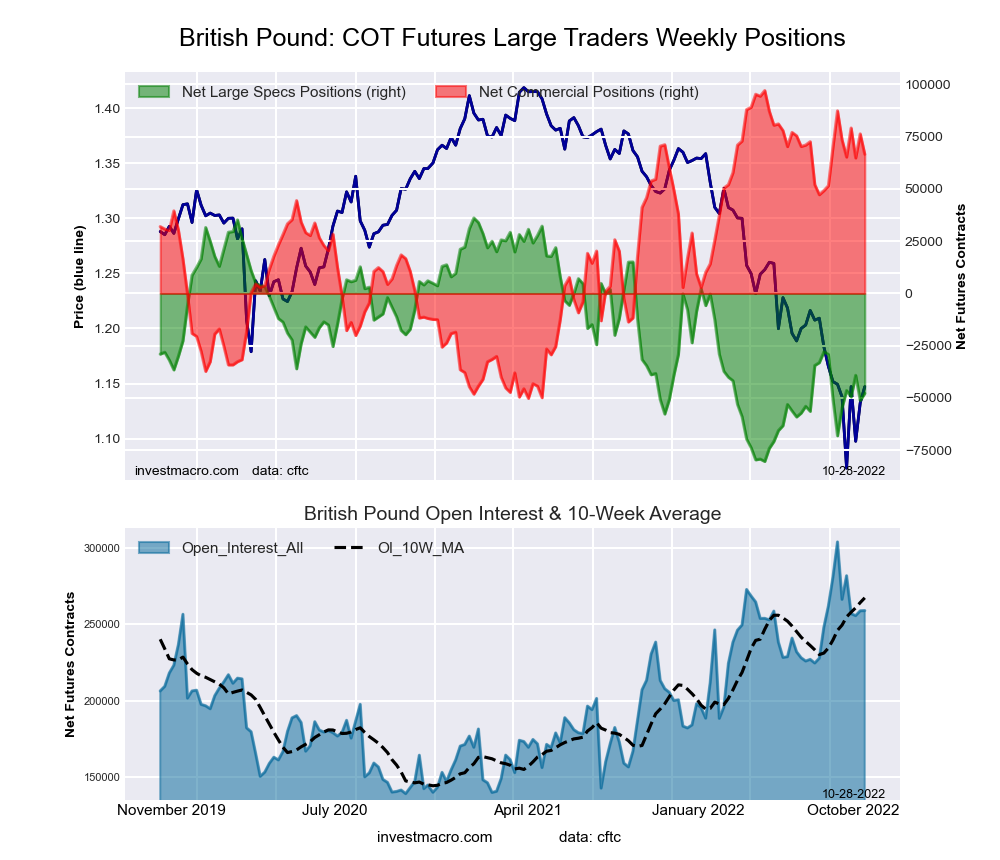

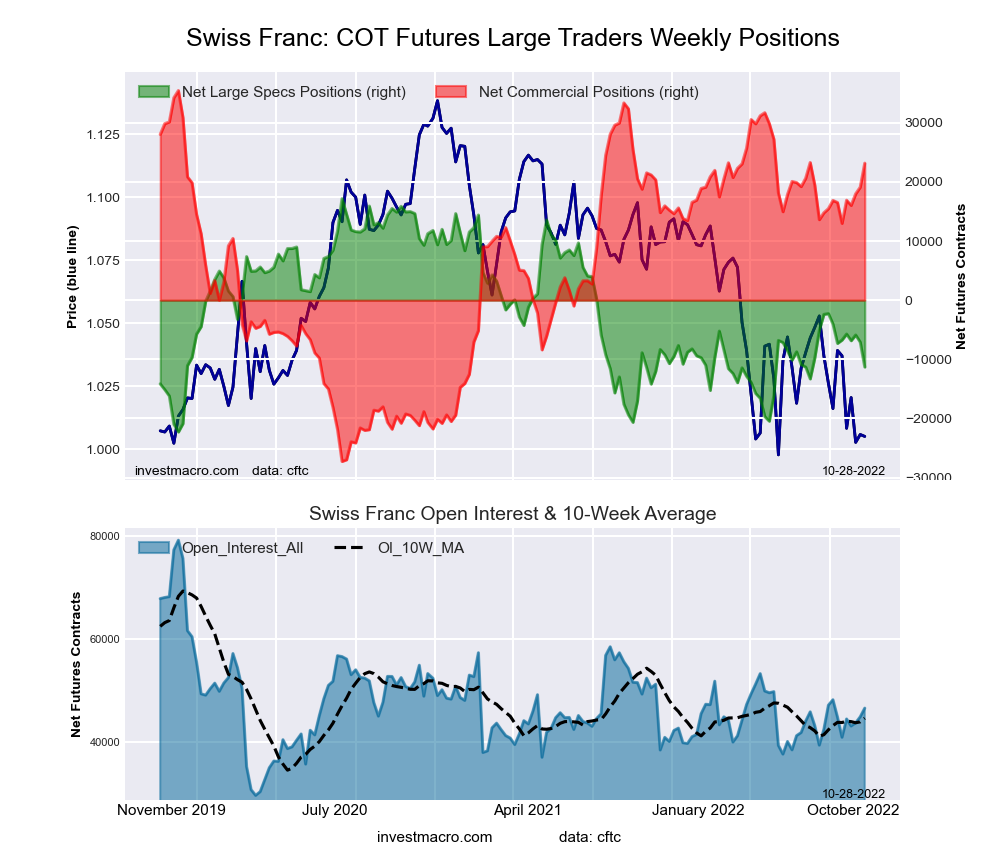
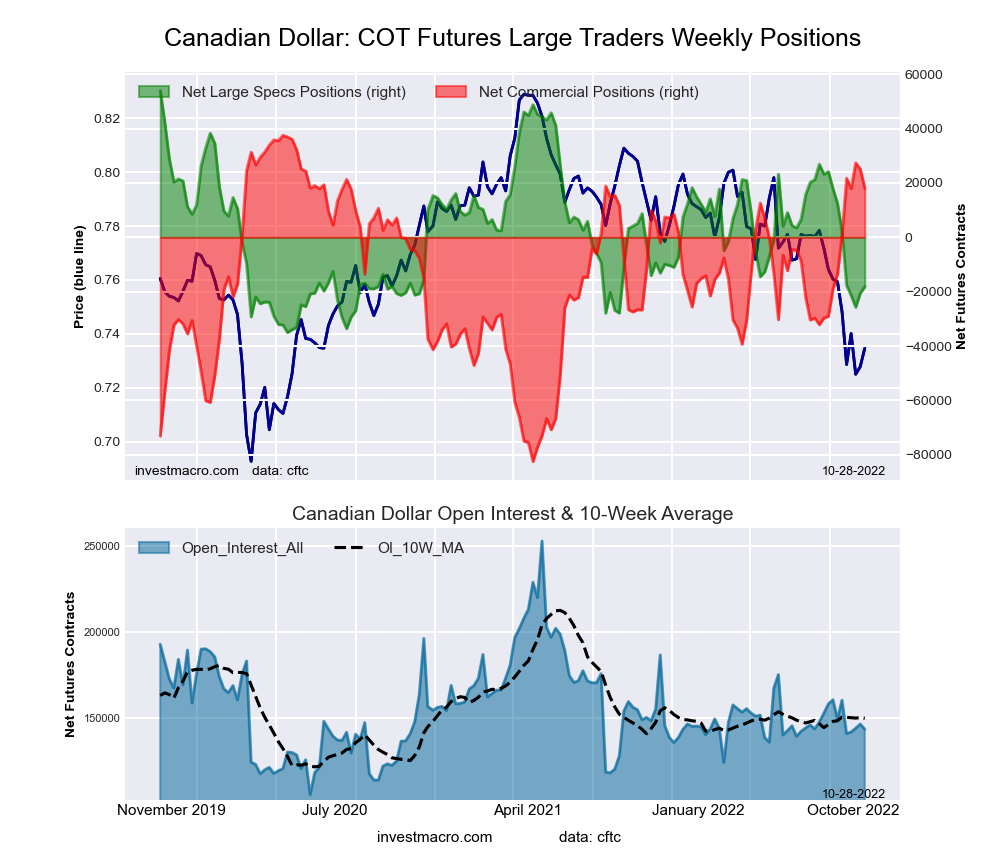
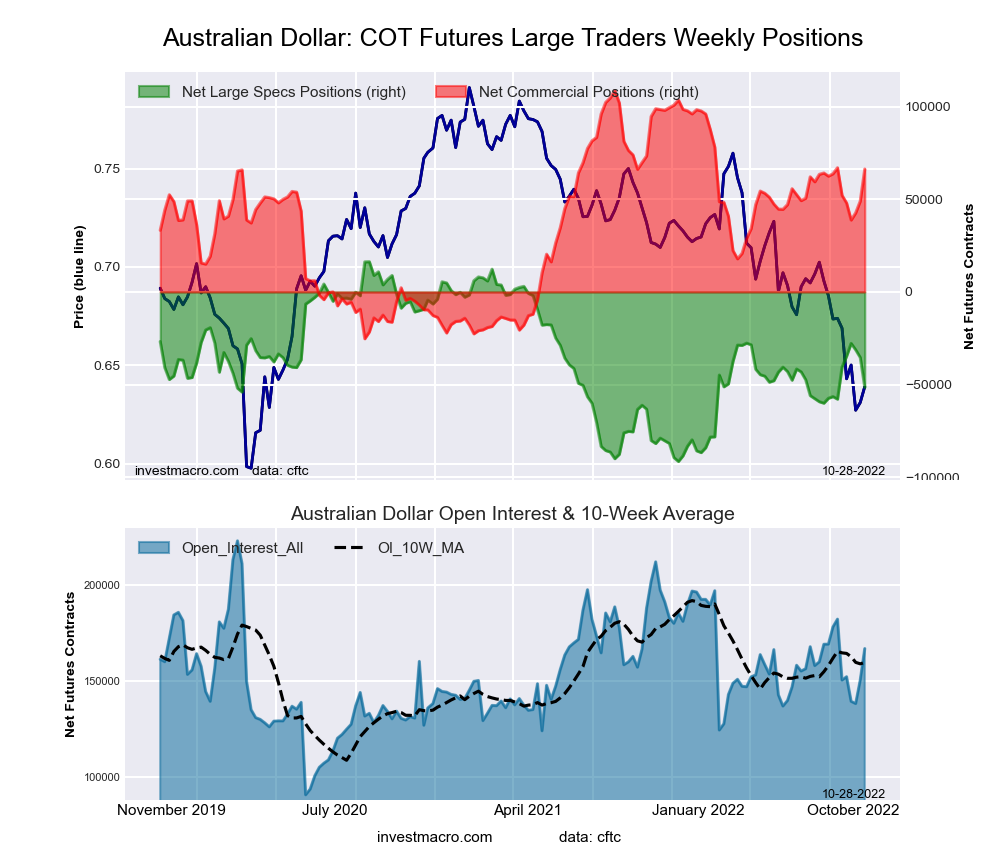
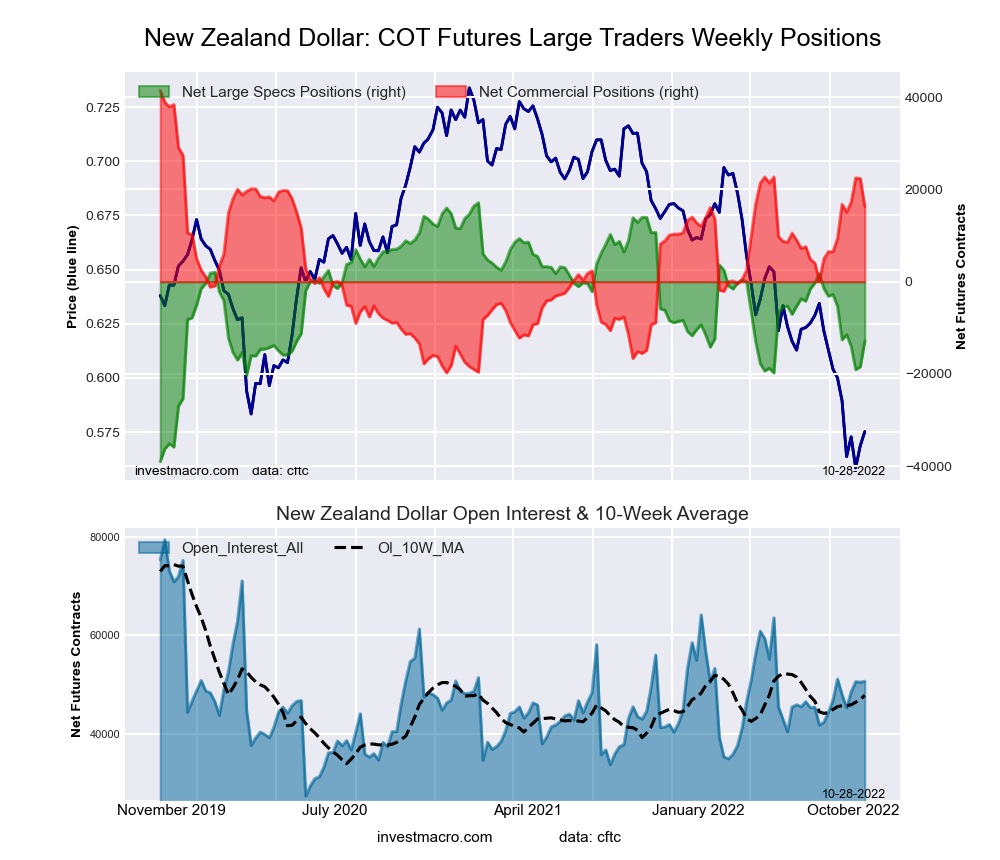
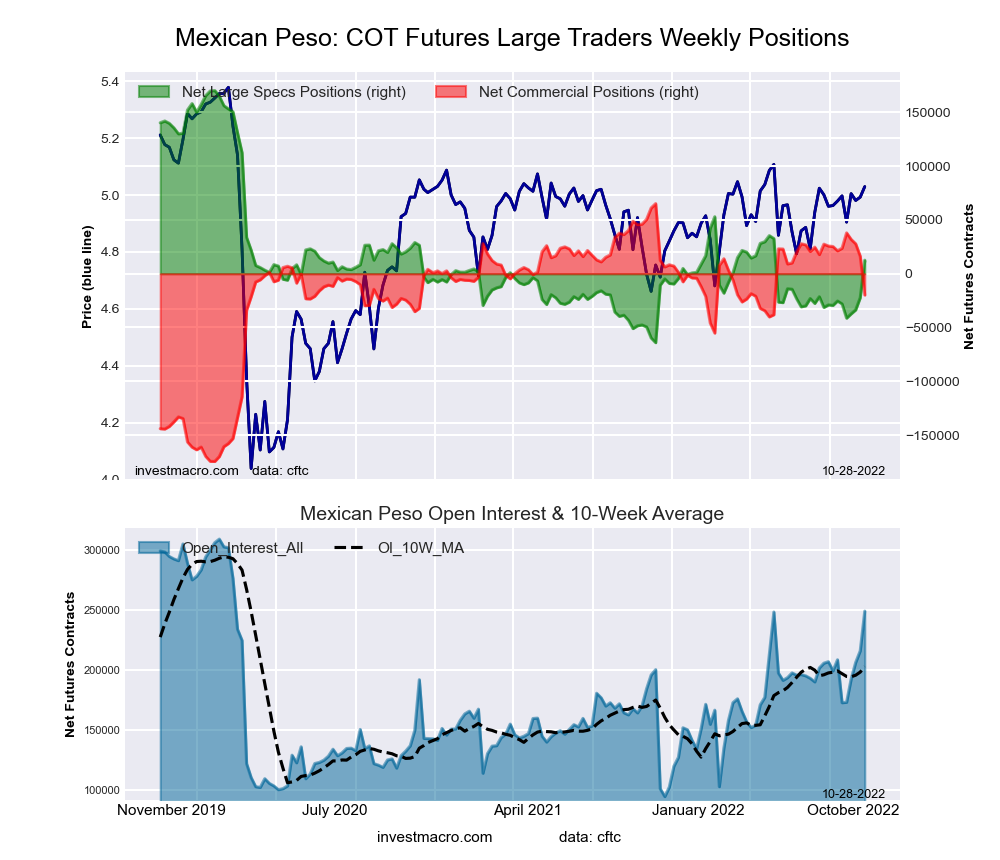
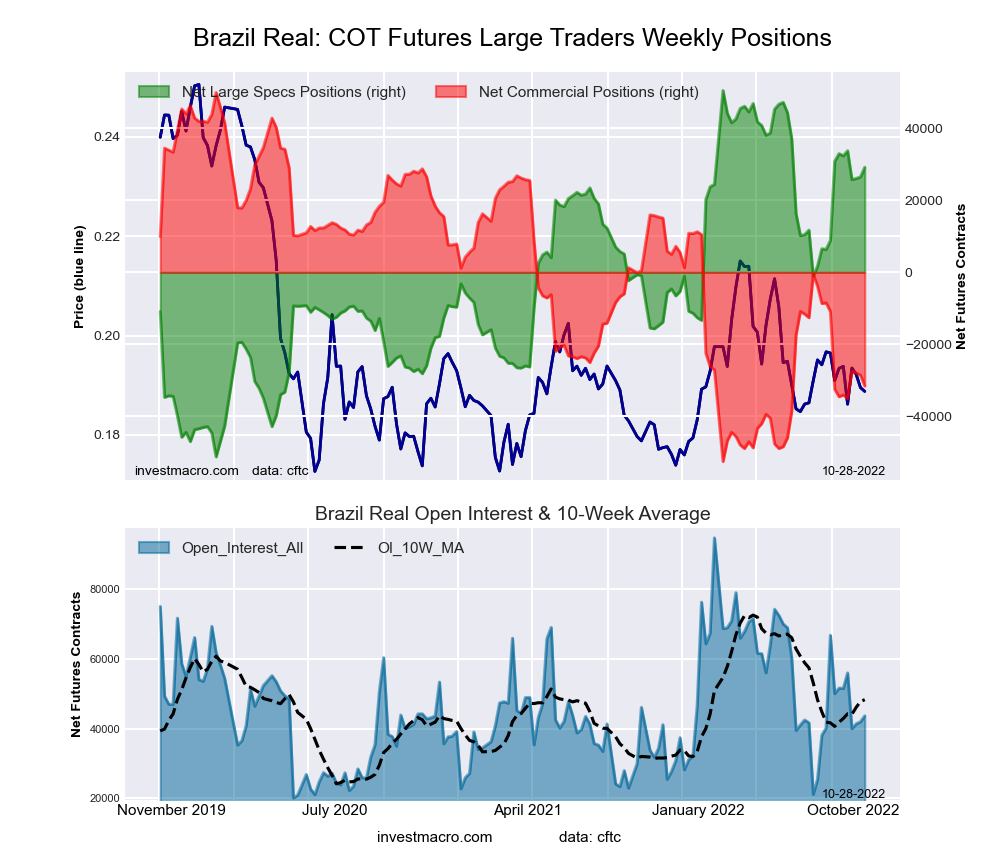
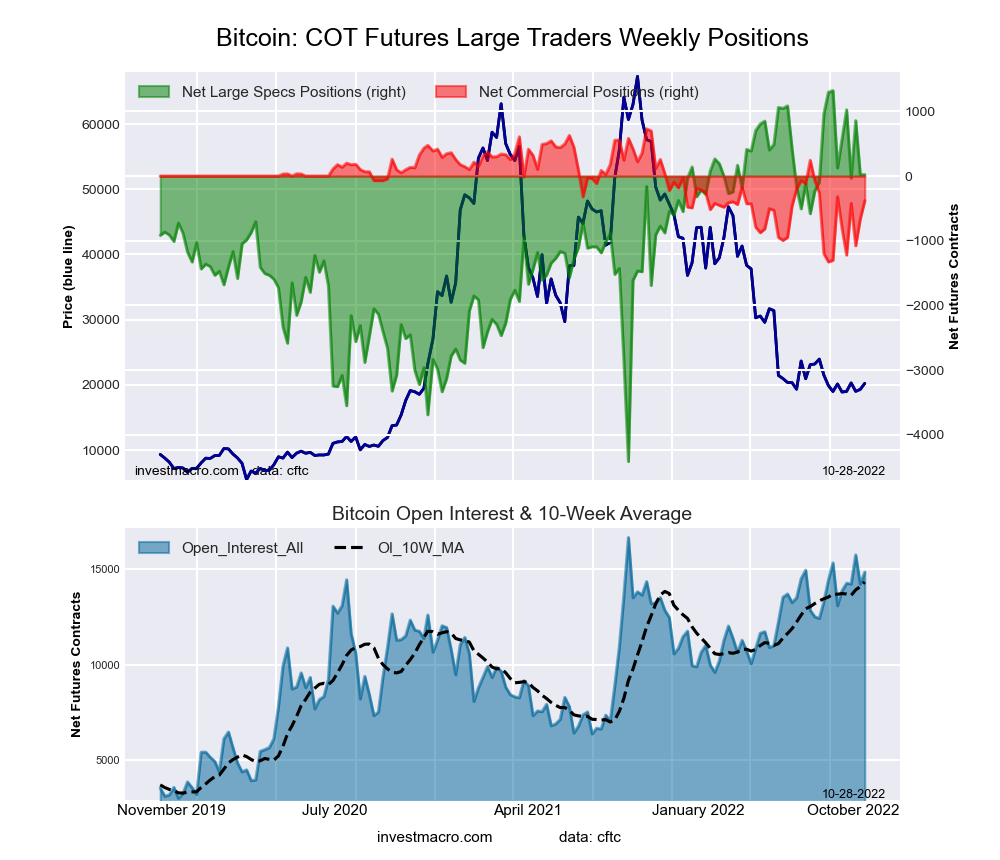

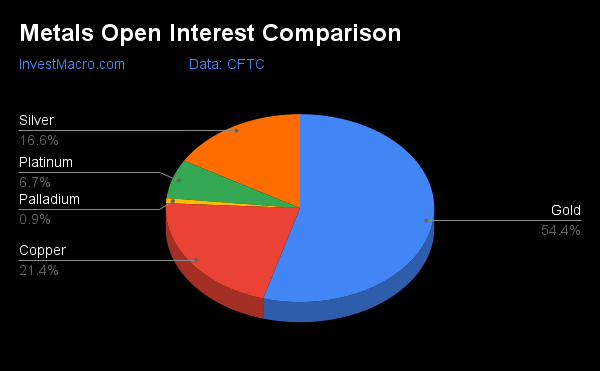
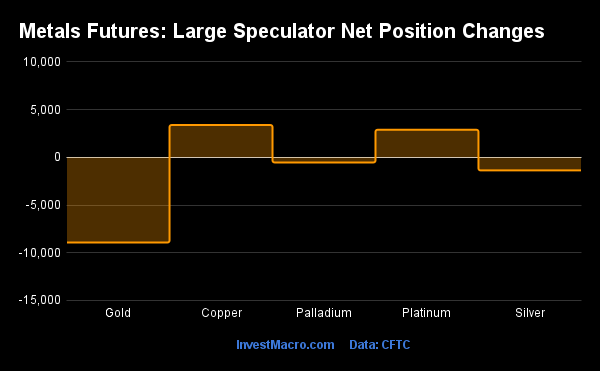
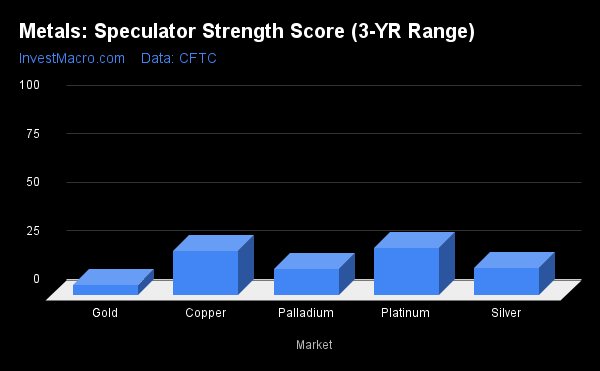
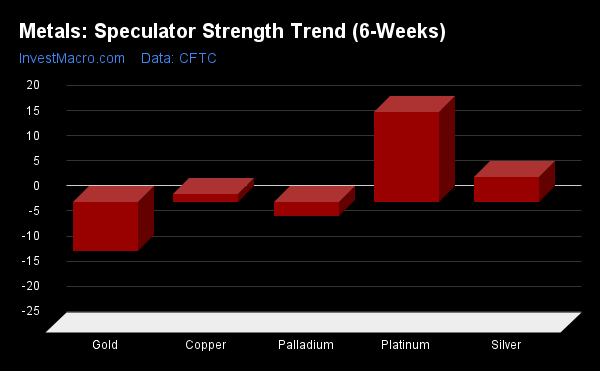
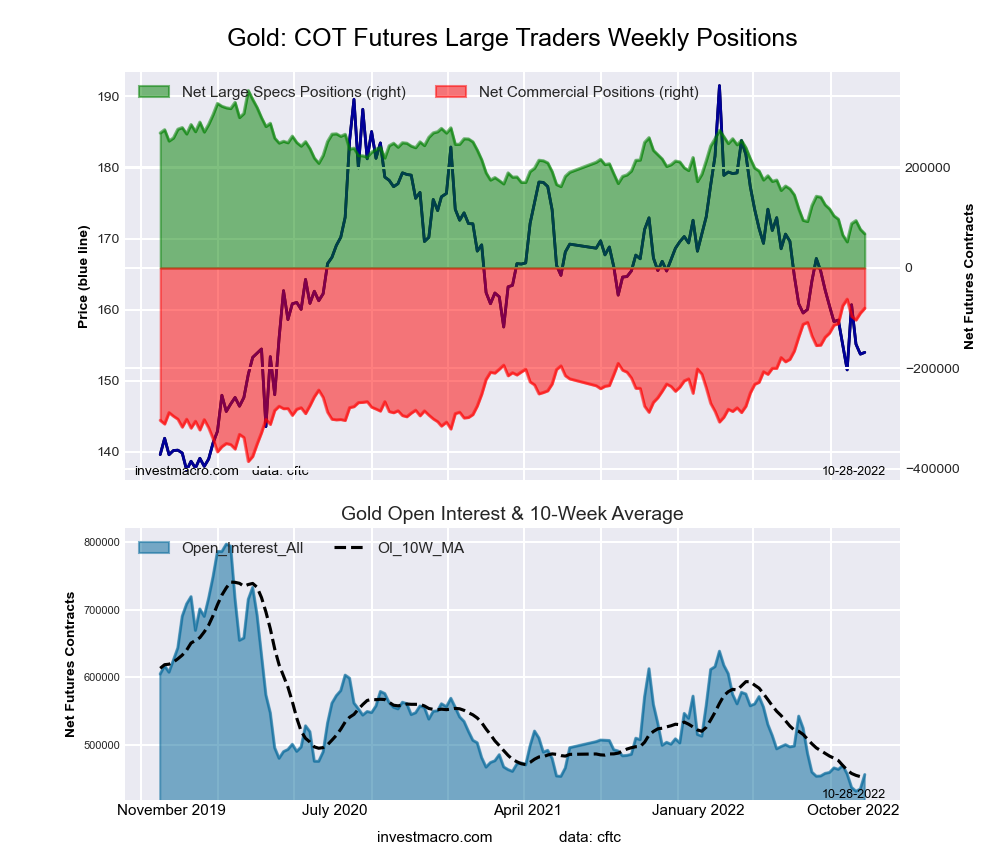
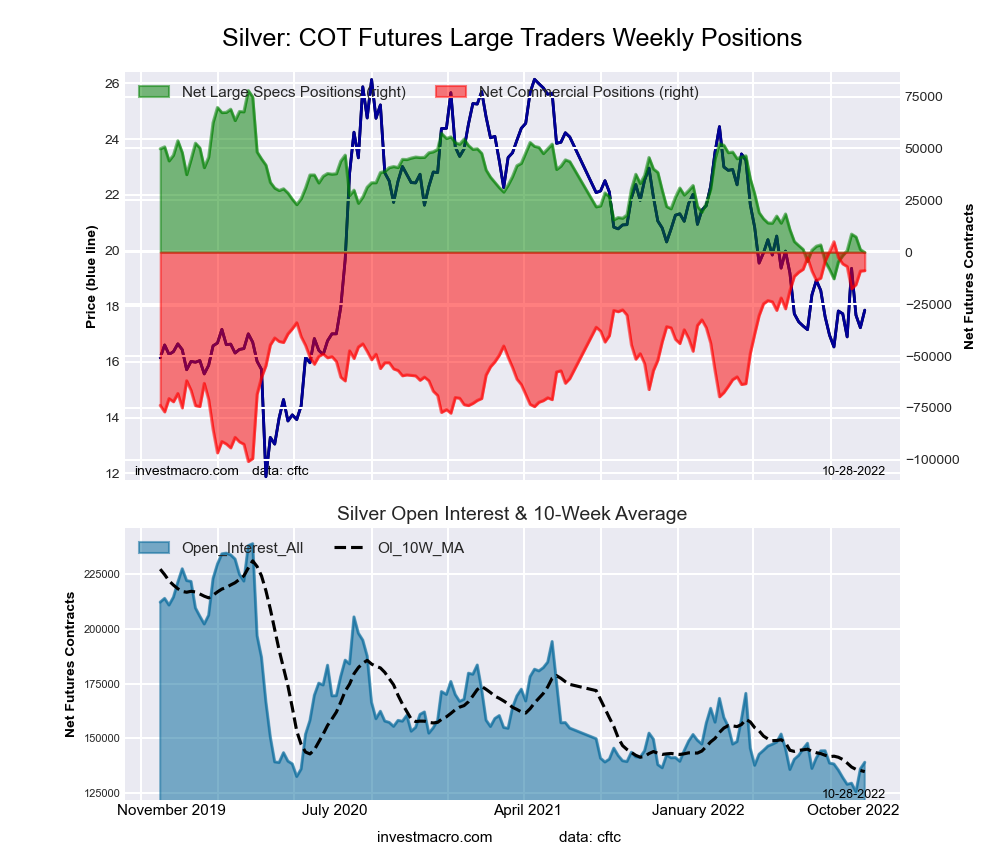
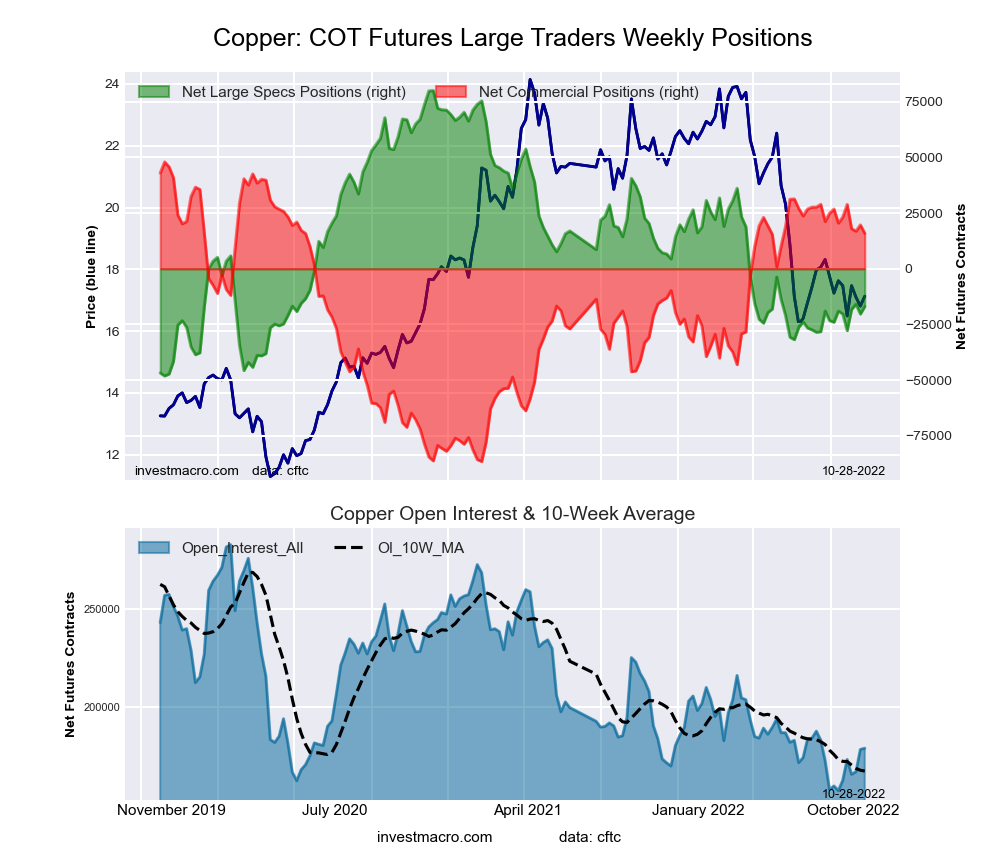
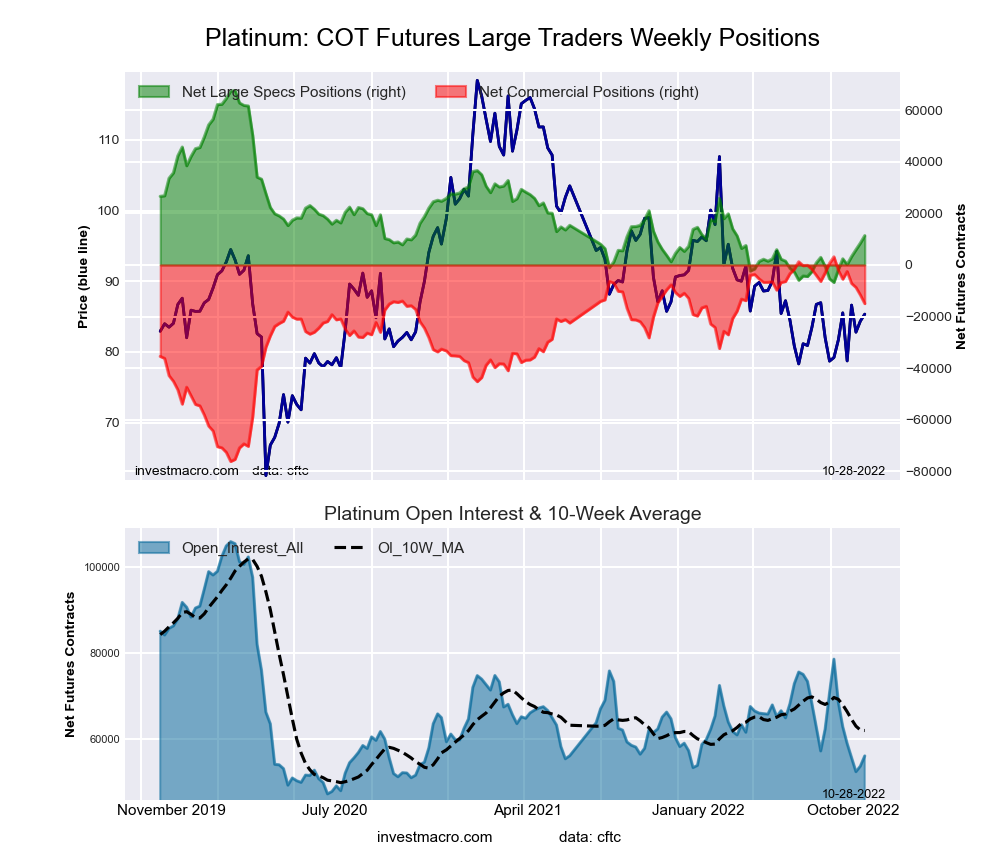
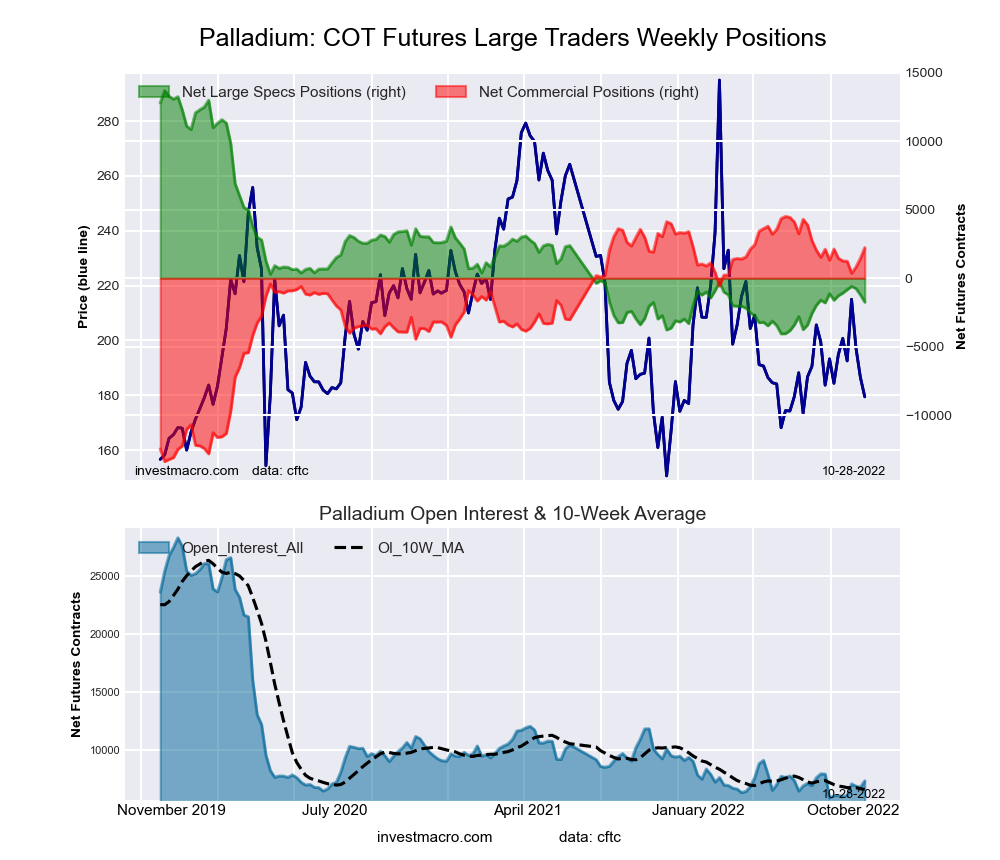


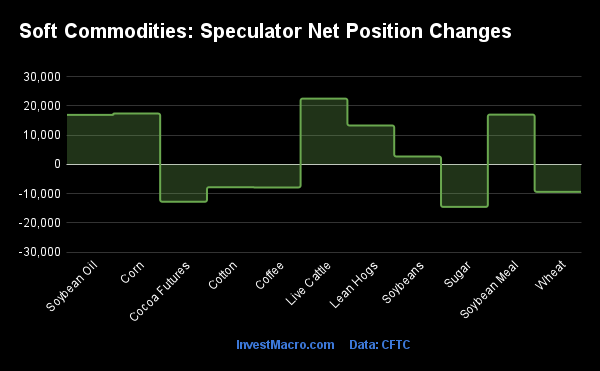
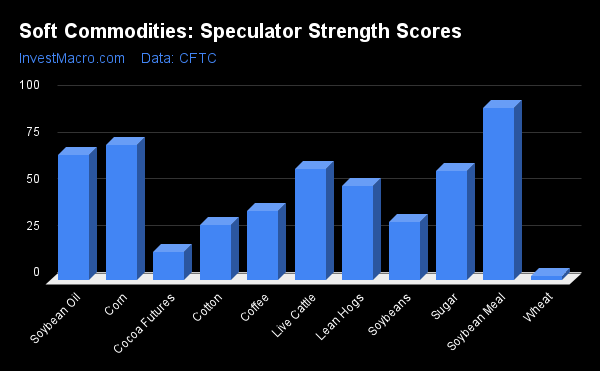
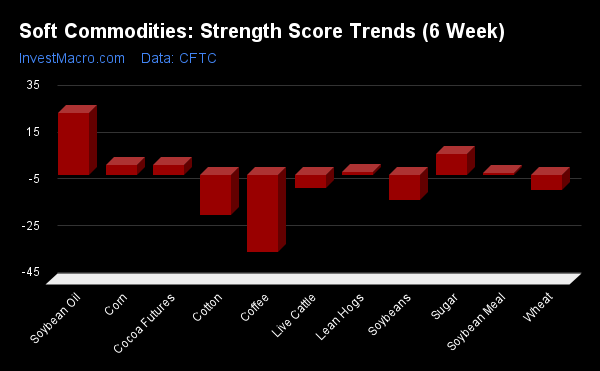
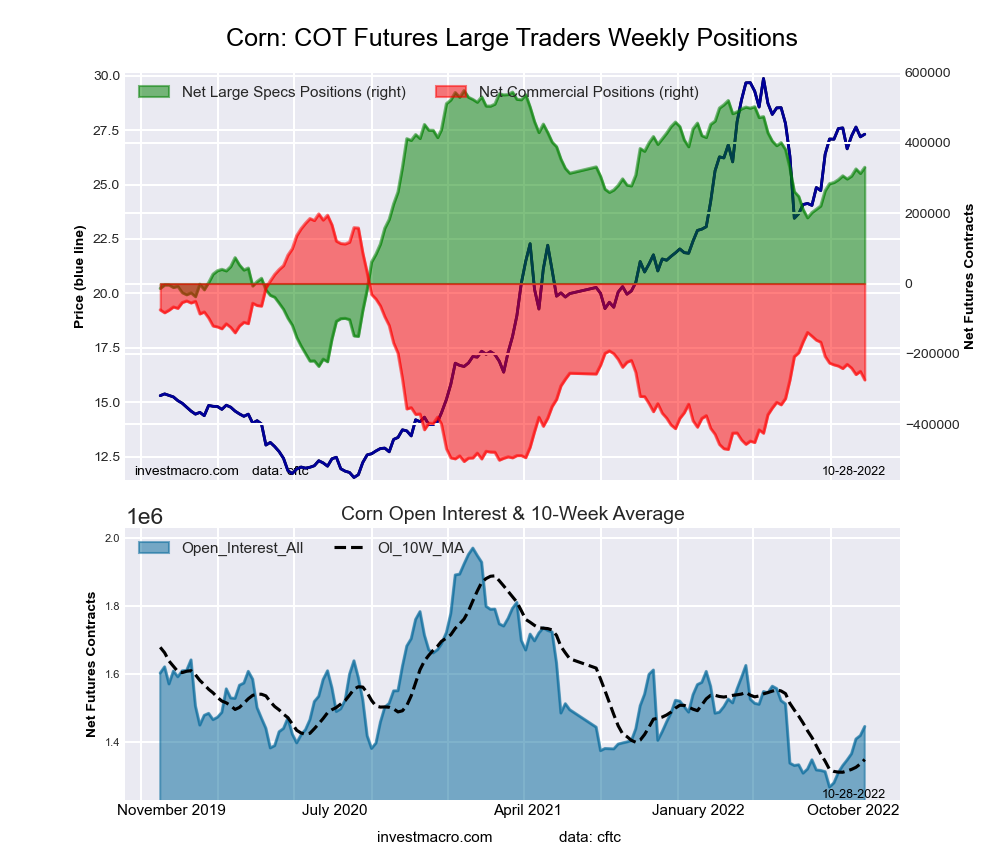

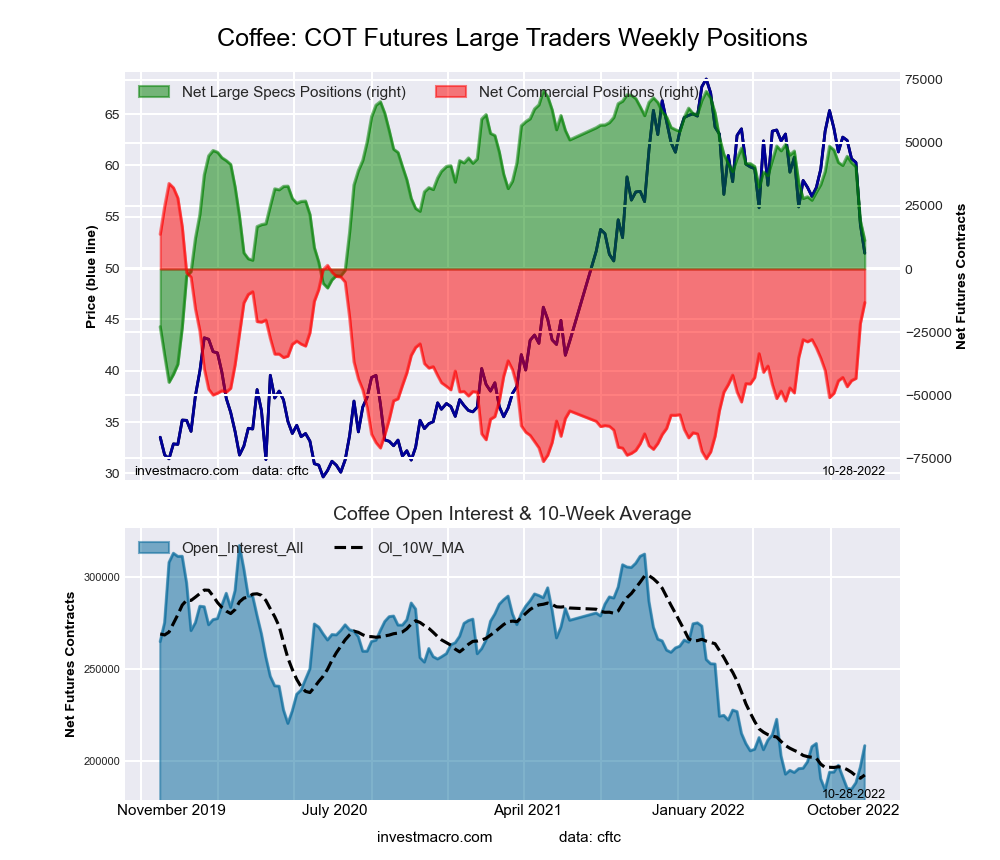
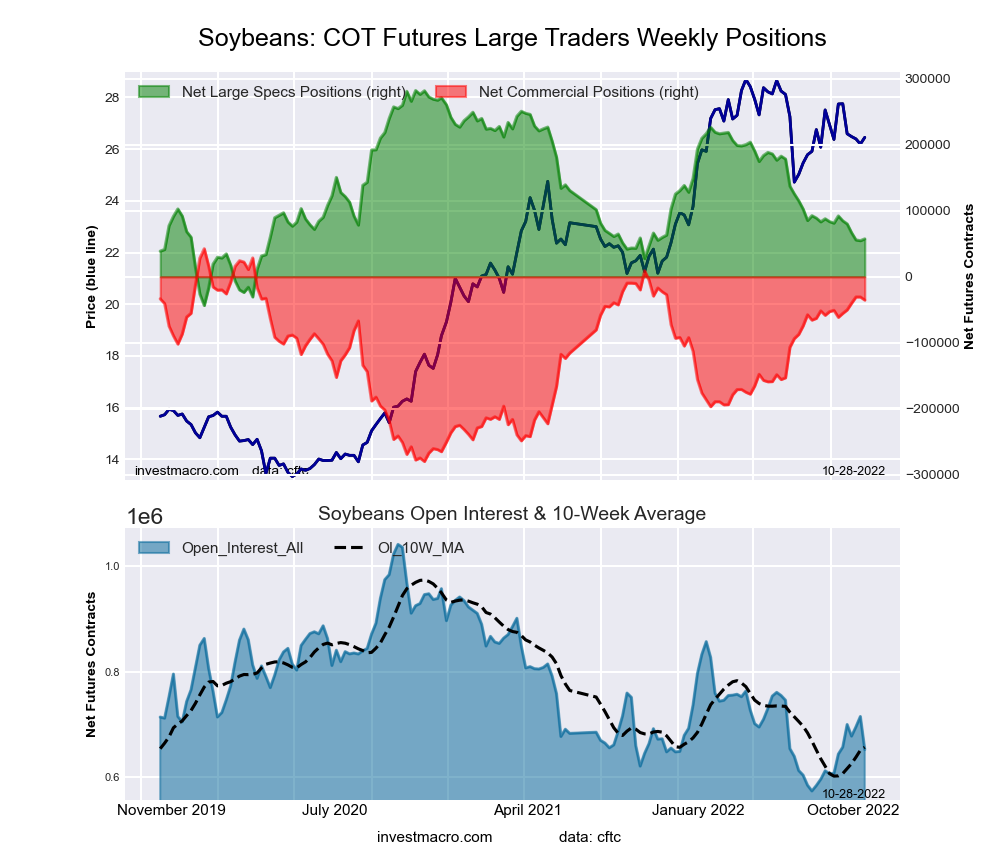
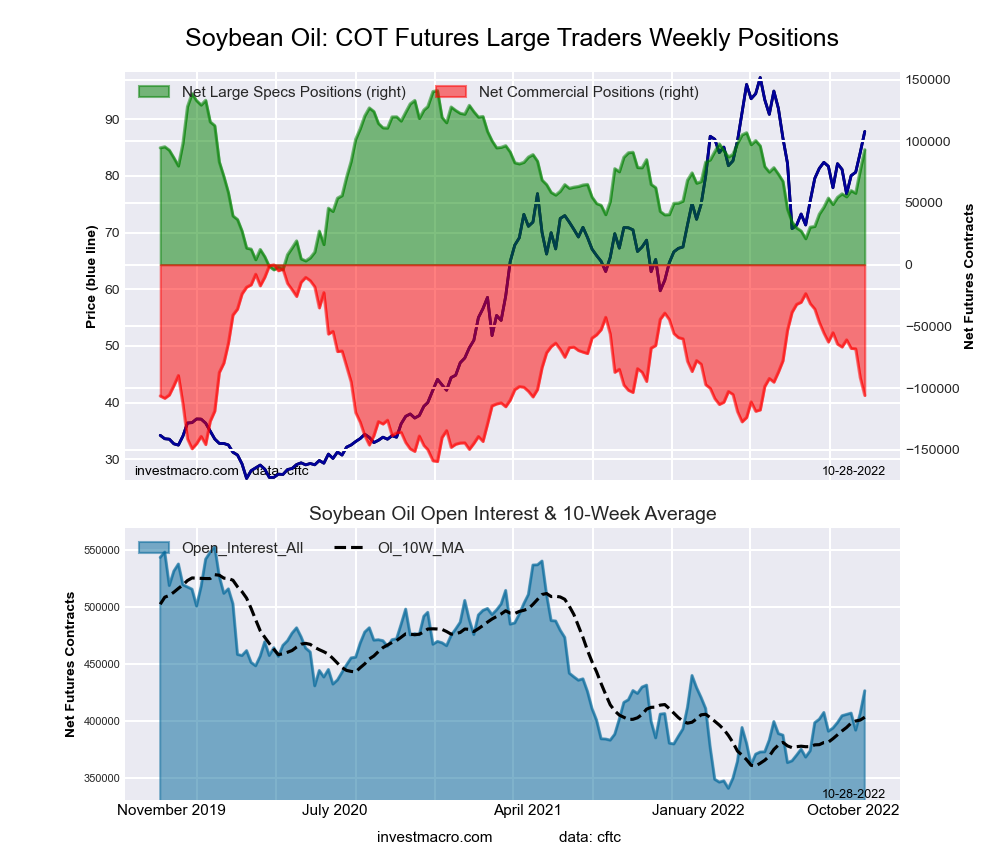
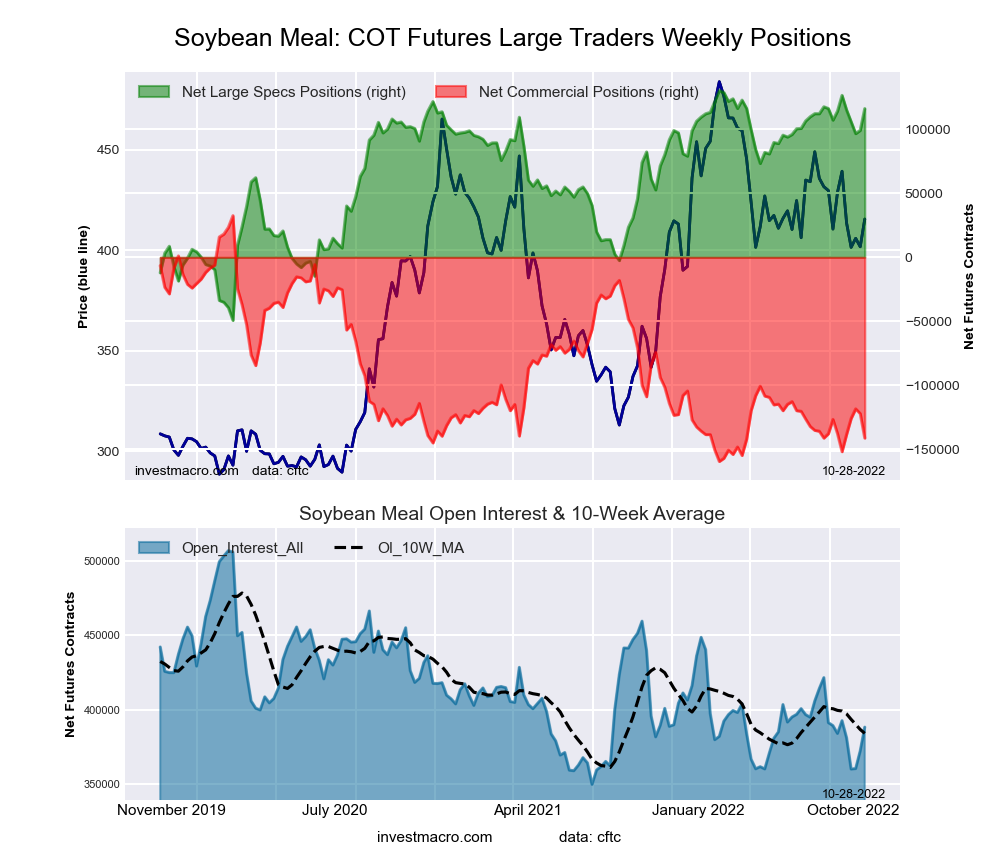
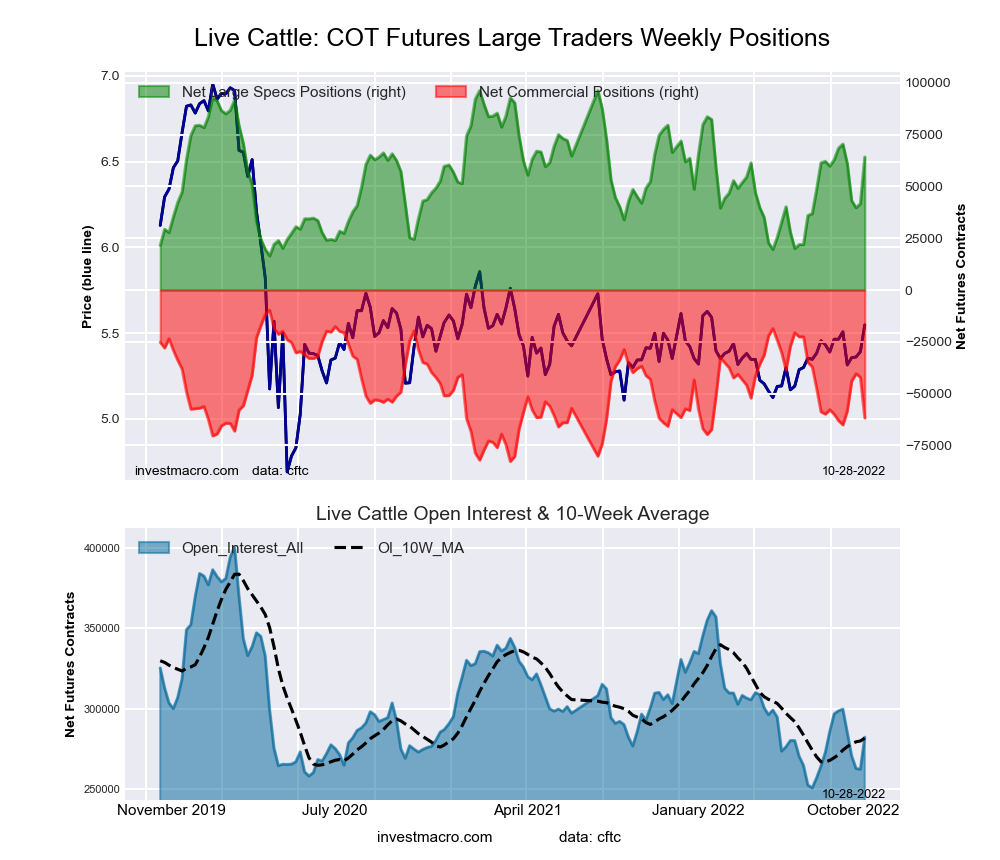

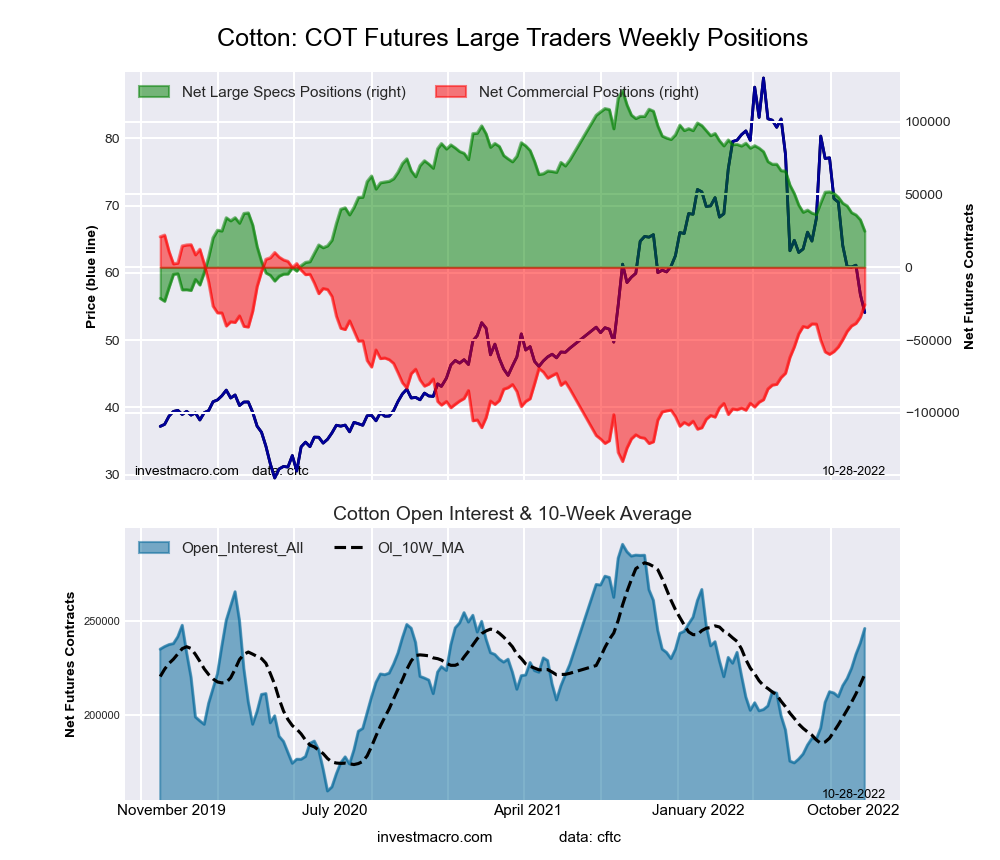
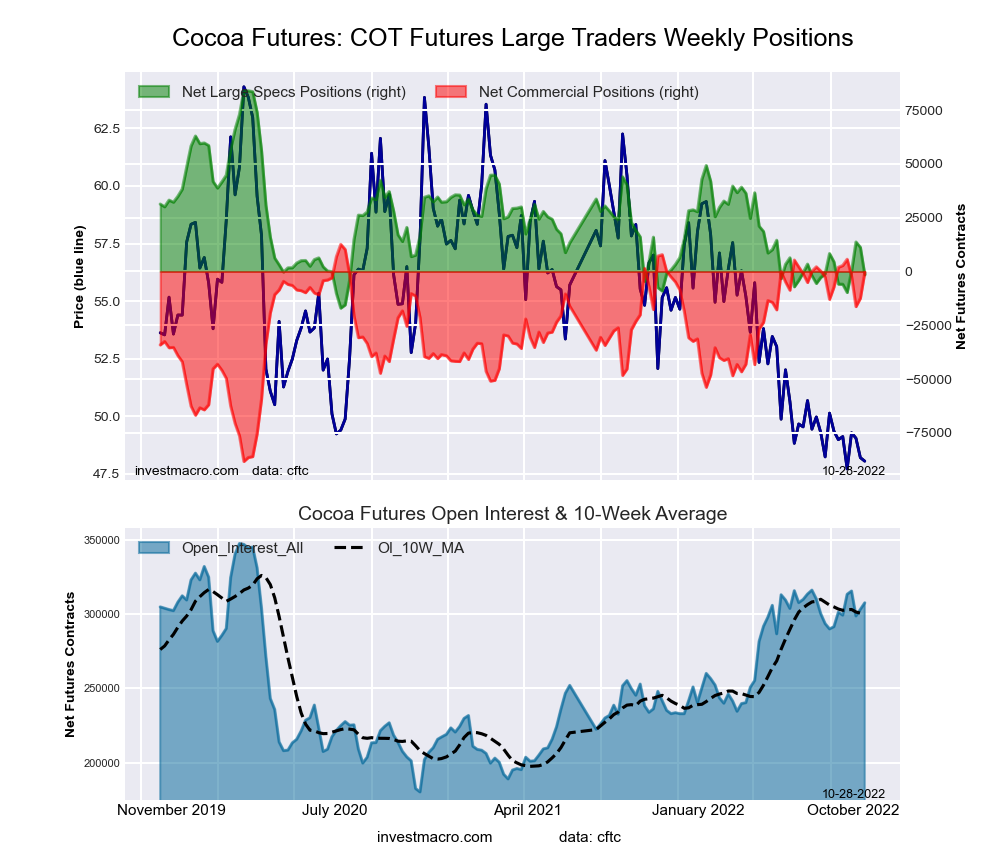


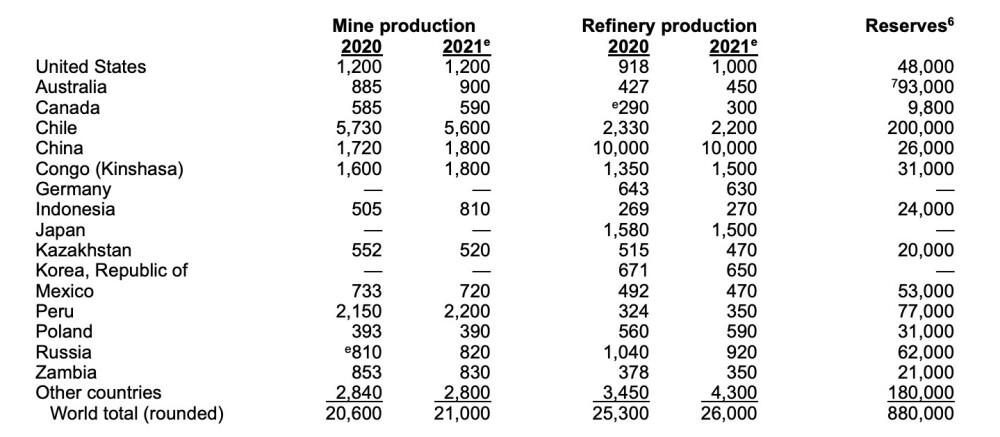
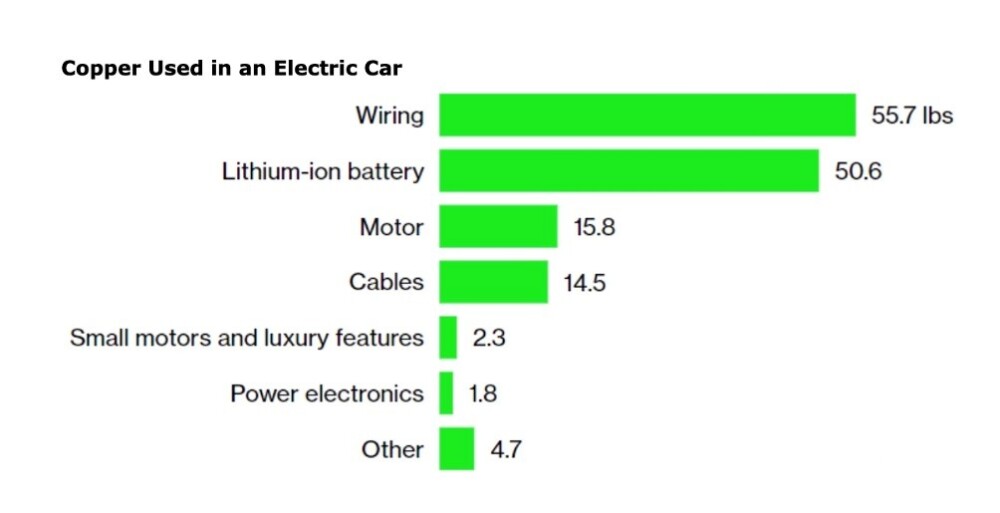

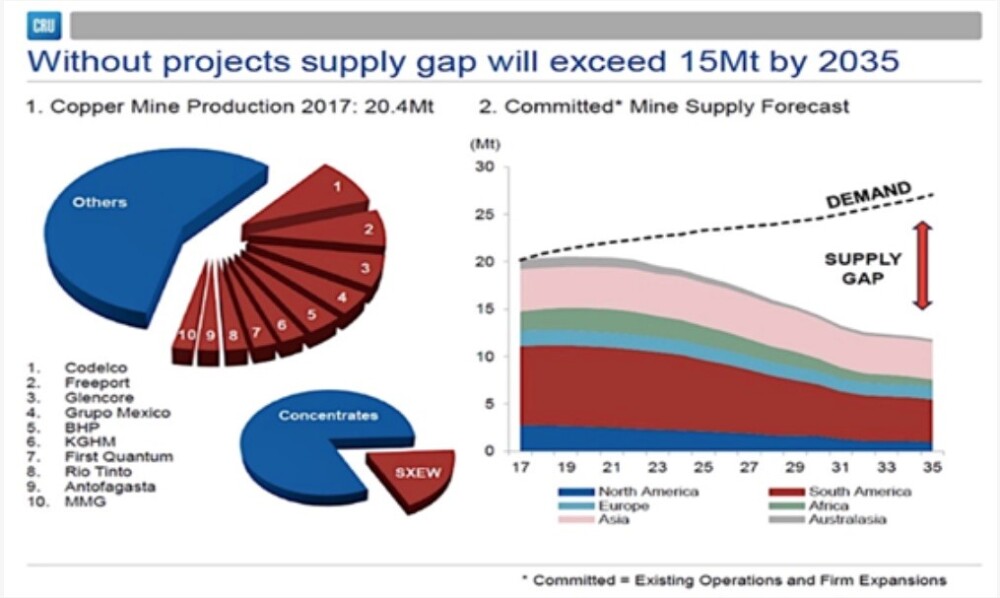
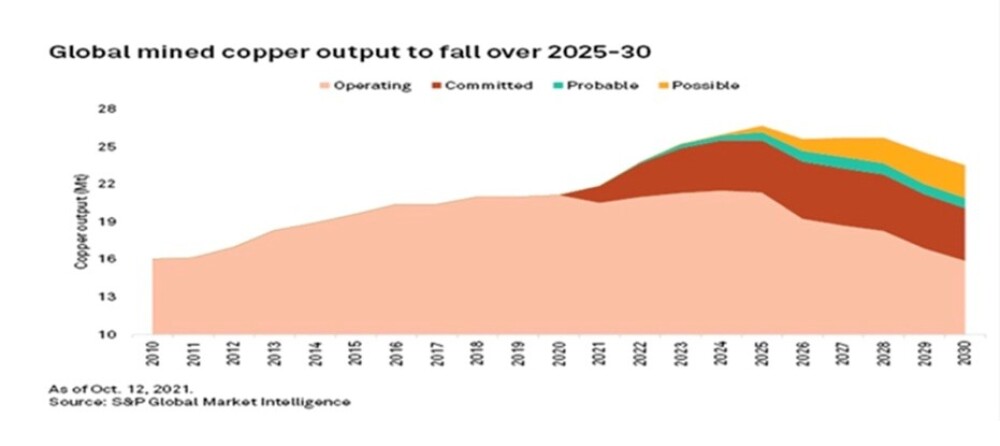
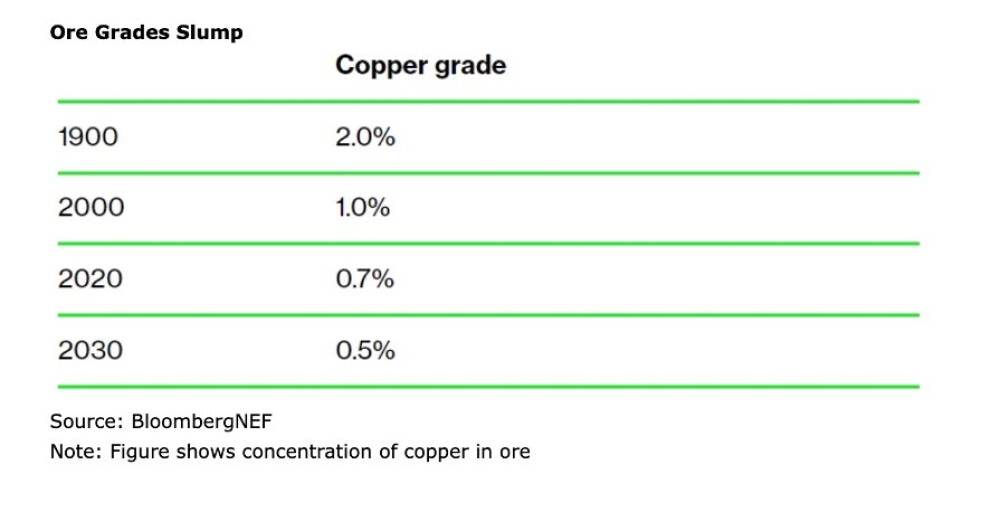
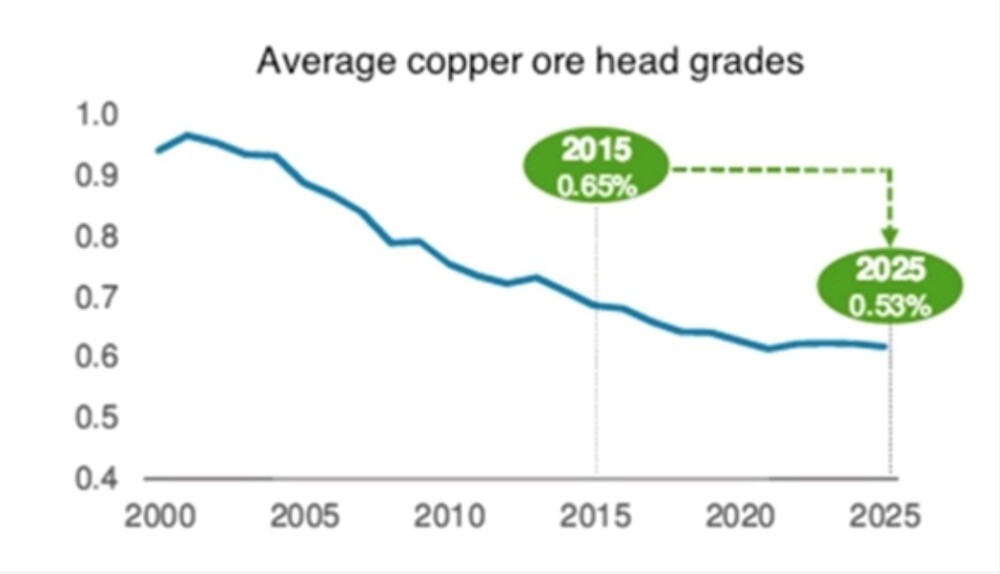
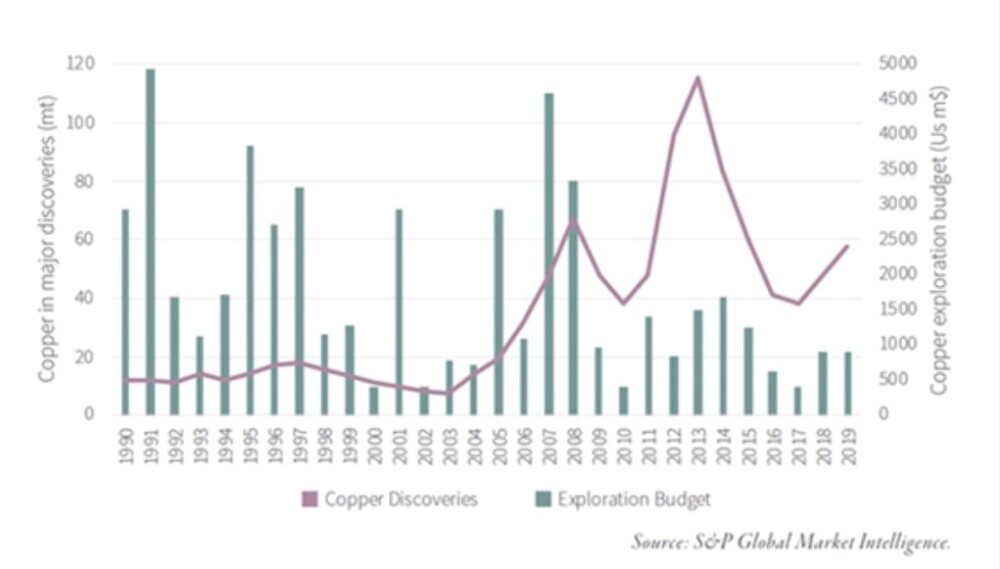

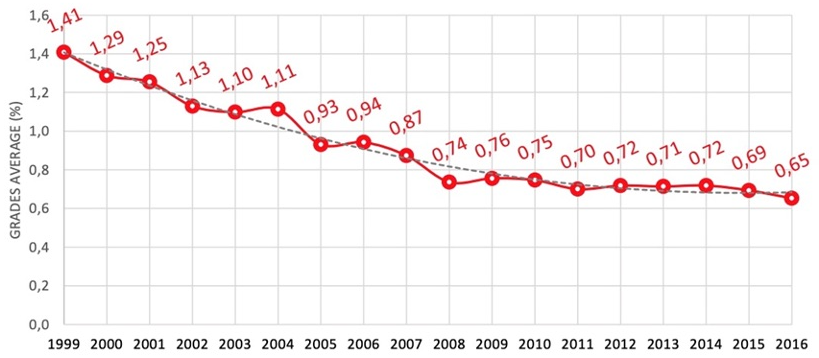
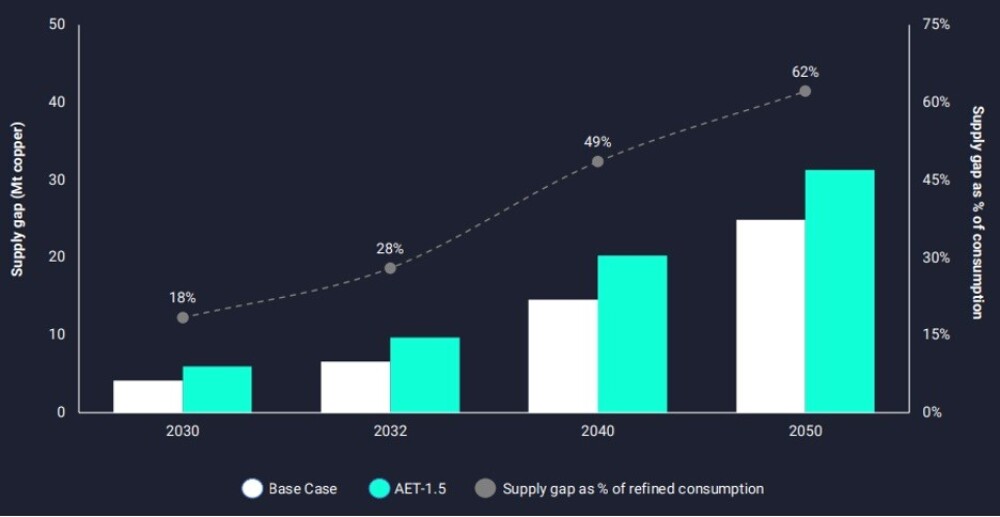
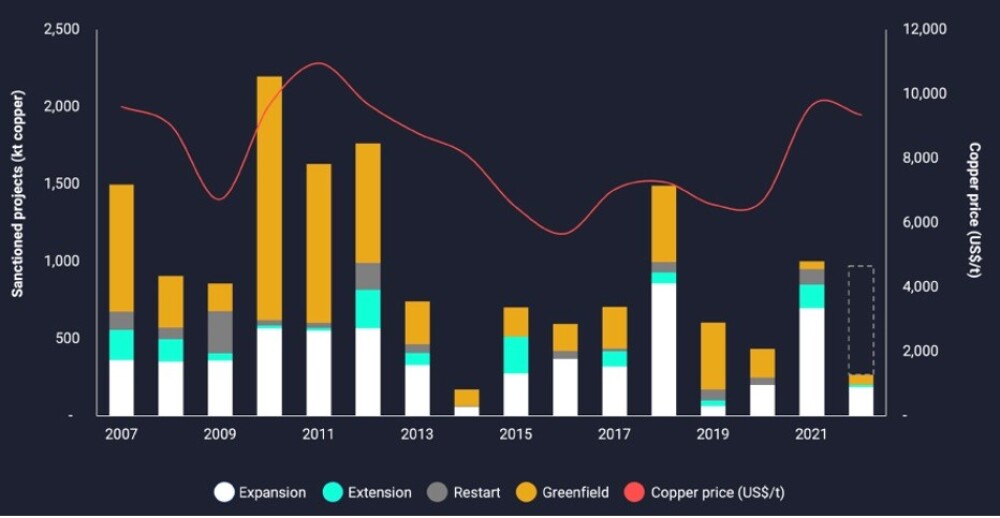
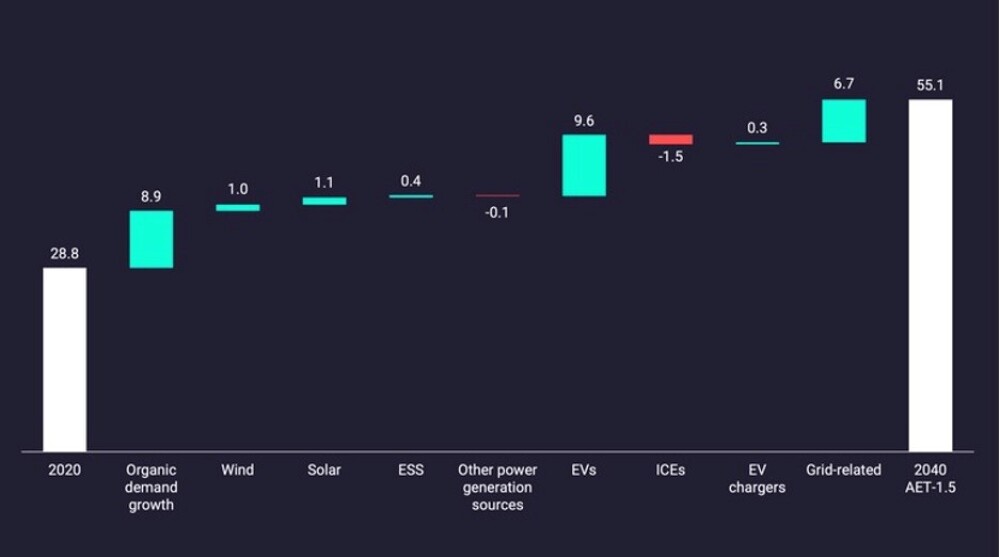
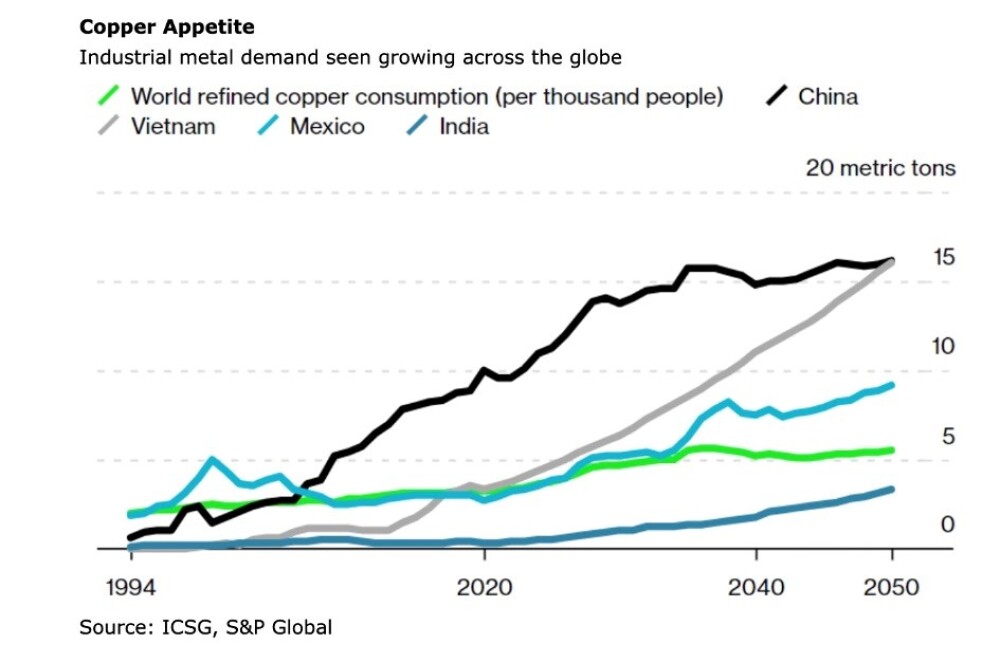
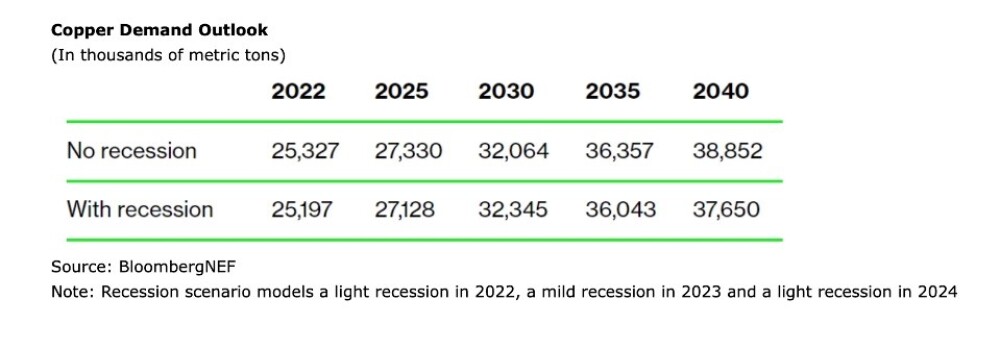
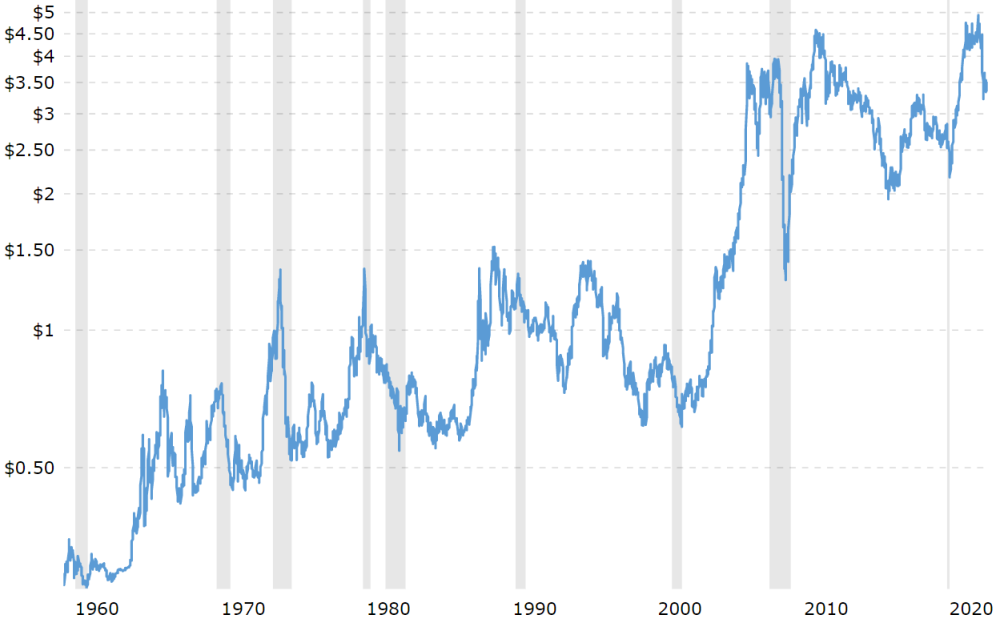

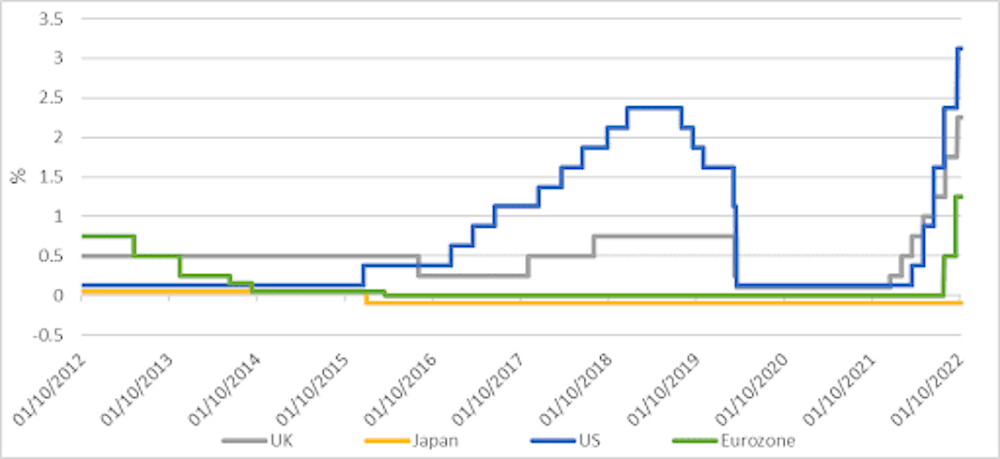
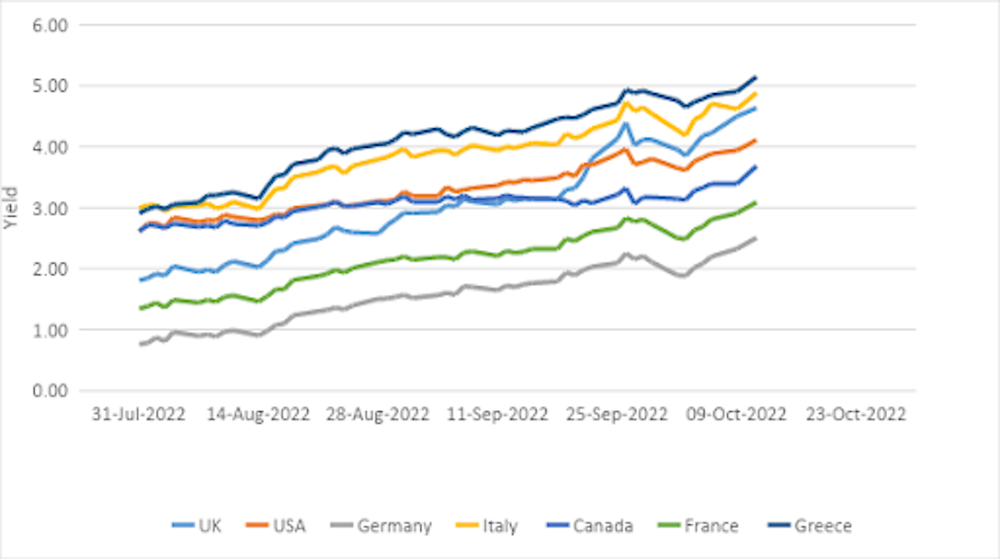

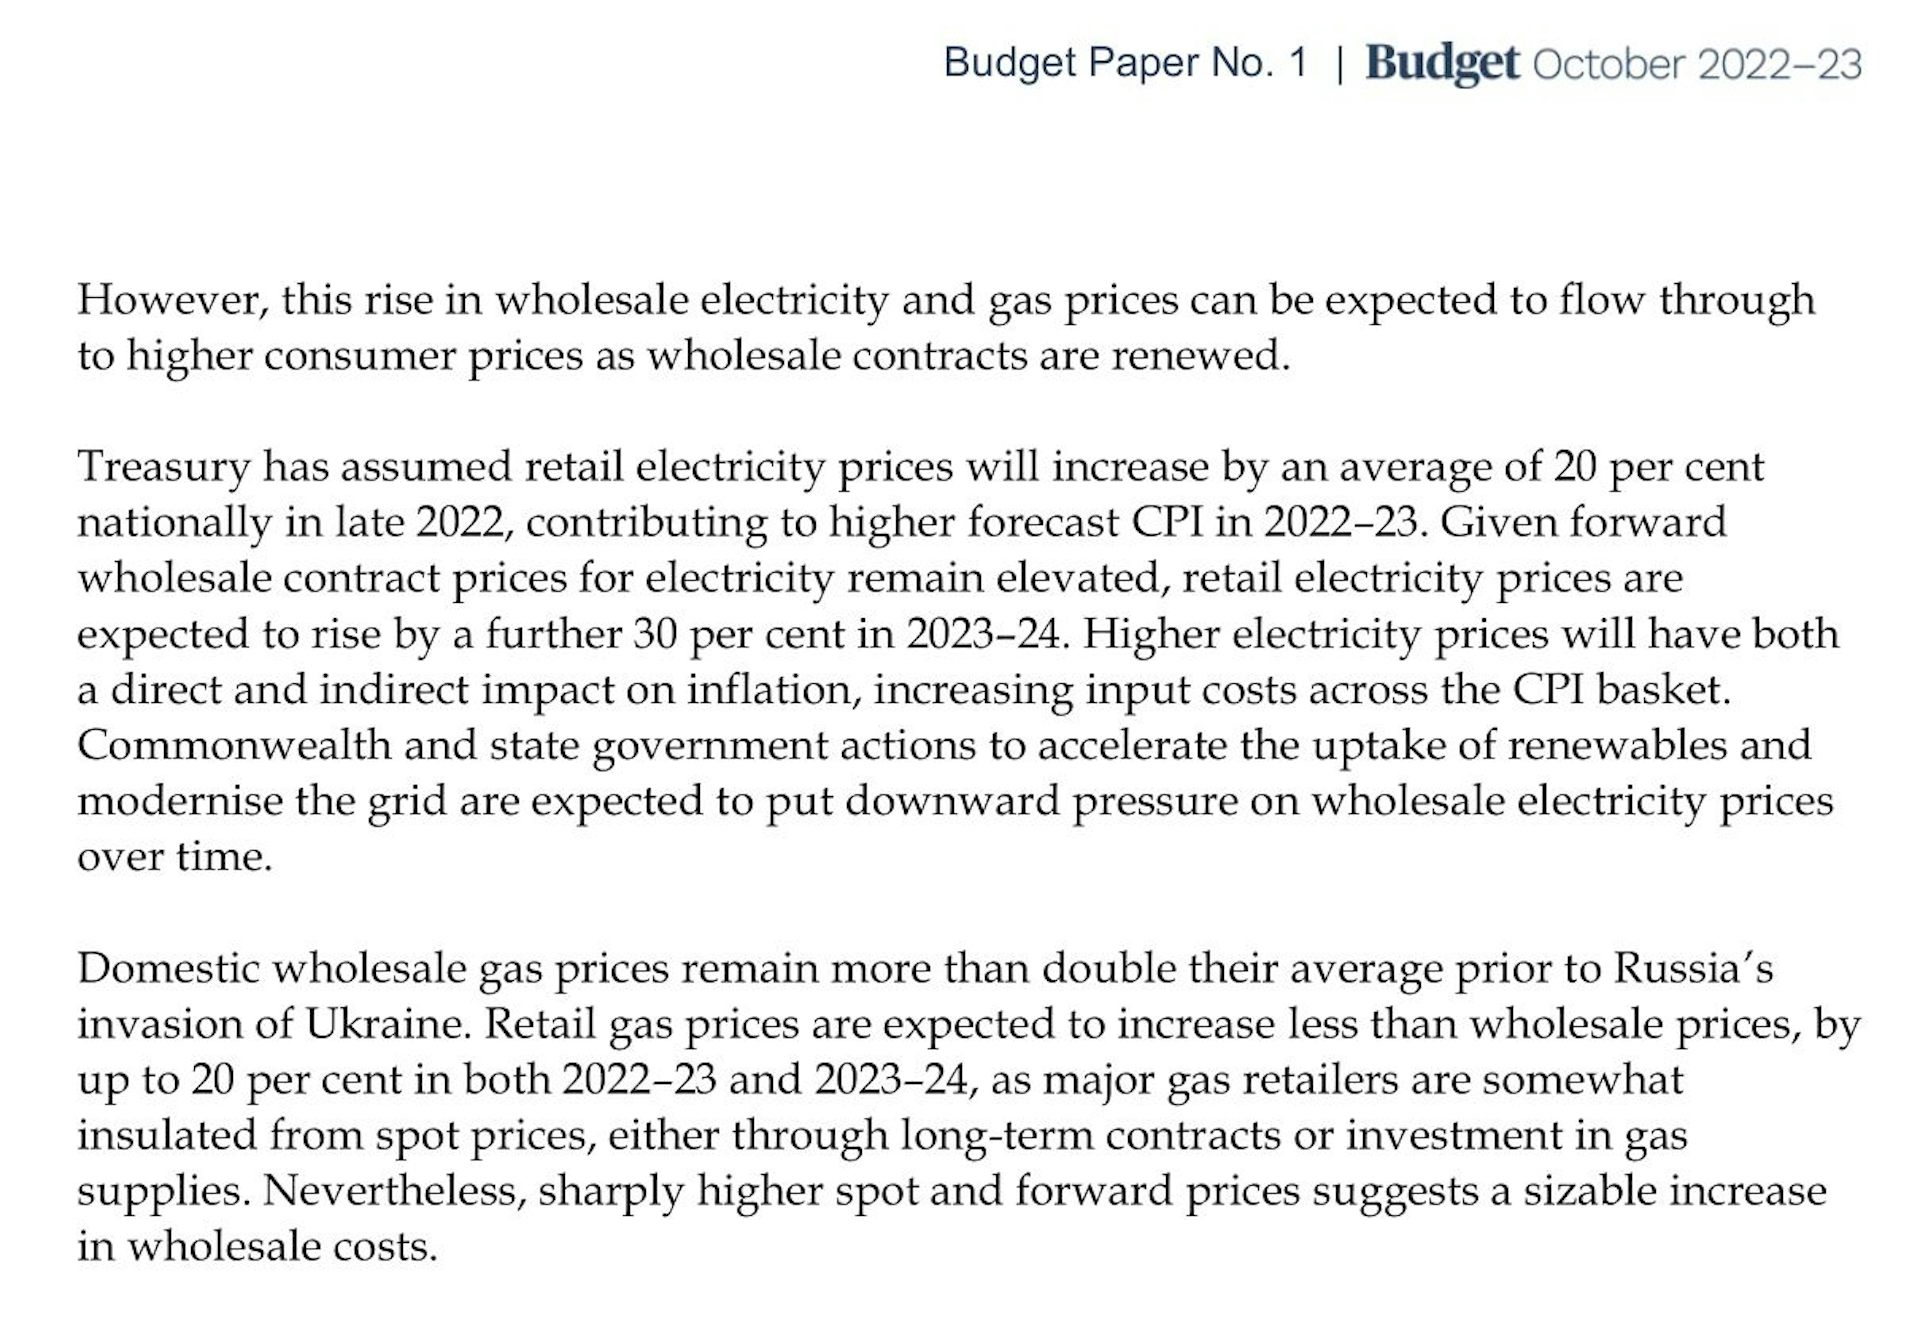