By InvestMacro

Here are the latest charts and statistics for the Commitment of Traders (COT) data published by the Commodities Futures Trading Commission (CFTC).
The latest COT data is updated through Tuesday November 1st and shows a quick view of how large market participants (for-profit speculators and commercial traders) were positioned in the futures markets. All currency positions are in direct relation to the US dollar where, for example, a bet for the euro is a bet that the euro will rise versus the dollar while a bet against the euro will be a bet that the euro will decline versus the dollar.
Weekly Speculator Changes led by Peso & Euro bets
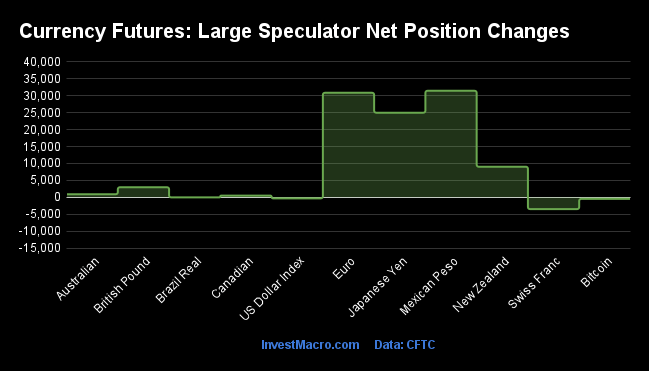
The COT currency market speculator bets were overall higher this week as seven out of the eleven currency markets we cover had higher positioning while the other four markets had lower speculator contracts.
Leading the gains for the currency markets were the Mexican peso (31,471 contracts), the Euro (30,881 contracts) and the Japanese yen (24,998 contracts) with the New Zealand dollar (9,037 contracts), the British pound sterling (2,969 contracts), the Australian dollar (914 contracts) and the Canadian dollar (506 contracts) also showing positive weeks.
The currencies leading the declines in speculator bets this week was the Swiss franc (-3,484 contracts) with Bitcoin (-475 contracts), the US Dollar Index (-310 contracts) and the Brazilian real (-22 contracts) also registering lower bets on the week.
Highlighting the COT currency data this week is the strong gains in the Mexican peso positioning since the start of October. Peso speculative positions jumped by over +30,000 contracts for a second straight week this week and have now been higher by at least +10,000 contracts in each of the past three weeks. Overall, the peso position has gained for five consecutive weeks and by a total of +85,367 contracts over that five-week period.
The renewed speculator optimism has brought the peso positioning from out of the bearish level it was in for nineteen straight weeks (from June 14th to October 18th) into a new bullish standing and to most bullish level since March 8th. The peso’s futures price has also been on the rise with a gain by over 1.50 percent this week. Peso prices have now risen in five out of the past six weeks and have reached their best level since early June.
Another highlight of this week’s COT data is the Euro’s continued gains in speculator positions. The large speculator contracts rose strongly yet again this week as the Euro position has now climbed for a third straight week and for the eighth time in the past nine weeks. The nine-week speculator’s total increase now stands at a whopping +153,466 contracts. The Euro position was in bearish territory as recently as September 13th (total of -11,837 contracts) and now the total speculator position is at +105,790 contracts (a 72-week high). However, despite this strong speculator sentiment, the Euro exchange rate versus the US dollar continues to only trade around parity or the 1.000 level. The speculators are usually reliable trend-followers (buying when prices rises and selling when prices fall) and this divergence between the price and speculator contracts is growing quite large and could foretell a possible strong future movement in the Euro one way or the other.
| Nov-01-2022 | OI | OI-Index | Spec-Net | Spec-Index | Com-Net | COM-Index | Smalls-Net | Smalls-Index |
|---|
| USD Index | 55,942 | 80 | 29,788 | 75 | -33,331 | 23 | 3,543 | 55 |
| EUR | 671,729 | 65 | 105,790 | 67 | -128,819 | 39 | 23,029 | 16 |
| GBP | 243,549 | 63 | -44,836 | 31 | 65,377 | 78 | -20,541 | 18 |
| JPY | 258,906 | 86 | -77,620 | 21 | 95,774 | 82 | -18,154 | 17 |
| CHF | 50,107 | 41 | -14,784 | 19 | 27,731 | 88 | -12,947 | 14 |
| CAD | 147,170 | 28 | -17,649 | 21 | 19,275 | 85 | -1,626 | 27 |
| AUD | 165,411 | 56 | -50,532 | 38 | 62,726 | 66 | -12,194 | 23 |
| NZD | 47,219 | 38 | -3,847 | 61 | 6,881 | 45 | -3,034 | 17 |
| MXN | 282,864 | 88 | 44,045 | 46 | -50,512 | 52 | 6,467 | 70 |
| RUB | 20,930 | 4 | 7,543 | 31 | -7,150 | 69 | -393 | 24 |
| BRL | 58,289 | 51 | 29,157 | 79 | -29,139 | 23 | -18 | 65 |
| Bitcoin | 12,183 | 67 | -452 | 69 | -16 | 0 | 468 | 24 |
Brazilian Real & US Dollar Index lead Strength Scores
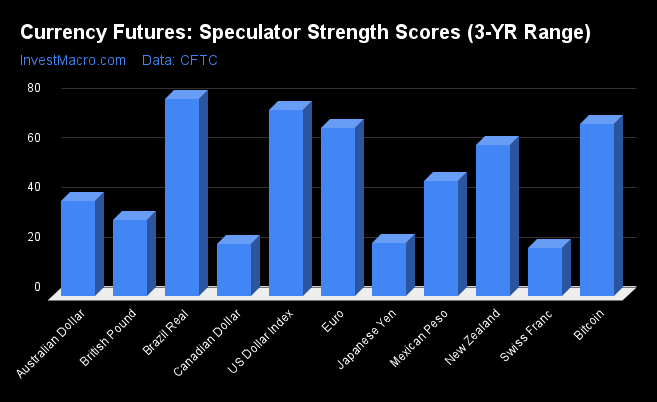
Strength Scores (a normalized measure of Speculator positions over a 3-Year range, from 0 to 100 where above 80 is extreme bullish and below 20 is extreme bearish) showed that the Brazilian Real (79.0 percent) and the US Dollar Index (74.6 percent) lead the currency markets currently. Bitcoin (69.1 percent) and the EuroFX (67.5 percent) come in as the next highest in the currency markets in strength scores.
On the downside, the Swiss Franc (19.0 percent) comes in at the lowest strength level currently and is in a bearish extreme position under 20 percent. The Canadian Dollar (20.8 percent), the Japanese Yen (21.1 percent) and the British Pound Sterling (30.5 percent) come in as the next lowest scores.
Strength Statistics:
US Dollar Index (74.6 percent) vs US Dollar Index previous week (75.1 percent)
EuroFX (67.5 percent) vs EuroFX previous week (58.0 percent)
British Pound Sterling (30.5 percent) vs British Pound Sterling previous week (28.0 percent)
Japanese Yen (21.1 percent) vs Japanese Yen previous week (5.7 percent)
Swiss Franc (19.0 percent) vs Swiss Franc previous week (27.8 percent)
Canadian Dollar (20.8 percent) vs Canadian Dollar previous week (20.2 percent)
Australian Dollar (38.0 percent) vs Australian Dollar previous week (37.1 percent)
New Zealand Dollar (60.7 percent) vs New Zealand Dollar previous week (43.8 percent)
Mexican Peso (46.1 percent) vs Mexican Peso previous week (32.7 percent)
Brazilian Real (79.0 percent) vs Brazilian Real previous week (79.1 percent)
Bitcoin (69.1 percent) vs Bitcoin previous week (77.3 percent)
Peso & Euro top the Strength Trends
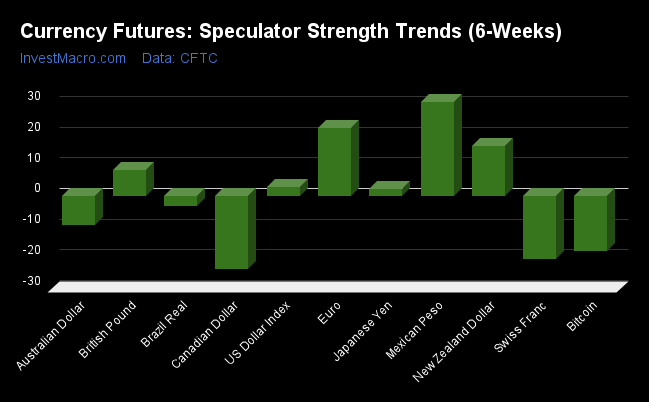
Strength Score Trends (or move index, calculates the 6-week changes in strength scores) showed that the Mexican Peso (30.7 percent) and the EuroFX (22.2 percent) lead the past six weeks trends for the currency markets this week. The New Zealand Dollar (16.4 percent) and the British Pound Sterling (8.6 percent) fill out the next top movers in the latest trends data.
The Canadian Dollar (-23.5 percent) leads the downside trend scores currently while the next markets with lower trend scores were the Swiss Franc (-20.4 percent) followed by Bitcoin (-17.9 percent).
Strength Trend Statistics:
US Dollar Index (3.1 percent) vs US Dollar Index previous week (-9.3 percent)
EuroFX (22.2 percent) vs EuroFX previous week (26.6 percent)
British Pound Sterling (8.6 percent) vs British Pound Sterling previous week (17.4 percent)
Japanese Yen (2.3 percent) vs Japanese Yen previous week (-13.5 percent)
Swiss Franc (-20.4 percent) vs Swiss Franc previous week (-10.1 percent)
Canadian Dollar (-23.5 percent) vs Canadian Dollar previous week (-36.5 percent)
Australian Dollar (-9.3 percent) vs Australian Dollar previous week (5.9 percent)
New Zealand Dollar (16.4 percent) vs New Zealand Dollar previous week (-14.2 percent)
Mexican Peso (30.7 percent) vs Mexican Peso previous week (16.2 percent)
Brazilian Real (-3.2 percent) vs Brazilian Real previous week (-3.7 percent)
Bitcoin (-17.9 percent) vs Bitcoin previous week (-1.8 percent)
Individual COT Forex Markets:
US Dollar Index Futures:
 The US Dollar Index large speculator standing this week came in at a net position of 29,788 contracts in the data reported through Tuesday. This was a weekly reduction of -310 contracts from the previous week which had a total of 30,098 net contracts.
This week’s current strength score (the trader positioning range over the past three years, measured from 0 to 100) shows the speculators are currently Bullish with a score of 74.6 percent. The commercials are Bearish with a score of 22.9 percent and the small traders (not shown in chart) are Bullish with a score of 55.3 percent.
| US DOLLAR INDEX Statistics | SPECULATORS | COMMERCIALS | SMALL TRADERS |
| – Percent of Open Interest Longs: | 75.6 | 10.3 | 11.5 |
| – Percent of Open Interest Shorts: | 22.4 | 69.9 | 5.2 |
| – Net Position: | 29,788 | -33,331 | 3,543 |
| – Gross Longs: | 42,304 | 5,761 | 6,460 |
| – Gross Shorts: | 12,516 | 39,092 | 2,917 |
| – Long to Short Ratio: | 3.4 to 1 | 0.1 to 1 | 2.2 to 1 |
| NET POSITION TREND: | | | |
| – Strength Index Score (3 Year Range Pct): | 74.6 | 22.9 | 55.3 |
| – Strength Index Reading (3 Year Range): | Bullish | Bearish | Bullish |
| NET POSITION MOVEMENT INDEX: | | | |
| – 6-Week Change in Strength Index: | 3.1 | -4.1 | 7.6 |
Euro Currency Futures:
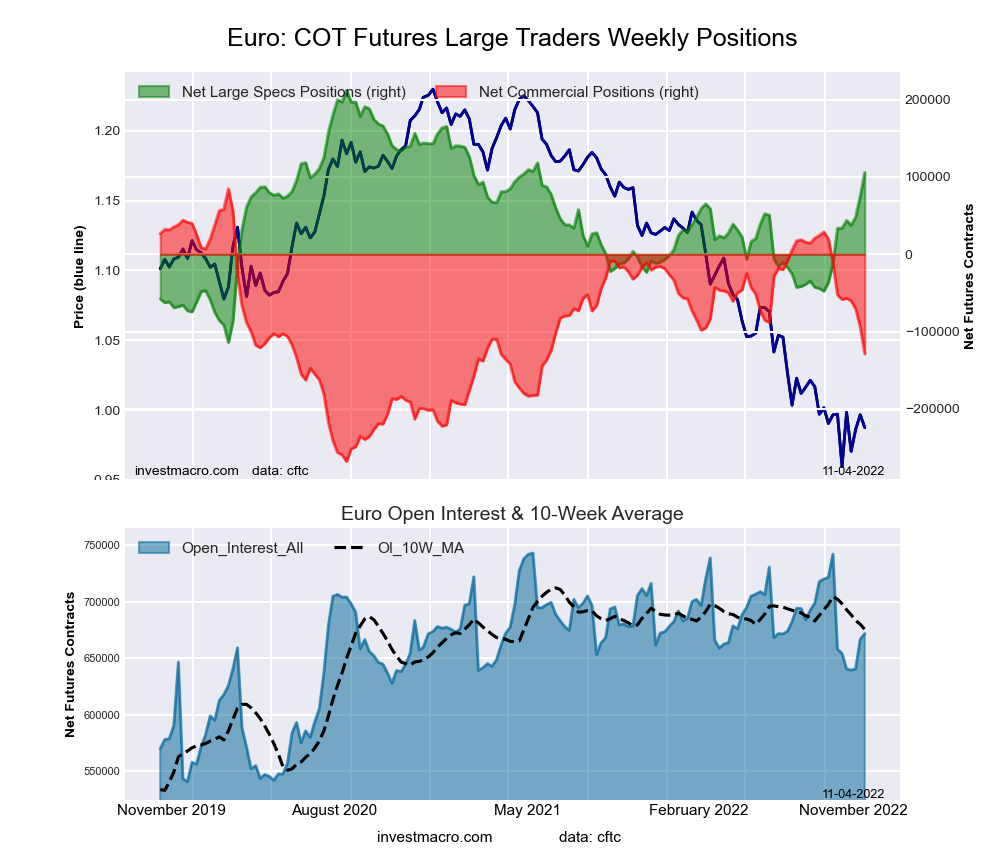 The Euro Currency large speculator standing this week came in at a net position of 105,790 contracts in the data reported through Tuesday. This was a weekly advance of 30,881 contracts from the previous week which had a total of 74,909 net contracts.
This week’s current strength score (the trader positioning range over the past three years, measured from 0 to 100) shows the speculators are currently Bullish with a score of 67.5 percent. The commercials are Bearish with a score of 39.5 percent and the small traders (not shown in chart) are Bearish-Extreme with a score of 15.7 percent.
| EURO Currency Statistics | SPECULATORS | COMMERCIALS | SMALL TRADERS |
| – Percent of Open Interest Longs: | 35.7 | 50.5 | 11.5 |
| – Percent of Open Interest Shorts: | 19.9 | 69.7 | 8.0 |
| – Net Position: | 105,790 | -128,819 | 23,029 |
| – Gross Longs: | 239,770 | 339,364 | 77,062 |
| – Gross Shorts: | 133,980 | 468,183 | 54,033 |
| – Long to Short Ratio: | 1.8 to 1 | 0.7 to 1 | 1.4 to 1 |
| NET POSITION TREND: | | | |
| – Strength Index Score (3 Year Range Pct): | 67.5 | 39.5 | 15.7 |
| – Strength Index Reading (3 Year Range): | Bullish | Bearish | Bearish-Extreme |
| NET POSITION MOVEMENT INDEX: | | | |
| – 6-Week Change in Strength Index: | 22.2 | -21.7 | 6.6 |
British Pound Sterling Futures:
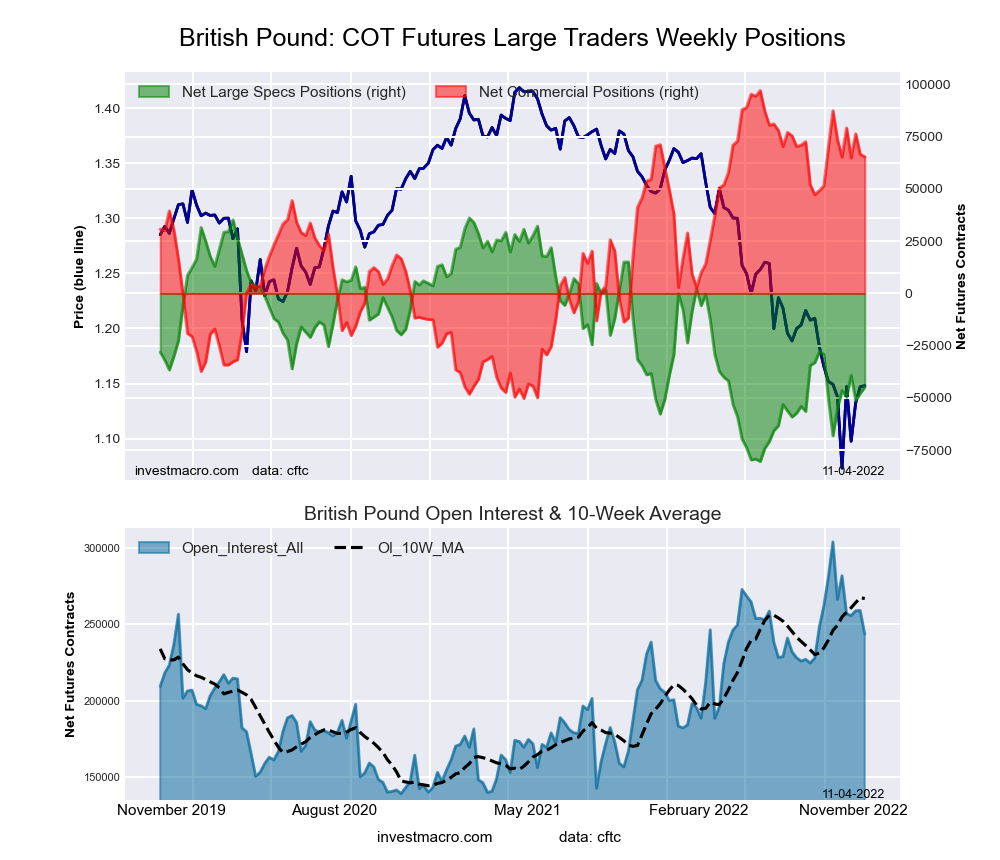 The British Pound Sterling large speculator standing this week came in at a net position of -44,836 contracts in the data reported through Tuesday. This was a weekly rise of 2,969 contracts from the previous week which had a total of -47,805 net contracts.
This week’s current strength score (the trader positioning range over the past three years, measured from 0 to 100) shows the speculators are currently Bearish with a score of 30.5 percent. The commercials are Bullish with a score of 78.5 percent and the small traders (not shown in chart) are Bearish-Extreme with a score of 17.7 percent.
| BRITISH POUND Statistics | SPECULATORS | COMMERCIALS | SMALL TRADERS |
| – Percent of Open Interest Longs: | 14.4 | 75.2 | 8.0 |
| – Percent of Open Interest Shorts: | 32.8 | 48.4 | 16.4 |
| – Net Position: | -44,836 | 65,377 | -20,541 |
| – Gross Longs: | 34,979 | 183,210 | 19,464 |
| – Gross Shorts: | 79,815 | 117,833 | 40,005 |
| – Long to Short Ratio: | 0.4 to 1 | 1.6 to 1 | 0.5 to 1 |
| NET POSITION TREND: | | | |
| – Strength Index Score (3 Year Range Pct): | 30.5 | 78.5 | 17.7 |
| – Strength Index Reading (3 Year Range): | Bearish | Bullish | Bearish-Extreme |
| NET POSITION MOVEMENT INDEX: | | | |
| – 6-Week Change in Strength Index: | 8.6 | -5.5 | -3.7 |
Japanese Yen Futures:
 The Japanese Yen large speculator standing this week came in at a net position of -77,620 contracts in the data reported through Tuesday. This was a weekly advance of 24,998 contracts from the previous week which had a total of -102,618 net contracts.
This week’s current strength score (the trader positioning range over the past three years, measured from 0 to 100) shows the speculators are currently Bearish with a score of 21.1 percent. The commercials are Bullish-Extreme with a score of 82.4 percent and the small traders (not shown in chart) are Bearish-Extreme with a score of 16.6 percent.
| JAPANESE YEN Statistics | SPECULATORS | COMMERCIALS | SMALL TRADERS |
| – Percent of Open Interest Longs: | 15.6 | 73.9 | 8.9 |
| – Percent of Open Interest Shorts: | 45.6 | 36.9 | 15.9 |
| – Net Position: | -77,620 | 95,774 | -18,154 |
| – Gross Longs: | 40,460 | 191,221 | 23,021 |
| – Gross Shorts: | 118,080 | 95,447 | 41,175 |
| – Long to Short Ratio: | 0.3 to 1 | 2.0 to 1 | 0.6 to 1 |
| NET POSITION TREND: | | | |
| – Strength Index Score (3 Year Range Pct): | 21.1 | 82.4 | 16.6 |
| – Strength Index Reading (3 Year Range): | Bearish | Bullish-Extreme | Bearish-Extreme |
| NET POSITION MOVEMENT INDEX: | | | |
| – 6-Week Change in Strength Index: | 2.3 | -0.8 | -3.9 |
Swiss Franc Futures:
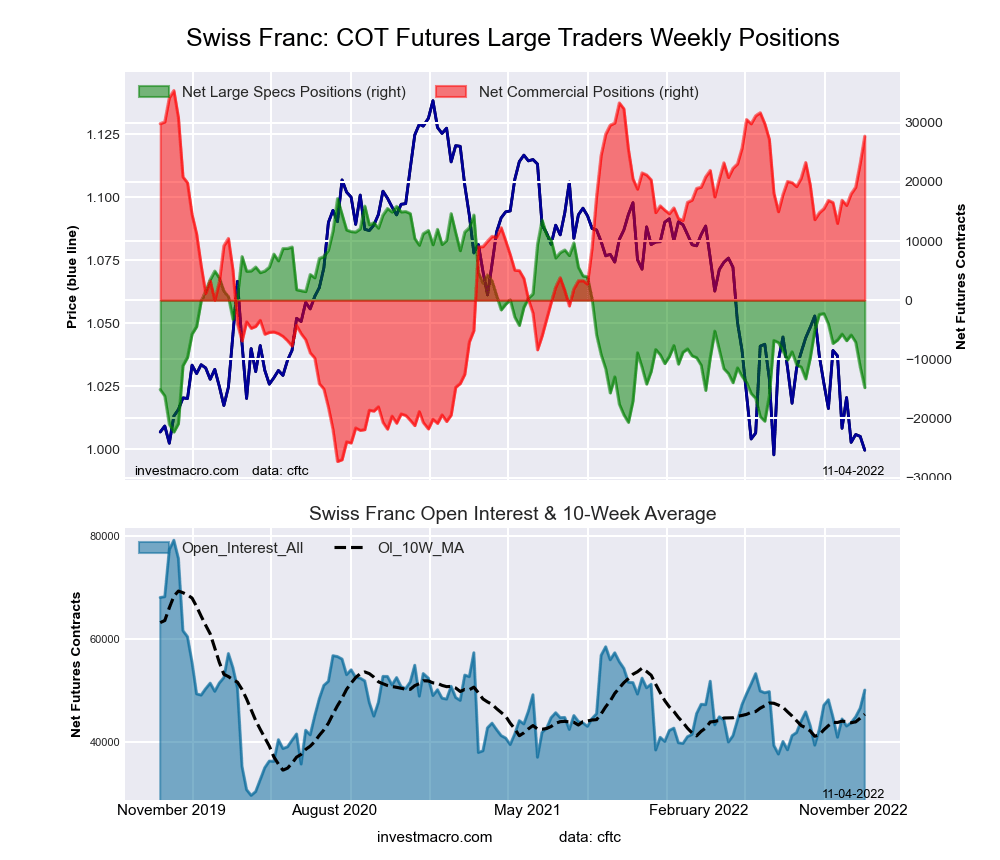 The Swiss Franc large speculator standing this week came in at a net position of -14,784 contracts in the data reported through Tuesday. This was a weekly decrease of -3,484 contracts from the previous week which had a total of -11,300 net contracts.
This week’s current strength score (the trader positioning range over the past three years, measured from 0 to 100) shows the speculators are currently Bearish-Extreme with a score of 19.0 percent. The commercials are Bullish-Extreme with a score of 87.7 percent and the small traders (not shown in chart) are Bearish-Extreme with a score of 13.7 percent.
| SWISS FRANC Statistics | SPECULATORS | COMMERCIALS | SMALL TRADERS |
| – Percent of Open Interest Longs: | 13.2 | 71.5 | 15.1 |
| – Percent of Open Interest Shorts: | 42.7 | 16.1 | 40.9 |
| – Net Position: | -14,784 | 27,731 | -12,947 |
| – Gross Longs: | 6,612 | 35,822 | 7,559 |
| – Gross Shorts: | 21,396 | 8,091 | 20,506 |
| – Long to Short Ratio: | 0.3 to 1 | 4.4 to 1 | 0.4 to 1 |
| NET POSITION TREND: | | | |
| – Strength Index Score (3 Year Range Pct): | 19.0 | 87.7 | 13.7 |
| – Strength Index Reading (3 Year Range): | Bearish-Extreme | Bullish-Extreme | Bearish-Extreme |
| NET POSITION MOVEMENT INDEX: | | | |
| – 6-Week Change in Strength Index: | -20.4 | 23.5 | -22.7 |
Canadian Dollar Futures:
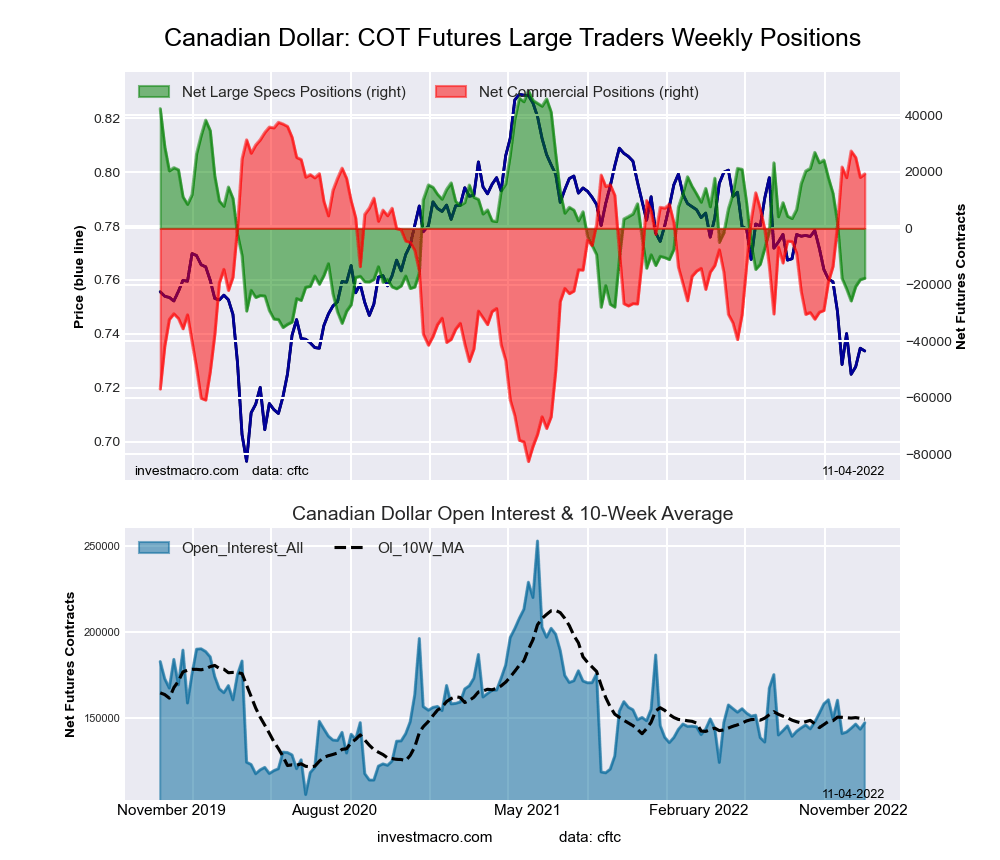 The Canadian Dollar large speculator standing this week came in at a net position of -17,649 contracts in the data reported through Tuesday. This was a weekly boost of 506 contracts from the previous week which had a total of -18,155 net contracts.
This week’s current strength score (the trader positioning range over the past three years, measured from 0 to 100) shows the speculators are currently Bearish with a score of 20.8 percent. The commercials are Bullish-Extreme with a score of 84.8 percent and the small traders (not shown in chart) are Bearish with a score of 26.8 percent.
| CANADIAN DOLLAR Statistics | SPECULATORS | COMMERCIALS | SMALL TRADERS |
| – Percent of Open Interest Longs: | 26.2 | 50.5 | 21.2 |
| – Percent of Open Interest Shorts: | 38.2 | 37.4 | 22.3 |
| – Net Position: | -17,649 | 19,275 | -1,626 |
| – Gross Longs: | 38,522 | 74,352 | 31,212 |
| – Gross Shorts: | 56,171 | 55,077 | 32,838 |
| – Long to Short Ratio: | 0.7 to 1 | 1.3 to 1 | 1.0 to 1 |
| NET POSITION TREND: | | | |
| – Strength Index Score (3 Year Range Pct): | 20.8 | 84.8 | 26.8 |
| – Strength Index Reading (3 Year Range): | Bearish | Bullish-Extreme | Bearish |
| NET POSITION MOVEMENT INDEX: | | | |
| – 6-Week Change in Strength Index: | -23.5 | 15.3 | 2.7 |
Australian Dollar Futures:
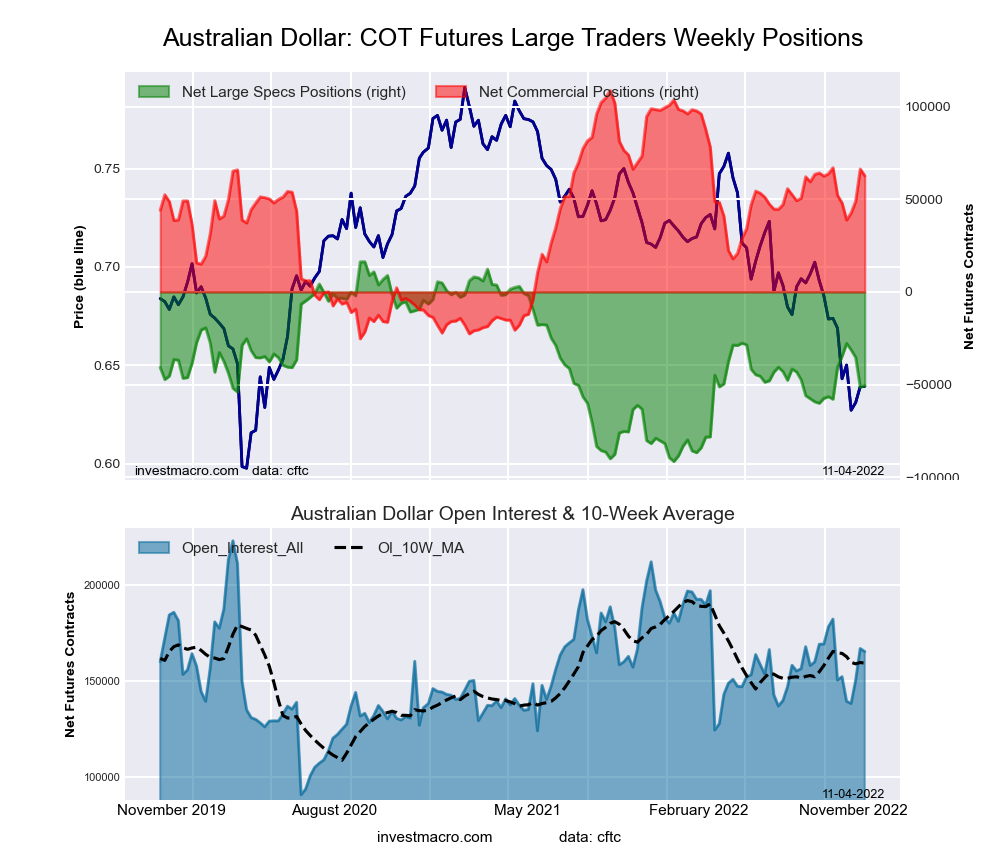 The Australian Dollar large speculator standing this week came in at a net position of -50,532 contracts in the data reported through Tuesday. This was a weekly lift of 914 contracts from the previous week which had a total of -51,446 net contracts.
This week’s current strength score (the trader positioning range over the past three years, measured from 0 to 100) shows the speculators are currently Bearish with a score of 38.0 percent. The commercials are Bullish with a score of 65.7 percent and the small traders (not shown in chart) are Bearish with a score of 22.7 percent.
| AUSTRALIAN DOLLAR Statistics | SPECULATORS | COMMERCIALS | SMALL TRADERS |
| – Percent of Open Interest Longs: | 20.6 | 67.5 | 9.3 |
| – Percent of Open Interest Shorts: | 51.2 | 29.6 | 16.6 |
| – Net Position: | -50,532 | 62,726 | -12,194 |
| – Gross Longs: | 34,148 | 111,638 | 15,301 |
| – Gross Shorts: | 84,680 | 48,912 | 27,495 |
| – Long to Short Ratio: | 0.4 to 1 | 2.3 to 1 | 0.6 to 1 |
| NET POSITION TREND: | | | |
| – Strength Index Score (3 Year Range Pct): | 38.0 | 65.7 | 22.7 |
| – Strength Index Reading (3 Year Range): | Bearish | Bullish | Bearish |
| NET POSITION MOVEMENT INDEX: | | | |
| – 6-Week Change in Strength Index: | -9.3 | 7.9 | -1.5 |
New Zealand Dollar Futures:
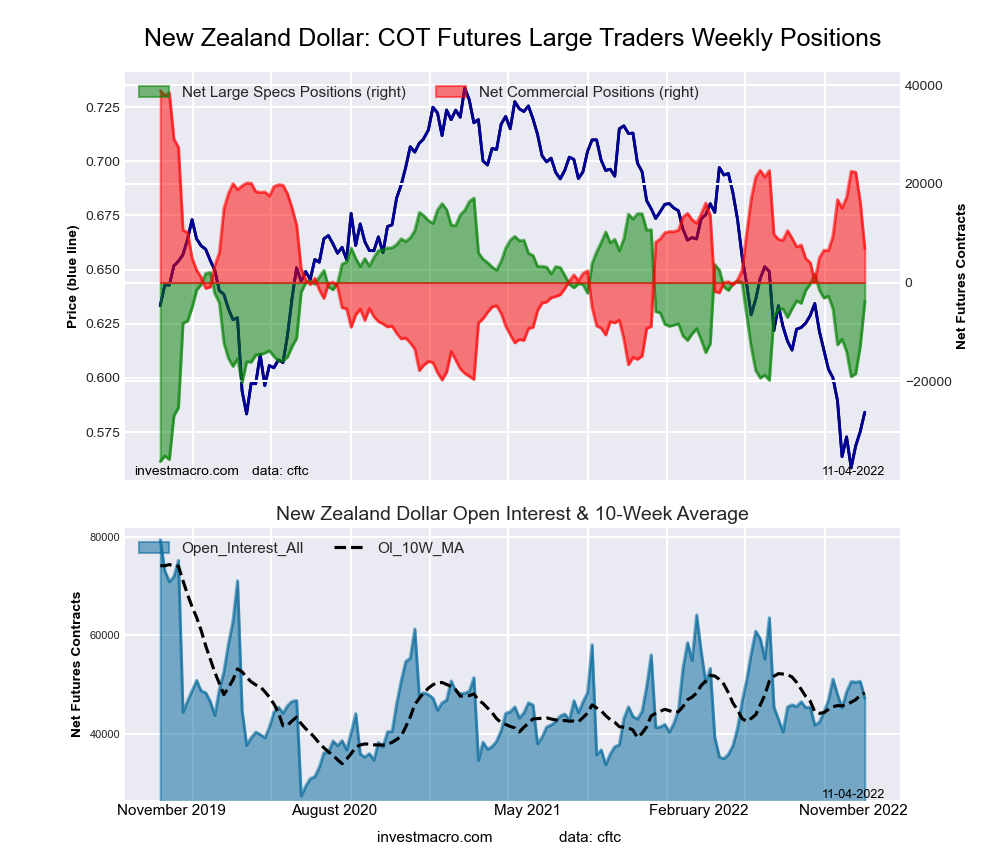 The New Zealand Dollar large speculator standing this week came in at a net position of -3,847 contracts in the data reported through Tuesday. This was a weekly increase of 9,037 contracts from the previous week which had a total of -12,884 net contracts.
This week’s current strength score (the trader positioning range over the past three years, measured from 0 to 100) shows the speculators are currently Bullish with a score of 60.7 percent. The commercials are Bearish with a score of 45.4 percent and the small traders (not shown in chart) are Bearish-Extreme with a score of 16.8 percent.
| NEW ZEALAND DOLLAR Statistics | SPECULATORS | COMMERCIALS | SMALL TRADERS |
| – Percent of Open Interest Longs: | 44.7 | 48.9 | 5.7 |
| – Percent of Open Interest Shorts: | 52.9 | 34.4 | 12.2 |
| – Net Position: | -3,847 | 6,881 | -3,034 |
| – Gross Longs: | 21,115 | 23,103 | 2,707 |
| – Gross Shorts: | 24,962 | 16,222 | 5,741 |
| – Long to Short Ratio: | 0.8 to 1 | 1.4 to 1 | 0.5 to 1 |
| NET POSITION TREND: | | | |
| – Strength Index Score (3 Year Range Pct): | 60.7 | 45.4 | 16.8 |
| – Strength Index Reading (3 Year Range): | Bullish | Bearish | Bearish-Extreme |
| NET POSITION MOVEMENT INDEX: | | | |
| – 6-Week Change in Strength Index: | 16.4 | -16.9 | 13.4 |
Mexican Peso Futures:
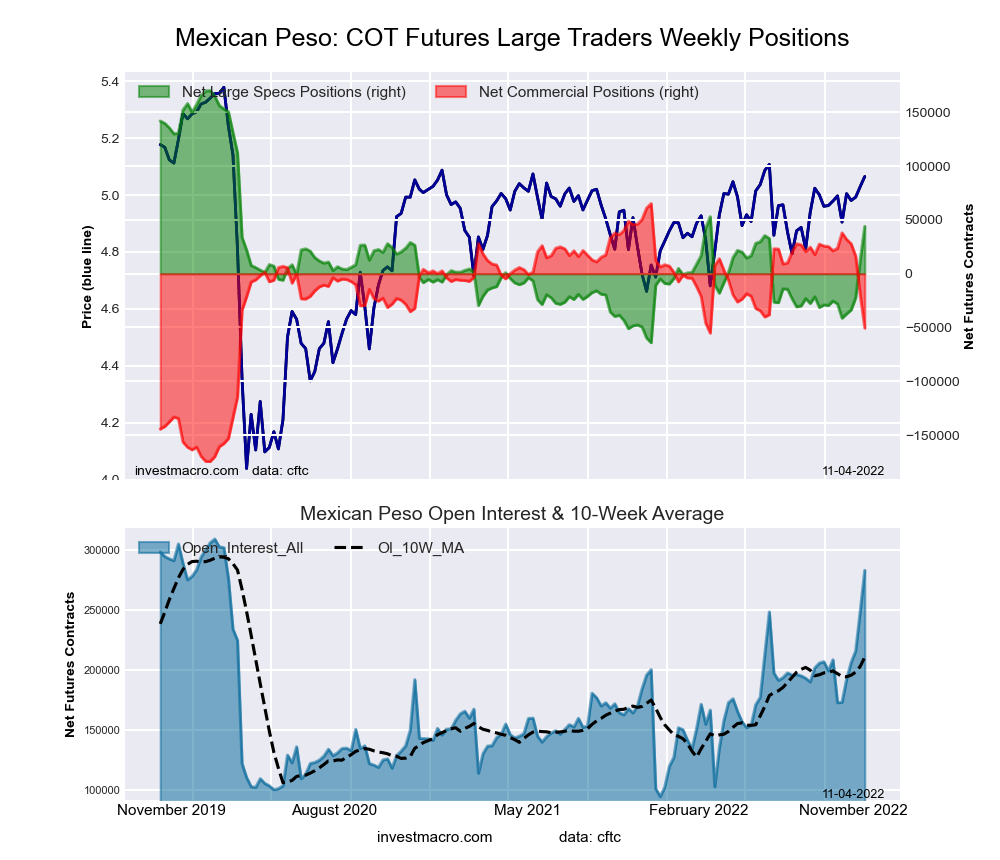 The Mexican Peso large speculator standing this week came in at a net position of 44,045 contracts in the data reported through Tuesday. This was a weekly boost of 31,471 contracts from the previous week which had a total of 12,574 net contracts.
This week’s current strength score (the trader positioning range over the past three years, measured from 0 to 100) shows the speculators are currently Bearish with a score of 46.1 percent. The commercials are Bullish with a score of 51.7 percent and the small traders (not shown in chart) are Bullish with a score of 70.4 percent.
| MEXICAN PESO Statistics | SPECULATORS | COMMERCIALS | SMALL TRADERS |
| – Percent of Open Interest Longs: | 64.5 | 32.1 | 3.0 |
| – Percent of Open Interest Shorts: | 48.9 | 50.0 | 0.7 |
| – Net Position: | 44,045 | -50,512 | 6,467 |
| – Gross Longs: | 182,316 | 90,811 | 8,464 |
| – Gross Shorts: | 138,271 | 141,323 | 1,997 |
| – Long to Short Ratio: | 1.3 to 1 | 0.6 to 1 | 4.2 to 1 |
| NET POSITION TREND: | | | |
| – Strength Index Score (3 Year Range Pct): | 46.1 | 51.7 | 70.4 |
| – Strength Index Reading (3 Year Range): | Bearish | Bullish | Bullish |
| NET POSITION MOVEMENT INDEX: | | | |
| – 6-Week Change in Strength Index: | 30.7 | -31.0 | 9.2 |
Brazilian Real Futures:
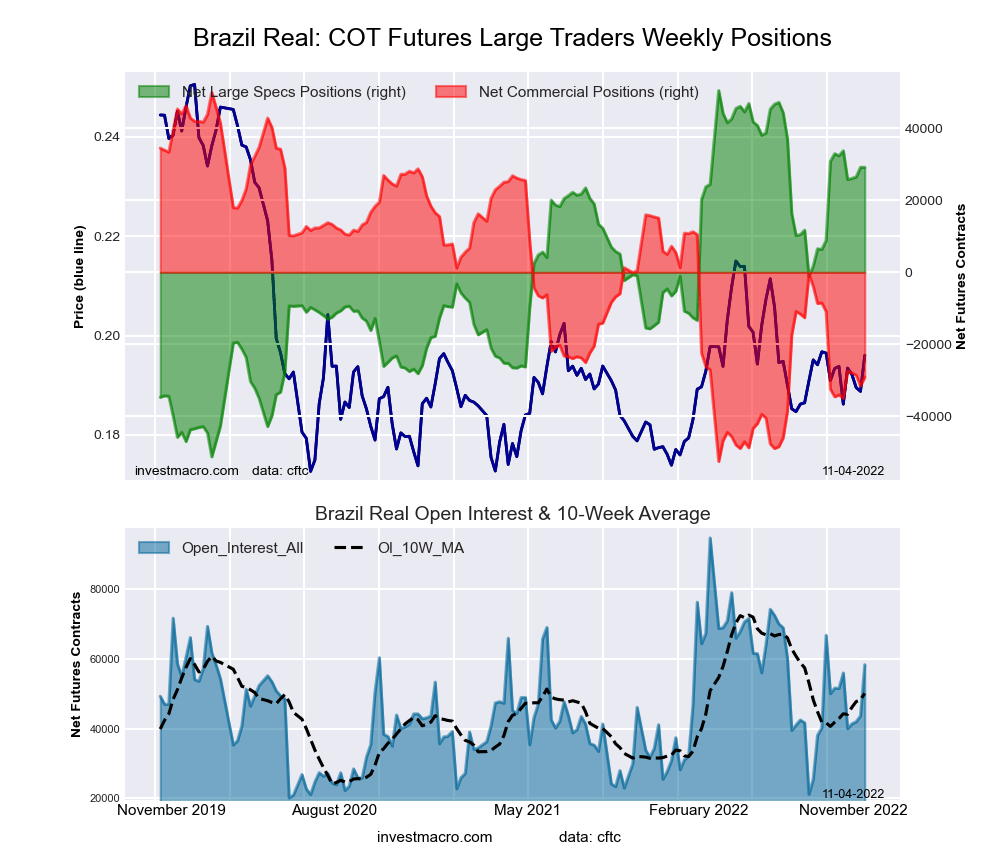 The Brazilian Real large speculator standing this week came in at a net position of 29,157 contracts in the data reported through Tuesday. This was a weekly fall of -22 contracts from the previous week which had a total of 29,179 net contracts.
This week’s current strength score (the trader positioning range over the past three years, measured from 0 to 100) shows the speculators are currently Bullish with a score of 79.0 percent. The commercials are Bearish with a score of 22.9 percent and the small traders (not shown in chart) are Bullish with a score of 64.6 percent.
| BRAZIL REAL Statistics | SPECULATORS | COMMERCIALS | SMALL TRADERS |
| – Percent of Open Interest Longs: | 65.7 | 22.9 | 10.7 |
| – Percent of Open Interest Shorts: | 15.7 | 72.9 | 10.7 |
| – Net Position: | 29,157 | -29,139 | -18 |
| – Gross Longs: | 38,325 | 13,328 | 6,246 |
| – Gross Shorts: | 9,168 | 42,467 | 6,264 |
| – Long to Short Ratio: | 4.2 to 1 | 0.3 to 1 | 1.0 to 1 |
| NET POSITION TREND: | | | |
| – Strength Index Score (3 Year Range Pct): | 79.0 | 22.9 | 64.6 |
| – Strength Index Reading (3 Year Range): | Bullish | Bearish | Bullish |
| NET POSITION MOVEMENT INDEX: | | | |
| – 6-Week Change in Strength Index: | -3.2 | 4.8 | -20.2 |
Bitcoin Futures:
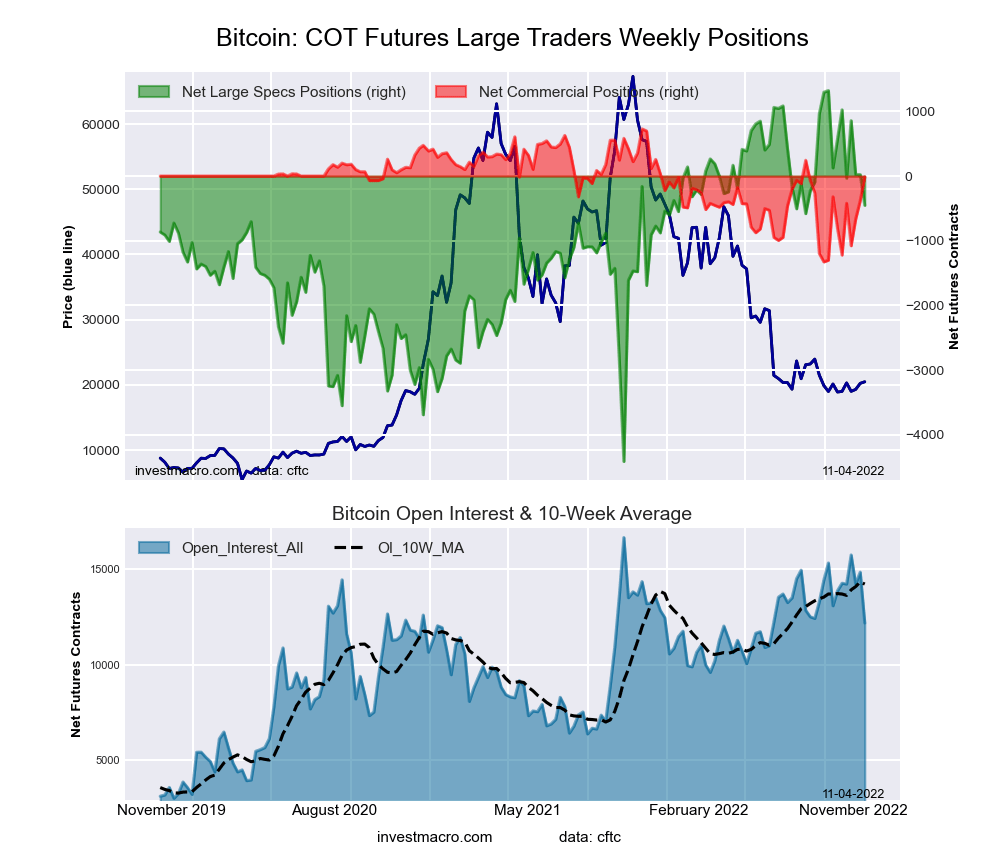 The Bitcoin large speculator standing this week came in at a net position of -452 contracts in the data reported through Tuesday. This was a weekly lowering of -475 contracts from the previous week which had a total of 23 net contracts.
This week’s current strength score (the trader positioning range over the past three years, measured from 0 to 100) shows the speculators are currently Bullish with a score of 69.1 percent. The commercials are Bullish with a score of 63.8 percent and the small traders (not shown in chart) are Bearish with a score of 23.6 percent.
| BITCOIN Statistics | SPECULATORS | COMMERCIALS | SMALL TRADERS |
| – Percent of Open Interest Longs: | 73.6 | 3.3 | 10.0 |
| – Percent of Open Interest Shorts: | 77.3 | 3.5 | 6.2 |
| – Net Position: | -452 | -16 | 468 |
| – Gross Longs: | 8,967 | 406 | 1,218 |
| – Gross Shorts: | 9,419 | 422 | 750 |
| – Long to Short Ratio: | 1.0 to 1 | 1.0 to 1 | 1.6 to 1 |
| NET POSITION TREND: | | | |
| – Strength Index Score (3 Year Range Pct): | 69.1 | 63.8 | 23.6 |
| – Strength Index Reading (3 Year Range): | Bullish | Bullish | Bearish |
| NET POSITION MOVEMENT INDEX: | | | |
| – 6-Week Change in Strength Index: | -17.9 | 38.7 | 5.3 |
Article By InvestMacro – Receive our weekly COT Newsletter
*COT Report: The COT data, released weekly to the public each Friday, is updated through the most recent Tuesday (data is 3 days old) and shows a quick view of how large speculators or non-commercials (for-profit traders) were positioned in the futures markets.
The CFTC categorizes trader positions according to commercial hedgers (traders who use futures contracts for hedging as part of the business), non-commercials (large traders who speculate to realize trading profits) and nonreportable traders (usually small traders/speculators) as well as their open interest (contracts open in the market at time of reporting). See CFTC criteria here.


