Source: Ron Struthers (11/29/22)
Expert Ron Struthers believes consumers are on an unsustainable path of wracking up credit card debt, and it is only a matter of when the economy buckles, meanwhile big profits are being made by tanker companies and oil and gas/energy transmission companies as supplies continue to tighten.
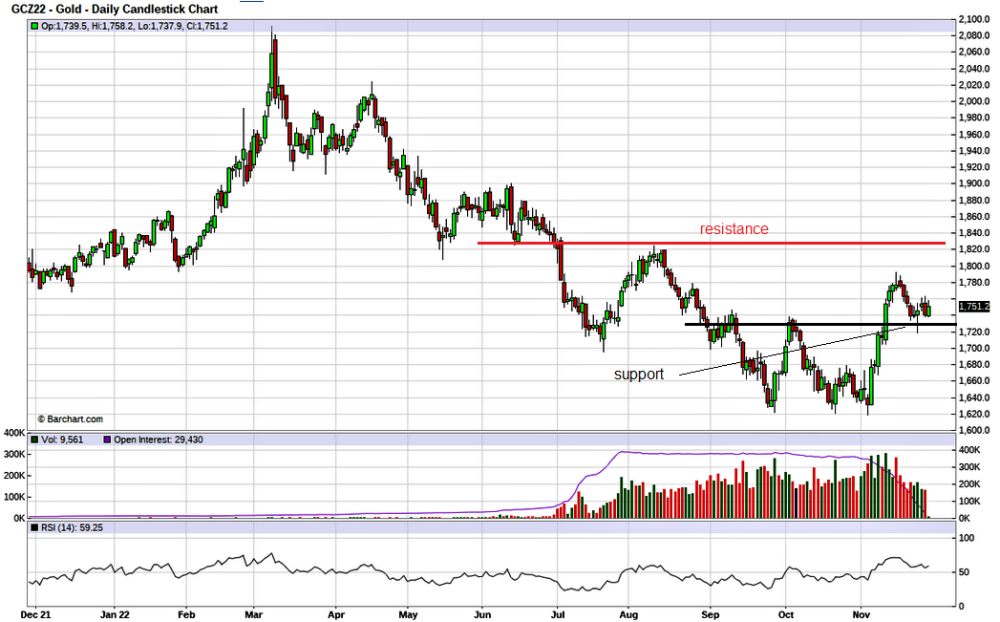
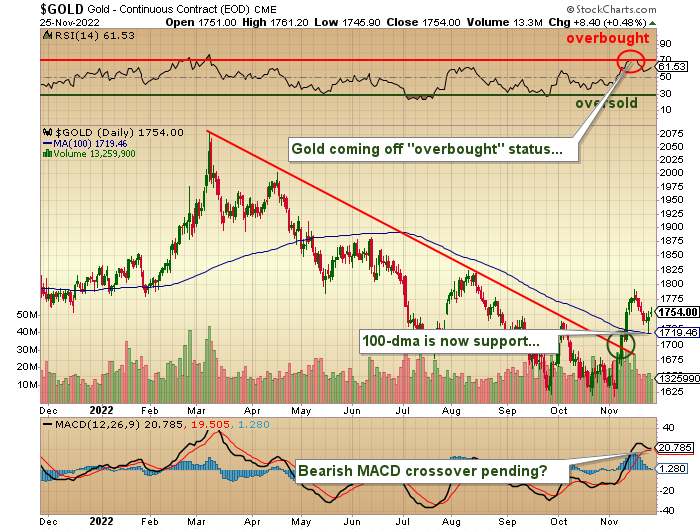
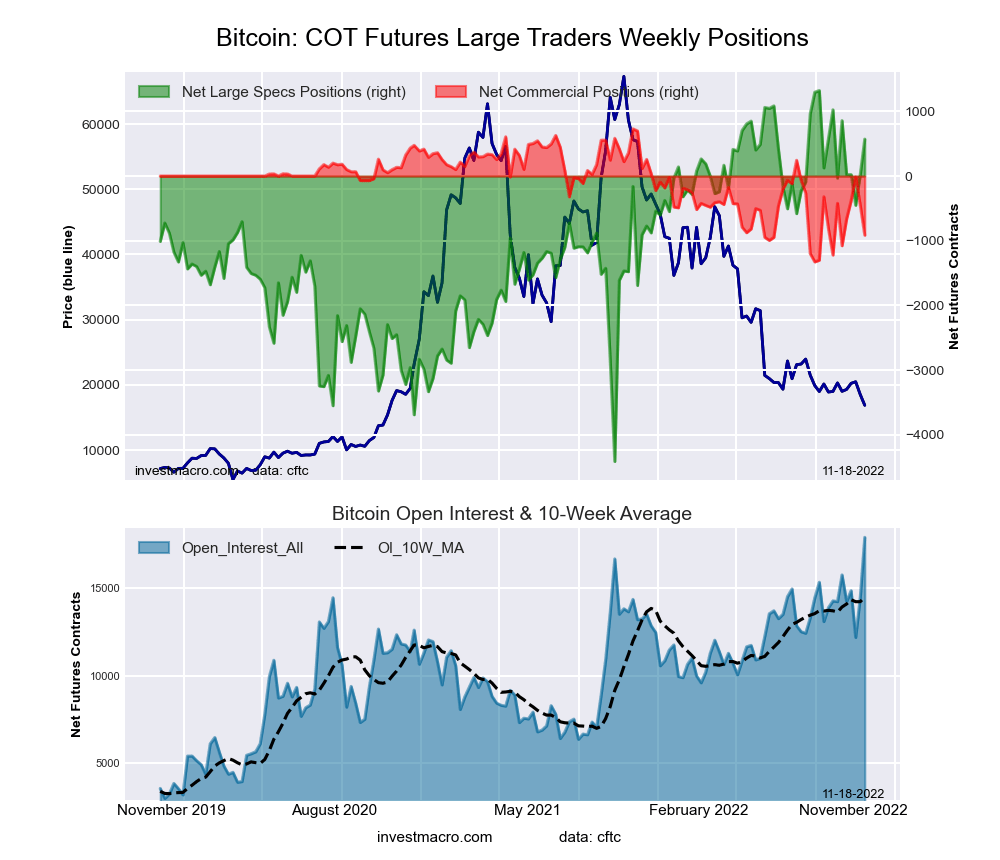
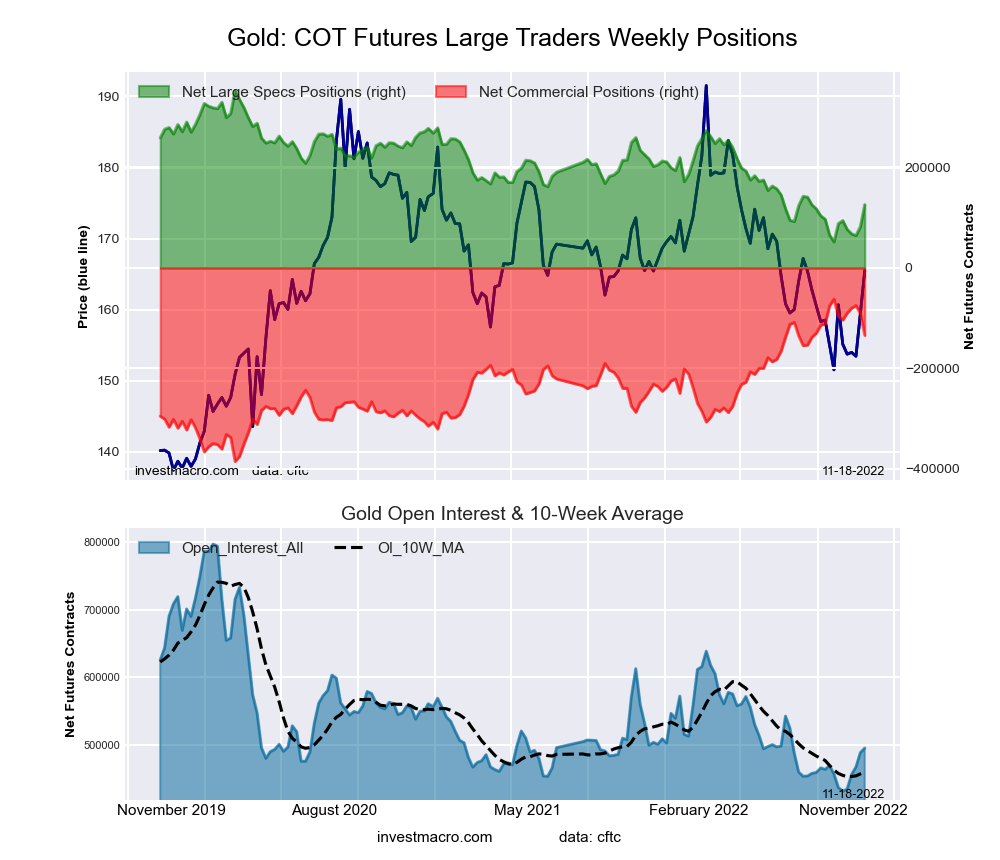
Gold bounced off the US$1730 support area I outlined in my Nov 22, 2022 update. Last week witnessed a hammer candle stick down to US$1720. So far, we are holding above my support level, and my new bull market theory is looking good so far. A break above US$1830 would be a strong sign of a new bull move.
A U.S. consumer confidence survey fell to 100.2 in November and touched the lowest level in four months, reflecting growing angst about a softening economy and potential recession. The closely followed index dropped 2 points from 102.2 in the prior month, the nonprofit Conference Board said today.
The U.S. Housing Market
The U.S. housing market pulled back even more in September, with prices slipping 1.2% from a month earlier. It was the third straight decline for the seasonally adjusted measure of prices in 20 large U.S. cities, according to the S&P CoreLogic Case-Shiller index.
Canada is setting records. Home sales had fallen for eight straight months before October brought a small uptick. Not only is that the longest stretch of falling sales on record, but it is also the steepest, said a CIBC team. “And it’s not really over yet.”
Prices are also setting records. With the average price of a home in Canada down 20% since February, the correction is already the steepest on record, said CIBC.
Well, this is no surprise to us. I believe the bad effect on Canadian Banks will be delayed some. I have learned that many of the variable rate mortgages have fixed payments but increase the amount of the payment that is interest only as rates rise until some trigger point is met, and the mortgagee will then have to make a large lump sum payment.
Skyrocketing home prices and massive interest rate spikes have driven affordability to its worst level in decades, according to a TD Economics report, leaving some first-time buyers shut out of the market altogether.
It is hard to get a handle on the numbers, but there was an article last week where the Bank of Canada said 50% of variable rate mortgages have hit the trigger. I quote from that article.
“After hiking the overnight rate from near zero at the start of the year to 3.75%, the Bank of Canada said this week that about 50% of borrowers with variable-rate, fixed-payment mortgages have reached a trigger rate — the point at which set monthly payments cover only the interest while the principal remains unpaid. Nearly 13% of all Canadian mortgages are affected, according to the central bank.
Federal rules stipulate that mortgages must be amortizing — meaning borrowers must be repaying principal — but lenders have three options once a trigger-rate threshold is reached: raise monthly payments, require a lump-sum pre-payment on the mortgage, or allow borrowers to slip into negative or reverse amortization for a period under rules set by banking authorities and mortgage insurers.”
I expect the majority of affected mortgages are in Ontario. This has likely delayed defaults and more selling pressure, and the banks have not had to increase their loss reserves as quickly as past housing declines. That said, Canadian Banks are reporting financials this week, so we will get a picture of how much their earnings are declining, but they won’t feel the heavy brunt of the housing decline until 2023.
Canada house prices will fall much further. Skyrocketing home prices and massive interest rate spikes have driven affordability to its worst level in decades, according to a TD Economics report, leaving some first-time buyers shut out of the market altogether.
“The drop in prices has not offset the effect of higher interest rates,” said RBC economist Robert Hogue. “Our affordability measure is still deteriorating.”
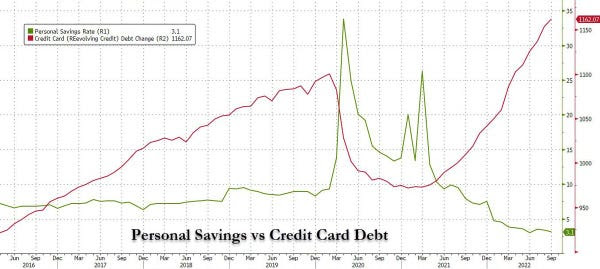
Another factor is that homeowners and consumers are piling up credit card debt, which only delays the reckoning.
Equifax Canada’s consumer survey released end of October found the average credit card balance held by Canadians was at a record high of CA$2,121 by the end of September.
This chart was posted by @zerohedge on Twitter. U.S. consumers are piling on credit card debt even faster than Canadians.
Cyber Monday Vs. Black Friday
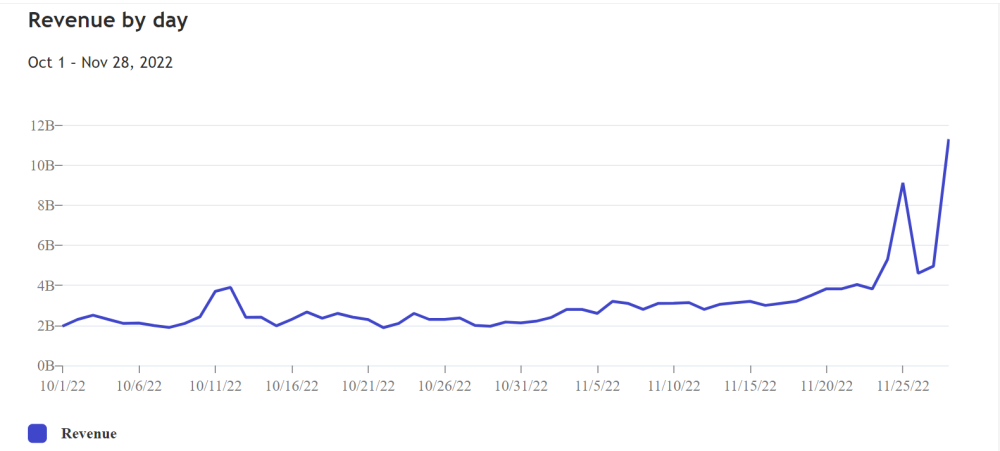
According to Adobe Analytics, the e-commerce-focused Cyber Monday has usurped Black Friday as the premier sales day of the holiday season.
Consumers spent US$11.79B on Cyber Monday sales, comfortably above the US$9.12B recorded for Black Friday, which was a new record.
It would appear that U.S. consumers are not worried about high-interest rates and a recession or maybe don’t know what one is. At the moment, there is no sign of a recession, but avoiding one by making ends meet with credit cards is just a band-aid.
The chart next page shows the spike in Monday online sales over Black Friday.
Meanwhile, the equity markets seem to be undecided about their direction.
I think there is some more room to rally up to around 4,100, but if we see a drop below 3,900, it would likely mean this bear market rally is over.
The Oil Market
Now let’s get to some better news for us with our shipping stocks, ATCO and DHT. And a look at the oil market.
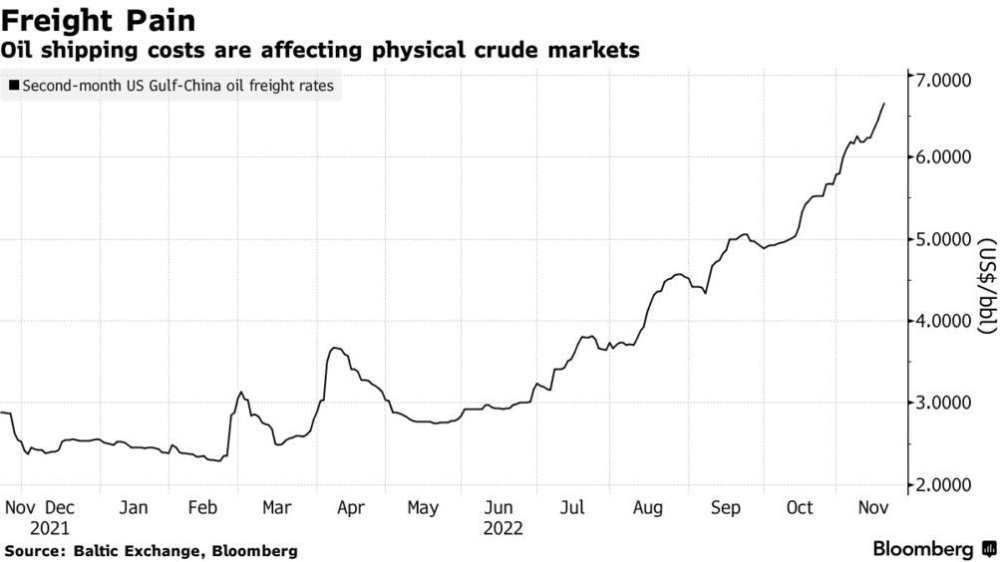
Earnings on the U.S. Gulf Coast-to-China shipping route have soared above US$100,000 per day, equivalent to US$7 per barrel, demonstrating the shrinking availability of crude tankers lately.
As reported by Bloomberg, global long-term LNG contracts before 2026 are all sold out, meaning that over the upcoming three years (until Qatar’s upgrades are commissioned), Europe and Asia will remain on a collision course for remaining spot cargoes.
The recent weakness in oil is probably because of shipping costs. Spot differentials for crudes across the Americas are tanking because of higher shipping costs — free-on-board prices for WTI plummeted a whopping US$5 per barrel week-on-week to reflect the shipping.
Oilprice.com pointed out last week that the shortage of tankers is taking place across all vessel categories; even VLCC freight costs from the Middle East into Asia Pacific have tripled year-on-year. The news of Freeport LNG pushing its restart into March 2023 following a damning report from federal pipeline safety regulators has pushed U.S. natural gas prices to US$6.7 per mmBtu, aggravated by forecasts for colder weather into December.
Germany’s LNG Terminal Costs Soar
The cost of purchasing and maintaining floating LNG terminals to help Germany survive this winter and diversify away from Russian gas has doubled to some US$6.6 billion, with the first unit already completed at the North Sea port of Wilhelmshaven.
As reported by Bloomberg, global long-term LNG contracts before 2026 are all sold out, meaning that over the upcoming three years (until Qatar’s upgrades are commissioned), Europe and Asia will remain on a collision course for remaining spot cargoes.
Remember, the oil sanctions on Russia were only announced, and the EU sanctions are supposed to come into effect in less than two weeks. Italy is considering several options to save its largest refinery, operated by Russia’s Lukoil in Sicily; one of them is to ask the EU for a temporary waiver.
A petition from a range of public interest groups is pushed the U.S. government to condition the approval of federal drilling permits on operators posting the upfront cost to clean up wells, trying to deter cases when small producers file for bankruptcy to avoid cleanup costs.
More Biden Administration negative influence on oil and gas exploration. The only thing I know for certain is the whole energy sector is in a mess and will just get worse. This winter will be horrific for many. However, as investors, there are great ways to profit from the government fiasco. Our two shipping stocks are doing great.
Atlas Energy Group
Atlas Energy Group, LLC (ATLS:OTCMKT) is being bought out at US$15.50 and will be taken private by Q2 2023, and they will keep paying the dividend until then.
You can hold the stock and get US$15.50 or sell now and put funds into one of my other millennium stocks.
We have a yield of 6.8%, but that is based on our US$7.33 buy price. The current yield is 3.2%, and there are other stocks on my Millennium Index with higher yields. A good replacement could be—
Energy Transfer
Energy Transfer Partners L.P. (ET:NYSE) is yielding 8.5% paying US$0.265 per quarter. The company plans to get back to its pre covid dividend of US$0.305 per quarter. I see no reason why they will not get there.
ET reported very good Q3 results on September 30, 2022. Net income attributable to partners for the three months ended September 30, 2022, of US$1.01 billion, a US$371 million increase from the same period last year. For the same period, net income per limited partner unit (basic and diluted) was US$0.29 per unit.
In the third quarter of 2022, the partnership experienced a US$126 million charge in the crude oil transportation and services segment related to a legal matter. In addition, Energy Transfer’s third quarter 2022 results were impacted by an approximately US$130 million negative adjustment related to hedged inventory in the NGL and refined products transportation and services segment.
These two items impacted the third quarter of 2022’s Adjusted EBITDA by approximately US$260 million in aggregate. Otherwise, ET numbers could have been better still.
During the third quarter of 2022, each of Energy Transfer’s five core segments realized higher volumes compared with the same period in 2021.
- Intrastate natural gas transportation volumes were up 28% and set a new Partnership record.
- Interstate natural gas transportation volumes were up 43%.
- Midstream gathered volumes were up 47% and set a new Partnership record.
- NGL transportation volumes were up 5%.
- NGL fractionation volumes were up 6% and set a new Partnership record.
- Crude oil transportation and terminal volumes were up 10% and 14%, respectively.
Over 90% of ET’s growth capital spending is comprised of projects that are already on-line or expected to be on-line and contributing cash flow at very attractive returns before the end of 2023.
The project backlog includes Gulf Run Pipeline in Louisiana, Grey Wolf and Bear processing plants in the Permian Basin, Fractionator VIII in Mont Belvieu, and LPG facilities projects at Energy Transfer’s Nederland Terminal.
There is no good reason why this stock is not back to the higher levels witnessed in 2019. The recent break above US$12.50 is a good signal the stock is headed higher.
DHT Holdings
DHT Holdings Inc.’s (DHT:NYSE) stock moved very quickly for us, breaking out to highs and prices not seen since 2012. The oil shipping market will probably get tighter still this winter. Since we bought the stock in early October, they released their Q3 results on November 7, 2022.
In the third quarter of 2022, the Company achieved combined time charter equivalent earnings of US$25,400 per day, comprised of US$35,300 per day for the Company’s VLCCs on time-charter and US$22,000 per day for the Company’s VLCCs operating in the spot market. Adjusted EBITDA for the third quarter of 2022 was US$35.6 million. Net profit for the quarter was US$7.5 million, which equates to US$0.04 per basic share. DHT is paying a US$0.04 dividend, payable today.
Profits and dividends are going much higher. Look at the rates they are getting so far in Q4 compared to the above. Thus far, in the fourth quarter of 2022, 69% of the available VLCC spot days have been booked at an average rate of US$61,800 per day on a discharge-to-discharge basis.
77% of the available VLCC days, combined spot and time-charter days, have been booked at an average rate of US$53,100 per day (not including any potential profit splits on time charters).
Our timing to buy the stock was perfect, with the dip under US$7.50. The pullback from the recent US$10.50 is healthy market action, and I would buy on any dip below US$9.50.
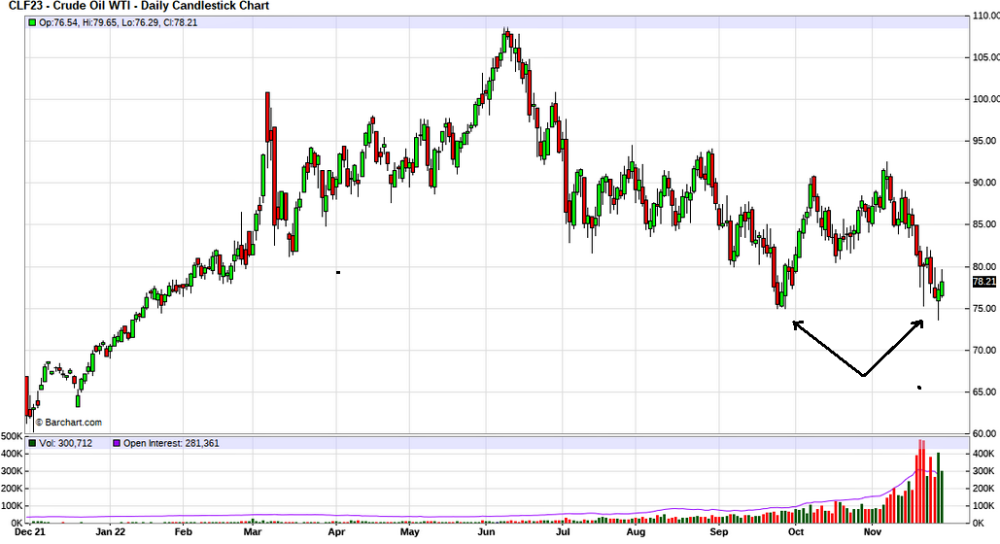
Sentiment in the oil market has been weak, with the China Covid-19 lockdowns causing demand fear.
At the same time, liquidity in the key contracts traded is wafer-thin as last week’s volatility prompted the sell-off of an equivalent of 90 million barrels, with open interest in WTI falling to the lowest since 2015.
Oil dropped under US$40 in 2015, where it bottomed, so this low open interest is likely another bottom with a second test of US$75.
The Emergencies Act
I hate to say I told you so because it is not good news.
Early this year, I commented that invoking the Emergencies Act in Canada caused a bank run and would result in strong capital outflows from Canada.
Capital flows are transactions involving financial assets between international entities.
The Emergencies Act was invoked in February, and you can see the steep plunge since then. The last biggest steep plunge was in the 2008 financial crisis, which saw a plunge from around +6000 to -11,000 (click 25-year chart). This current plunge is much more than that.
Financial assets to be included can be bank deposits, loans, equity securities, debt securities, etc. Capital outflow generally results from economic uncertainty in a country, whereas large amounts of capital inflow indicate a growing economy.
It has been a while now since Trudeau made his ridiculous move, and we have some data.
This is a 10-year chart of Canada Capital flows from Statistics Canada.
You can see that Capital flows were improving with the recovery from the pandemic and high oil prices that in the past have been a big benefit to Canada.
From around 2001 to 2008, Canada had its strongest inflows when oil ran from around US$60 to US$150. Canada was running at the 10,000 mark on the plus side back then.
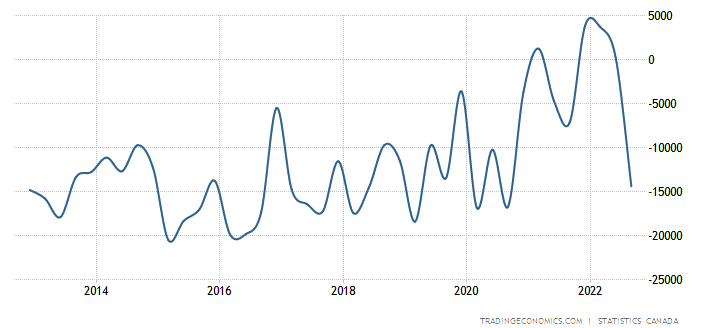
The Emergencies Act was invoked in February, and you can see the steep plunge since then. The last biggest steep plunge was in the 2008 financial crisis, which saw a plunge from around +6000 to -11,000 (click 25-year chart). This current plunge is much more than that, and we have not seen the bottom yet. There is no doubt we are seeing the greatest outflow of money from Canada in its history.
The Emergencies Act in Canada was all about going after the ‘Freedom Convoy’ money. The big Canadian banks admitted just that in the current parliament inquiry underway. I am not going to get into that and the political BS right now, but it is no surprise business confidence is plunging also.
Small business confidence in Canada has hit one of its lowest levels ever, according to the Canadian Federation of Independent Business (CFIB). Meanwhile, the long-term index, based on a 12-month outlook, dropped 1.2 points to 50.0 this month — the lowest recorded since 2009, outside of the 2008/09 and 2020 recessions, the CFIB said.
Right now, markets in Canada and the U.S. are trading on the proverbial ‘soft landing’ that seldom occurs. A severe recession is coming that will get started in Europe this winter as they are forced to shut down industries because of energy shortages.
Putin’s recent attacks on Ukraine’s energy grid will result in more shortages as Ukraine is no longer able to export electricity to Europe.
I hate to say it, but another bad news told-you-so will sadly occur this winter.
From a personal experience, I have an emergency kerosene heater and paid around US$20 for an 18 to 19-liter jug of fuel. A recent discussion prompted me to check prices, and I found out those jugs of fuel are now selling for over US$100. And that is if you can find one.
Struthers Stock Report Disclaimers:
All forecasts and recommendations are based on opinion. Markets change direction with consensus beliefs, which may change at any time and without notice. The author/publisher of this publication has taken every precaution to provide the most accurate information possible. The information & data were obtained from sources believed to be reliable, but because the information & data source are beyond the author’s control, no representation or guarantee is made that it is complete or accurate.
The reader accepts information on the condition that errors or omissions shall not be made the basis for any claim, demand or cause for action. Because of the ever-changing nature of information & statistics the author/publisher strongly encourages the reader to communicate directly with the company and/or with their personal investment adviser to obtain up to date information.
Past results are not necessarily indicative of future results. Any statements non-factual in nature constitute only current opinions, which are subject to change. The author/publisher may or may not have a position in the securities and/or options relating thereto, & may make purchases and/or sales of these securities relating thereto from time to time in the open market or otherwise. Neither the information, nor opinions expressed, shall be construed as a solicitation to buy or sell any stock, futures or options contract mentioned herein. The author/publisher of this letter is not a qualified financial adviser & is not acting as such in this publication.
Disclosures:
Charts provided by the author.
1) Ron Struthers: I, or members of my immediate household or family, own shares of the following companies mentioned in this article: Energy Transfer and DHT Holdings. I personally am, or members of my immediate household or family are, paid by the following companies mentioned in this article: None. My company currently has a financial relationship with the following companies mentioned in this article: None. I determined which companies would be included in this article based on my research and understanding of the sector.
2) The following companies mentioned in this article are billboard sponsors of Streetwise Reports: None. Click here for important disclosures about sponsor fees. The information provided above is for informational purposes only and is not a recommendation to buy or sell any security.
3) Statements and opinions expressed are the opinions of the author and not of Streetwise Reports or its officers. The author is wholly responsible for the validity of the statements. The author was not paid by Streetwise Reports for this article. Streetwise Reports was not paid by the author to publish or syndicate this article. Streetwise Reports requires contributing authors to disclose any shareholdings in, or economic relationships with, companies that they write about. Streetwise Reports relies upon the authors to accurately provide this information and Streetwise Reports has no means of verifying its accuracy.
4) This article does not constitute investment advice. Each reader is encouraged to consult with his or her individual financial professional and any action a reader takes as a result of information presented here is his or her own responsibility. By opening this page, each reader accepts and agrees to Streetwise Reports’ terms of use and full legal disclaimer. This article is not a solicitation for investment. Streetwise Reports does not render general or specific investment advice and the information on Streetwise Reports should not be considered a recommendation to buy or sell any security. Streetwise Reports does not endorse or recommend the business, products, services, or securities of any company mentioned on Streetwise Reports.
5) From time to time, Streetwise Reports LLC and its directors, officers, employees, or members of their families, as well as persons interviewed for articles and interviews on the site, may have a long or short position in the securities mentioned. Directors, officers, employees, or members of their immediate families are prohibited from making purchases and/or sales of those securities in the open market or otherwise from the time of the decision to publish an article until three business days after the publication of the article. The foregoing prohibition does not apply to articles that in substance only restate previously published company releases.


 Graphene has many incredible physical properties that arise from its one-atom-thick carbon structure.


