I will discuss gold in a few paragraphs, but first. . .
Andrew Ross Sorkin
At the exact moment where I thought I could move on from this incessant preoccupation with FTX founder Sam Bankman-Fried, along comes one of the Wall Street media “royalty,” author of the book Too Big to Fail and a regular morning anchor on CNBC, Andrew Ross Sorkin, who makes the fateful decision to interview SBF in a global broadcast effectively allowing the alleged mastermind of the largest “misallocation” of customer funds in history a virtually unchallenged opportunity to pre-plead his case.
Notwithstanding the softball questions and buddy-buddy repartee between them, Sorkin and the NT Times audience actually applauded Bankman-Fried at the end of the interview.
Granted that the young man has not been indicted for any crime yet, these media gluttons are free to take whatever cash he transferred their way in return for the venue. They were (and still are) free to do anything they so choose with him because he is innocent until proven guilty, despite the admissions of the comingling of customer funds with that of his private trading entity, Alameda, as well as failure to adequately explain why he felt it excusable to buy tens of millions of dollars of real estate and put it in his own name or that of his parents.
The only reason I bring this up lies in the now-famous quote by the late, brilliant comedian George Carlin, when he said in reference to the elites that run the nation, “It is one big club, and you ain’t in it!”
Now, I am not going to continue to beat this dead mule as it truly serves no purpose but what I will say is that I find these interviews in poor taste at best and obscenely greed-driven at worst with the determination of legality to be decided at a later date.
To think that political parties on both sides of the aisle were given enormous amounts of campaign funding as well as all of the media companies, is an absolute abomination and an abject conflict of interest of staggering proportions.
The only reason I bring this up lies in the now-famous quote by the late, brilliant comedian George Carlin, when he said in reference to the elites that run the nation, “It is one big club, and you ain’t in it!”
To have such a prominent Wall Street cheerleader like Ross-Sorkin sit there and serve up overhand smashes for the fully-prepared SBF was, at least for me, an offense. It makes one wonder just how much the average investor is getting played by the Wall Street titans that control the behemoth software programs that are able to identify trades nanoseconds before they occur.
As my late friend and technical analyst Ian McAvity used to say, “In the hold of every sunken ship, you will always find a chart.”
It makes you wonder whether the bid offer for a particular security is real and whether the research report recommending an issuer is the product of actual research (as in “unbiased”) or whether it is part of an investment banking agreement where the only research generated with positive tilts are those attached to banking fees.
“Plus ça change, plus c’est la meme chose,” (The more things change, the more they remain the same.) wrote French writer Alphonse Karr and in the case of Wall Street, it is a most-fitting and very apropos phrase for describing an event that mirrors the unbridled hubris of the 2001 DotCom crash and the 2008 Subprime crash, two of the most recent examples of Wall Street Gone Wild under the influence of the most powerful narcotic known to mankind — greed.
I want this chapter to be the last in the sequence, but until someone actually goes to jail for white-collar crimes of ever-increasing magnitude and audacity, it is an exercise in futility.
The Fed Concerned About Overtightening
Moving along, this week was dominated by Fed Chairman Jerome Powell, so I will provide a sample of Email Alert 2022-109 sent to subscribers on Thursday morning pre-opening:
“I am concerned about overtightening.”
— Jerome Powell, November 30th, 2022
Yesterday afternoon, one solitary word — “overtightening” — sent the Dow Jones Industrials up 2.18% on the hope and prayer that the rate-hike cycle is soon coming to a close.
The S&P 500 popped 3.09%, with the NASDAQ an impressive 4.41% as the beaten-up technology issues caught a hefty, short-covering bid. That he reaffirmed the Fed’s intention to continue increasing — as opposed to lowering — borrowing costs means nothing when the bulls decide to charge.
What I take to the bank about yesterday’s reaction to Powell’s speech is that it was most certainly not his preferred outcome because rising stock prices are in direct opposition to the stated goal of reducing demand in the economy.
I have often referred to the asymmetrical wealth effect, which was first introduced in the 1980s and assumes that rising equity prices have a positive effect on consumer spending habits. A big year-end rally that begins at the end of November will give the holiday shopping season a boost from improved month-end statements and portfolio values.
Gold Advancing
The good news for me was that while everyone was mesmerized with stocks, the gold and silver markets advanced 1.28% and 4.45%, respectively, in response to Powell’s “overtightening” fears.
In markets dominated by apprehension, knee-jerk reactions tend to be overblown by abnormally-large short positions and/or FOMO (fear of missing out), but while I think that applies to stocks, it was not the case for the precious metals, where an orderly advance simply gathered steam as the session wore on.
What is usually absent from the gold and silver markets is next-day follow-through, so to have gold nudging up against US$1,800 resistance and silver blowing through US$22.00 resistance is encouraging (verging upon exciting).”
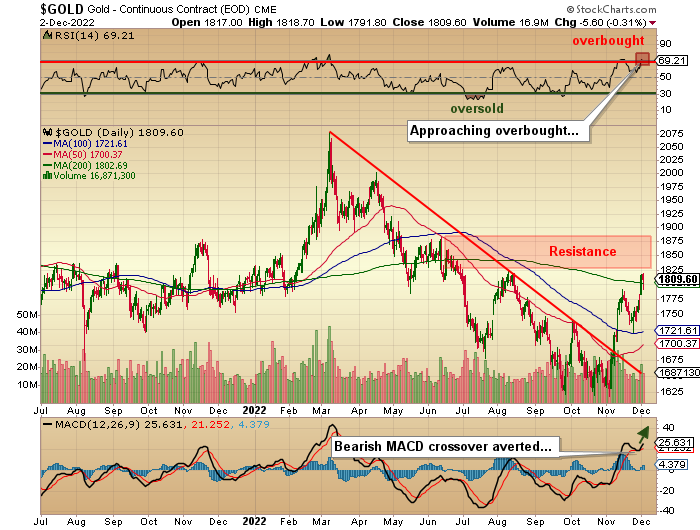
The highlighted part is particularly important as Thursday saw an extremely powerful follow-through, with February gold punching out through that US$1,800 resistance and actually settling at US$1,815.30.
From the CME pit session close Wednesday to the pit session close Thursday saw a US$55.30/ounce pop, which broke it out through the 200-DMA as well.
The next two resistance levels are US$1,825 and US$1,875, but with the RSI settling on Thursday at US$71.22, gold moved into an overbought condition and in need of a sideways consolidation with which to work it off while holding US$1,800.
Mind you, it should be known that coming off the COVID crash lows of March 2020, gold stayed in overbought condition for eleven days, with RSI eventually topping out at US$91.57.
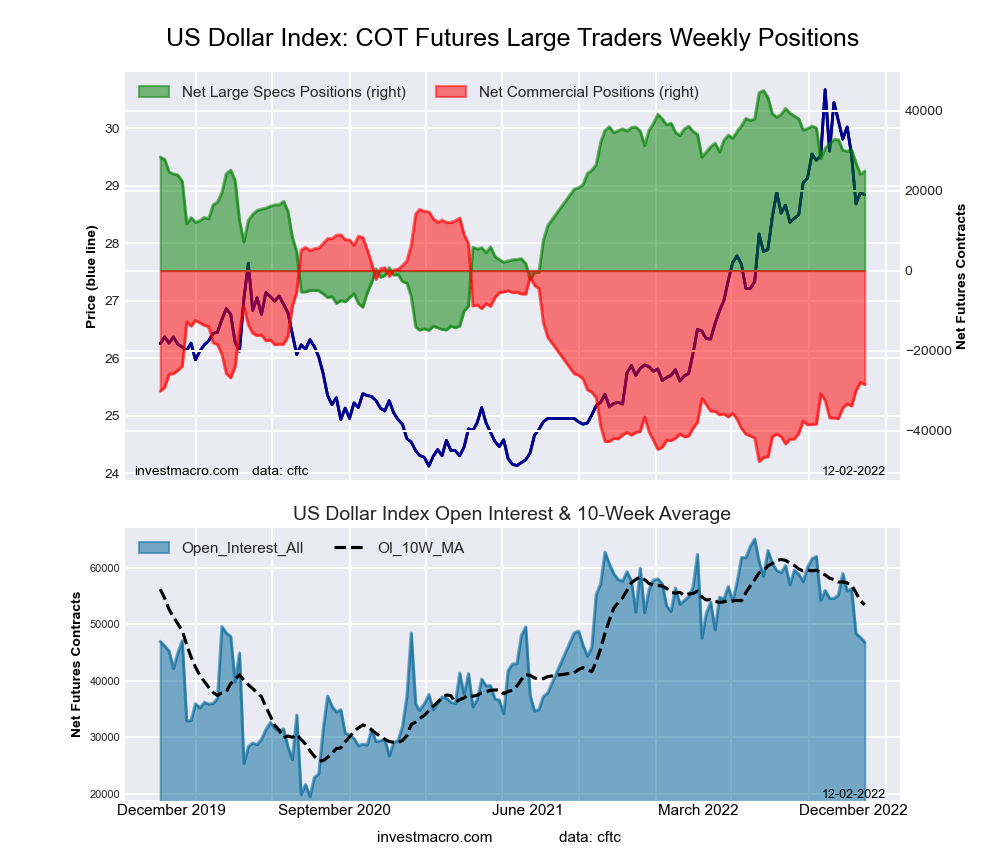
As I have been discussing for the better part of twenty years, the prices for precious metals are inextricably linked to the U.S. dollar because all commodities are priced in the reserve currency of the globe.
It is akin to a “peg” only because if your domestic currency is the British pound and you step into the London Metals Exchange to buy a carload of gold, you are paying the dollar quote, not the pound quote.
Weakness in non-dollar units of exchange will buy less gold per unit and vice-versa.
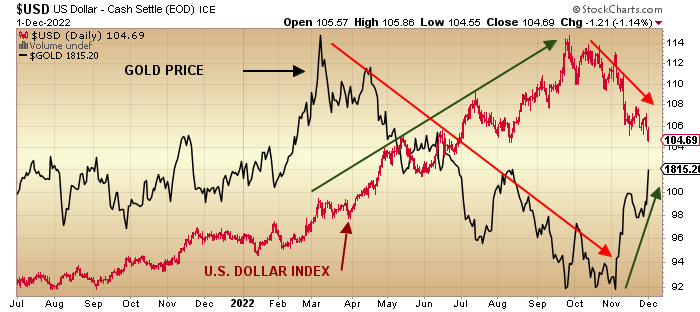
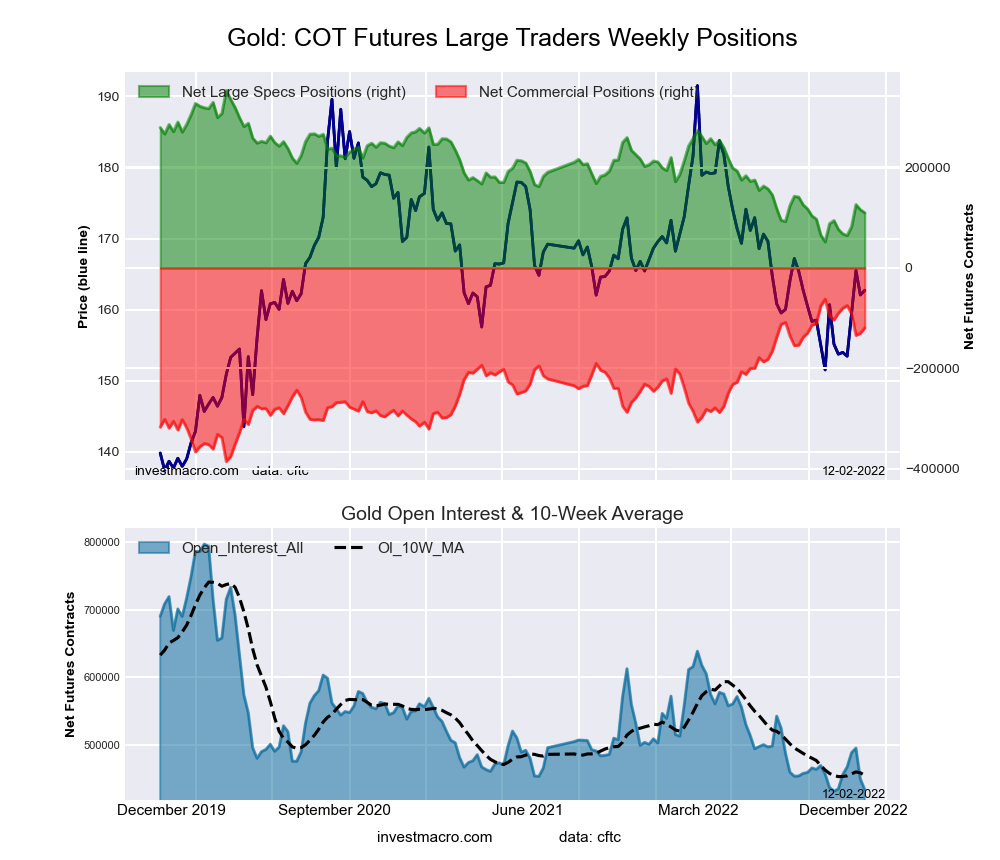
This chart is a clear illustration of the near 1:1 inverse correlation between gold and the U.S. greenback, with tops in the dollar on September 28 and November 3 coinciding perfectly with lows in gold US$1,622 and US$1,618 before embarking on the current almost US$200 per ounce rally.
To try to map out the course for gold and the dollar for the next six months is more an exercise in mindreading rather than an analysis of the economic or geopolitical landscapes.
There are just so many possible policy alternatives, all being weighed upon by domestic and foreign policy agendas related to inflation, oil prices, and partisan politics, that you have to read multiple minds to achieve accuracy.
Since mind reading is only possible if one wears a cape and goes by the title of “The Amazing Kreskin,” I depend on the predictive power of technical analysis to guide me in the general vicinity of accuracy because all of those head-and-shoulders tops and bottoms and ascending cup-and-handle mumbo-jumbo “signals” are simply clues to the mystery and not the ultimate solution.
As my late friend and technical analyst Ian McAvity used to say, “In the hold of every sunken ship, you will always find a chart.”
In all successful starts to bull moves in the precious metals, you need a combination of positive events occurring simultaneously. You need the more speculative assets classes to outperform the more conservative — i.e. junior gold miners (GDXJ:US) outperforming senior gold miners (GDX:US) and silver (SLV:US) outperforming gold (GLD:US) with the shares outperforming the metals.
This is exactly what we have seen off the September 28 lows all coincident with U.S. dollar weakness and declining bond yields.
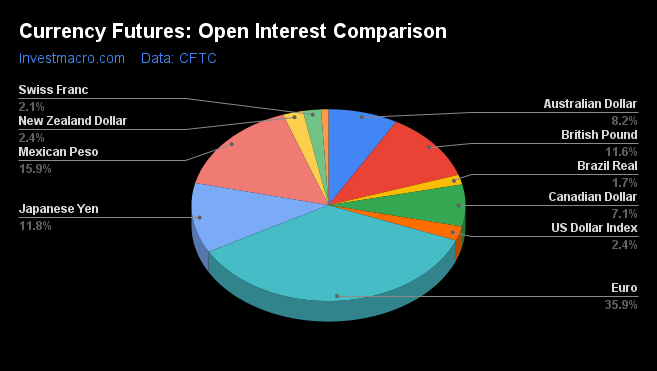
Gold Versus the Basket
There used to be an expression about a certain profession that went like this:
“How do you tell if a <insert profession> is lying?”
“His lips are moving.”
Well, the profession that has earned that reputation is now all central bank governors, presidents, and vice presidents, with the chairman being the leader.
As the former head of the European Central bank, Jean-Claude Juncker, once said, “When it becomes serious, you have to lie.” So with the global economy, with particular emphasis on the U.S. economy, decelerating rapidly, I would surmise that we have reached the point of “seriousness.”
Jerome Powell addressed the Brookings Institute on Wednesday afternoon, and despite reiterating all of his warnings about “higher for longer” (interest rate levels and duration), the infinitesimal wisdom of stock markets determined that Mr. Powell was “lying” and decided that the “pivot” was “on” and that seasonality would trump policy into year-end selling dollars and buying stocks and gold and bonds as if this was April of 2020.
Only time will tell, but I learned a long time ago that markets that spit in the eye of the consensus view are markets that should not be faded (sold).
This creates a monumental problem for the Fed (as discussed earlier), but it creates an even greater problem for me in that despite the awesome technical set-up for the precious metals as we move into December, one word out of Powell’s mouth at the December 14 FOMC meeting could derail the dollar decline and stock/gold/bond rally in a New York minute.
On the other hand, what if the events of September 28 in London, where the Band of England was forced to reverse their QT course and instead launch a QE rescue mission for their pension funds, was a precursor of systemic risks to the global financial system due — once again — to the excessive use of leverage in meeting yield requirements?
If that event is what is spooking Powell & Company, then the “pivot” actually began in clandestine fashion in late September, with all markets around the globe looking far beyond the futile jawboning of the Fed and its “honored representatives.”
Only time will tell, but I learned a long time ago that markets that spit in the eye of the consensus view are markets that should not be faded (sold).
The Friday Jobs Report came in hotter than expectations but failed to derail a major chunk of the weekly gains, most of which came after the Powell speech. I find it hilarious that a mere two days after the narrative turns “pivot positive” due to that one word — “overtighten” — a jobs report that is a lagging indicator of economic activity brings about yet another 180-degree shift in sentiment.
I suspect that in a couple of weeks, the NFP will come in under consensus with revisions to Friday’s report knocking it back to a “miss.” However, profits were taken before the Powell speech, so I am now looking for a suitable re-entry point in anticipation of a continuation of the seasonal rally into year-end.
I suspect that in a couple of weeks, the NFP will come in under consensus with revisions to Friday’s report knocking it back to a “miss.” However, profits were taken before the Powell speech, so I am now looking for a suitable re-entry point in anticipation of a continuation of the seasonal rally into year-end.
With the Dow actually up after being down US$350 on the opening, it did a complete 180 — to my absolute AWE — and closed up US$34.78 to add 82 points for the week. Astounding, but not unexpected for followers of my weekly diatribe . . .
I suspect that in a couple of weeks, the NFP will come in under consensus with revisions to Friday’s report knocking it back to a “miss.” However, profits were taken before the Powell speech, so I am now looking for a suitable re-entry point in anticipation of a continuation of the seasonal rally into year-end.
Ditto the precious metals, where I have been looking to add aggressively on dips under US$1,800 and did today with the early plunge under US$1,800. For an old gold trader like me, trained in the late 80’s bull market where a lifelong narcotic was injected into my bloodstream, the action in gold is reminiscent of the period 2009-2021 for tech stocks — all dips are bought, and no pops are sold (at least for long).
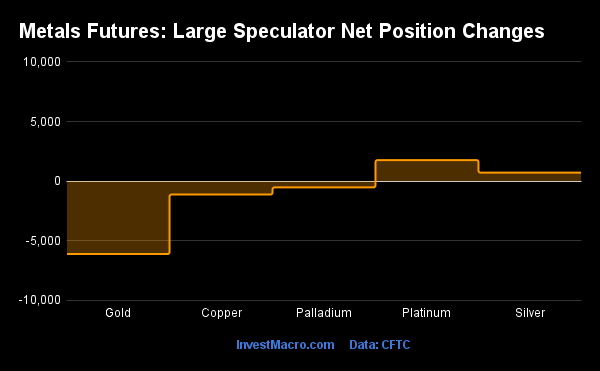
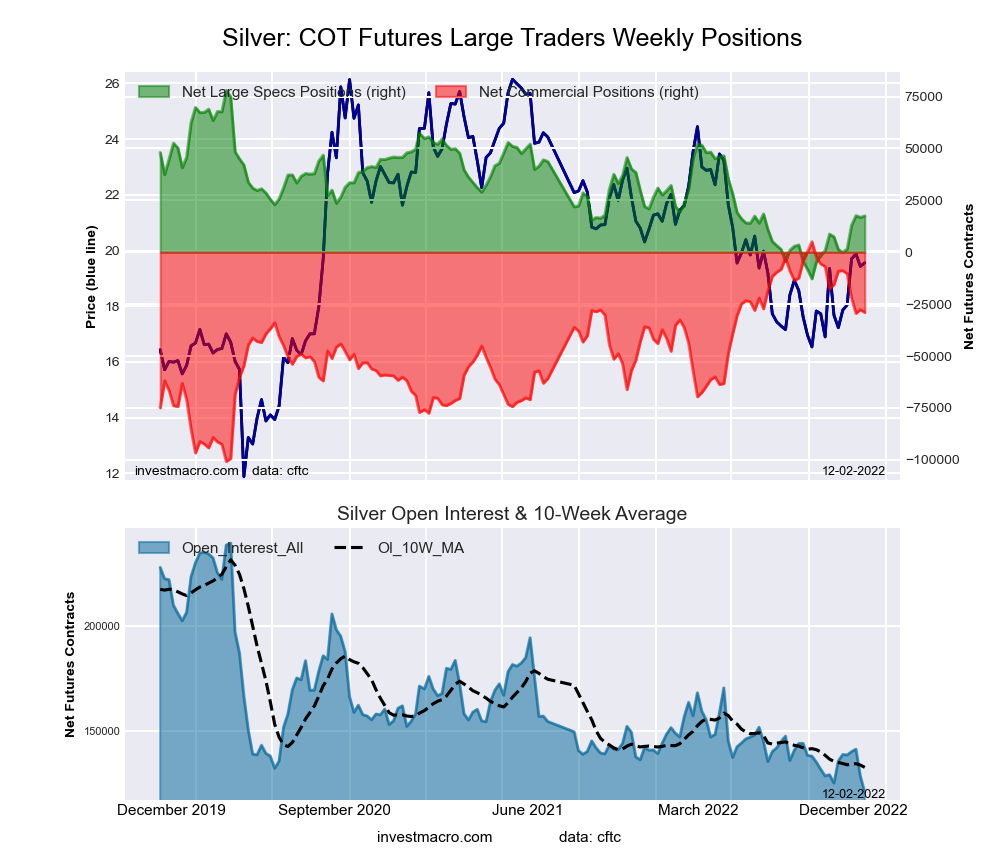
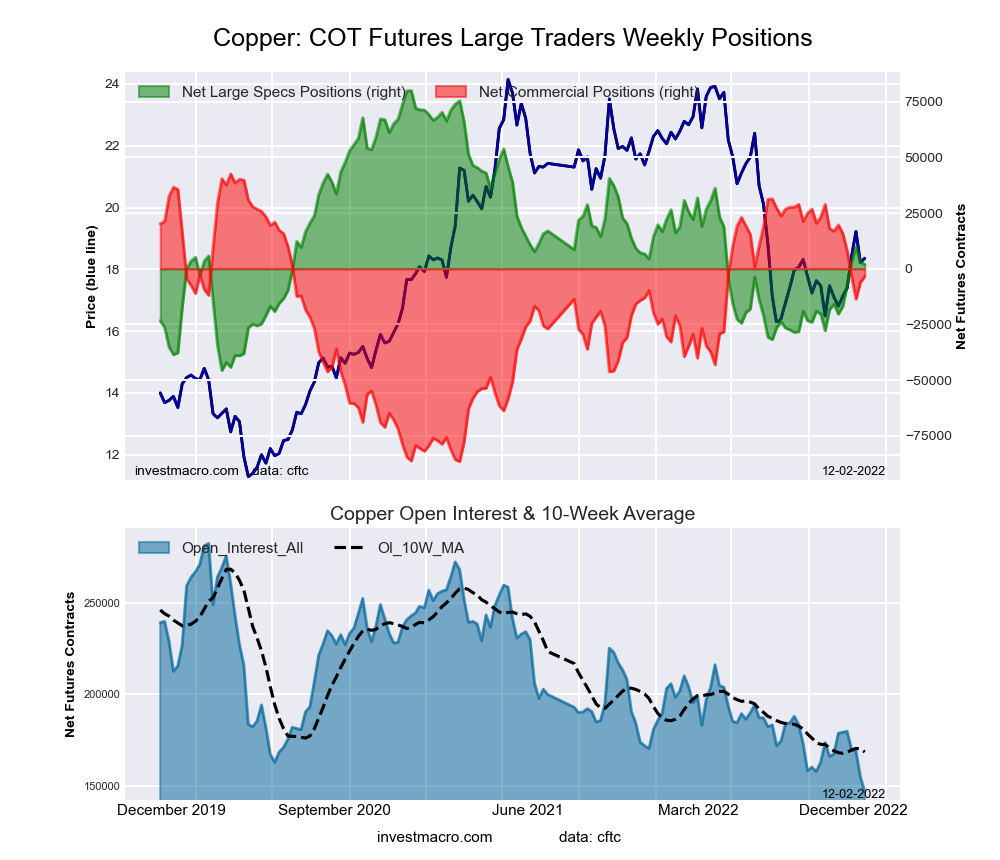
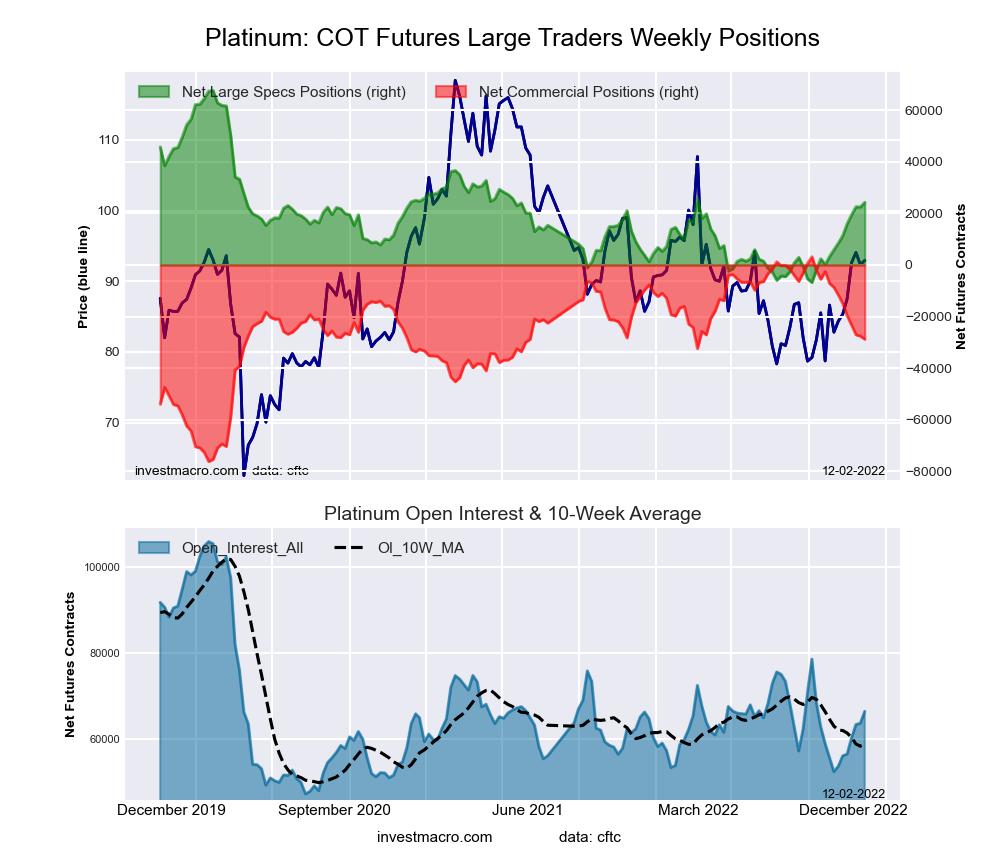
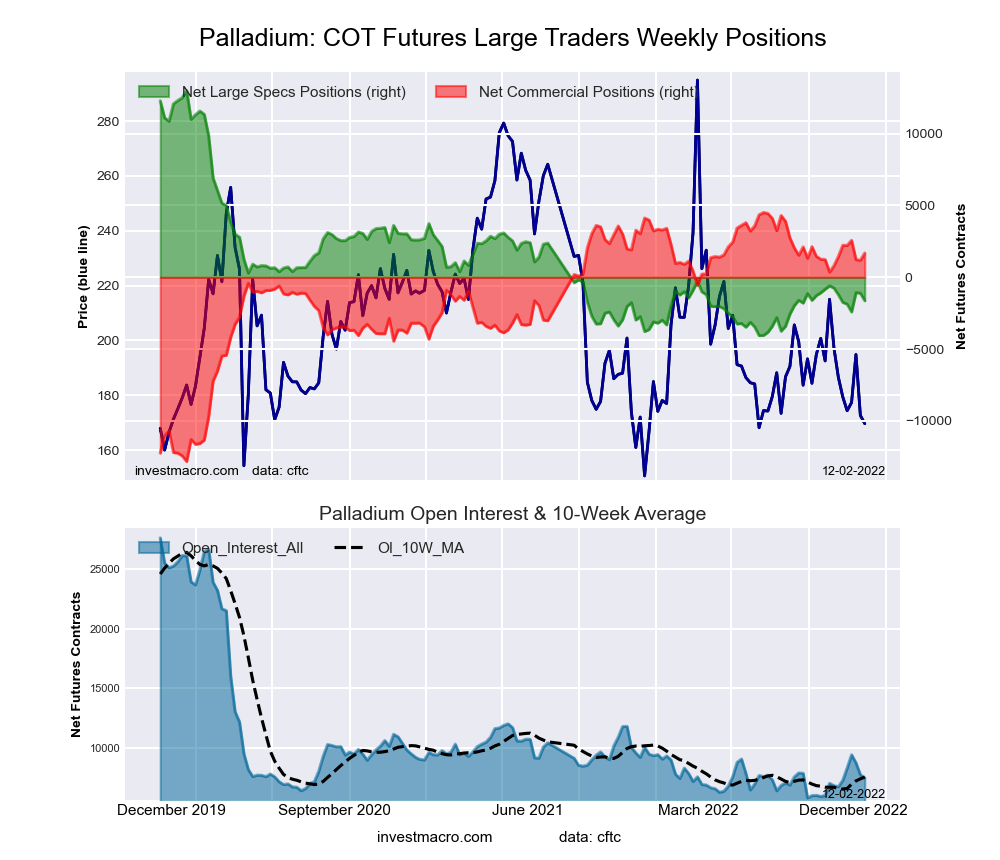
Silver went out with a US$0.57/ounce gain on a day where all other white metals (palladium, platinum) lost 2.48% and 2.80%, respectively. Copper also had not only a decent day; it had a decent week giving me great confidence in the outlook for 2023 for all these metals AND for the junior wannabes that are either searching for or developing them.
Today’s resiliency for all markets in the face of a hostile jobs report and in the face of overbought market conditions reeks of too many portfolio managers (not yet born when the market crashed in ’87) underweight equities and panicking to get back into “fully-invested” mode.
If this trend accelerates, there might be an EPIC short squeeze into year-end that could rival the one that nailed those fuzzy-cheeked whiz kids back in April of 2020 when they were certain that the global pandemic was going to throw us into the 1930s again, which was EXACTLY what I was told by one of the kiddies in 2008 after junior stocks all crashed.
It never happened then, and it won’t happen now as the BIG MONEY wants a rally, and that is all one needs to know.
End of story.
Michael Ballanger Disclaimer:
This letter makes no guarantee or warranty on the accuracy or completeness of the data provided. Nothing contained herein is intended or shall be deemed to be investment advice, implied or otherwise. This letter represents my views and replicates trades that I am making but nothing more than that. Always consult your registered advisor to assist you with your investments. I accept no liability for any loss arising from the use of the data contained on this letter. Options and junior mining stocks contain a high level of risk that may result in the loss of part or all invested capital and therefore are suitable for experienced and professional investors and traders only. One should be familiar with the risks involved in junior mining and options trading and we recommend consulting a financial adviser if you feel you do not understand the risks involved.
Disclosures:
1) Statements and opinions expressed are the opinions of Michael Ballanger and not of Streetwise Reports or its officers. Michael Ballanger is wholly responsible for the validity of the statements. Streetwise Reports was not involved in any aspect of the article preparation. Michael Ballanger was not paid by Streetwise Reports LLC for this article. Streetwise Reports was not paid by the author to publish or syndicate this article.
2) The following companies mentioned in this article are billboard sponsors of Streetwise Reports: None. Click here for important disclosures about sponsor fees. The information provided above is for informational purposes only and is not a recommendation to buy or sell any security.
3) This article does not constitute investment advice. Each reader is encouraged to consult with his or her individual financial professional and any action a reader takes as a result of information presented here is his or her own responsibility. By opening this page, each reader accepts and agrees to Streetwise Reports’ terms of use and full legal disclaimer. This article is not a solicitation for investment. Streetwise Reports does not render general or specific investment advice and the information on Streetwise Reports should not be considered a recommendation to buy or sell any security. Streetwise Reports does not endorse or recommend the business, products, services or securities of any company mentioned on Streetwise Reports.
4) From time to time, Streetwise Reports LLC and its directors, officers, employees or members of their families, as well as persons interviewed for articles and interviews on the site, may have a long or short position in securities mentioned. Directors, officers, employees or members of their immediate families are prohibited from making purchases and/or sales of those securities in the open market or otherwise from the time of the decision to publish an article until three business days after the publication of the article. The foregoing prohibition does not apply to articles that in substance only restate previously published company releases.


