
Source: Streetwise Reports (12/7/22)
Canadian-based Skyharbour Resources has announced it plans to complete a 10,000m drill program at its Russell Lake property. It has also recently received US$895 million from the exercise of share purchase warrants. Read here to learn more about the project and where the company is headed for 2023.
Skyharbour Resources Ltd. (SYH:TSX.V; SYHBF:OTCQX; SC1P:FSE) is a Canadian-based exploration company. The company is focused on acquiring and advancing uranium exploration projects in Canada’s Athabasca Basin.
Why Uranium?
Uranium is an element that is mainly used to provide nuclear energy. Because of its radioactive properties, it can manufacture a tremendous amount of emissions-free energy. It is also considered more reliable than other emissions-free energy sources such as wind and solar. The outlook around the nuclear and uranium mining industries has changed significantly over the past several years and continues to improve.
While uranium has taken a dip in the past, recent news has led to its rise with the worldwide push to green energy, inflated energy costs, and the war in Ukraine. This August, Japan’s prime minister announced they would restart more idled nuclear plants and look at developing next-generation reactors. At this announcement, Forbes reported, “The Global X Uranium ETF surged 11.5%.”
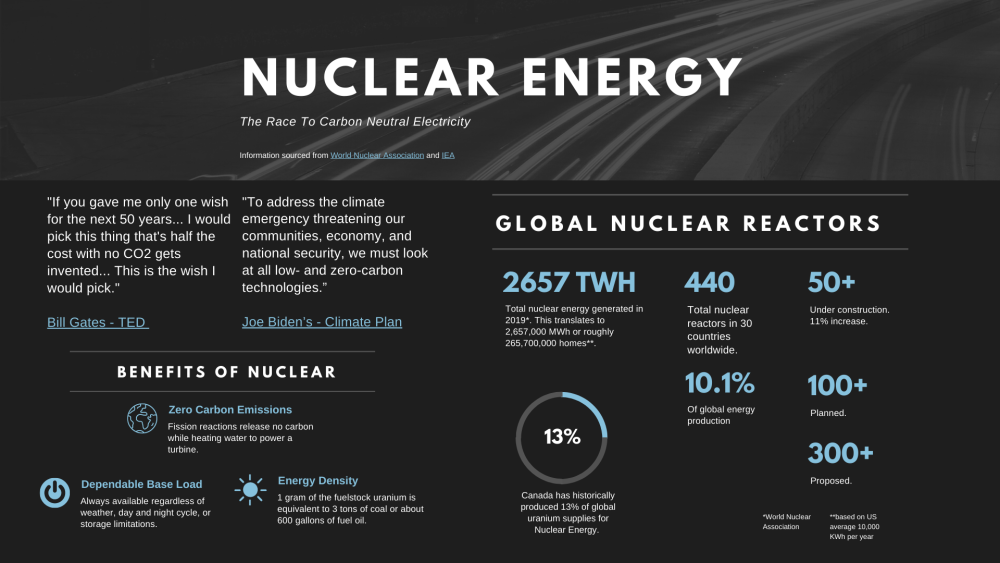
The United States also has leaned into green energy. Currently, 20% of the electricity and 50% of the clean energy in the United States is nuclear, and this number seems to be on a path to only getting bigger.
On July 5, 2022, The New York Times reported that “the Biden administration has established a US$6 billion fund to help troubled nuclear plant operators keep their reactors running and make them more economically competitive against cheaper resources like solar and wind power.” The administration also is alluding US$2.5 million to fund two projects intended to showcase new nuclear technology.
Rajeev identified “the ongoing/planned exploration programs by Skyharbour and its partners” as major catalysts toward the company’s impending growth” and said that “as a result, Fundamental Research maintains its Buy recommendations for Skyharbour.”
This October 2022, the Biden administration also announced they would be providing US$150 million to improve nuclear research and development infrastructure at Idaho National Laboratory as a part of President Biden’s Inflation Reduction Act.
U.S. Secretary of Energy Jennifer M. Granholm commented that the Department of Energy “is taking critical steps to strengthen domestic nuclear development and deployment — helping ensure the United States is on track to reach a clean energy future.”
This, of course, leads to more uranium demand, or as Forbes said, “with many major nations rethinking their approach to clean, affordable energy, nuclear power plants are an obvious option. That’s good news for uranium investors, as more nuclear power means more demand for the radioactive metal.”
Skyharbour’s Plethora of Projects
Skyharbour Resources has been active in the Athabasca Basin since 2013 and has a myriad of projects, including Moore, Russell Lake, South Falcon Point, South Falcon East, Preston, East Preston, Hook Lake, Mann Lake, Yurchison, Riou River, Pluto Bay, Wallee, Usam Island, Foster River, West Dufferin, and South Dufferin.
Management noted that “Skyharbour holds an extensive portfolio of uranium exploration projects in Canada’s Athabasca basin and is well positioned to benefit from improving uranium market fundamentals with 15 projects, 10 of which are drill ready, covering over 450,000 hectares of land.”
Skyharbour estimates that over 30,000 meters of exploratory drilling will take place between all of its Athabasca Basin projects — including its two core assets and its multiple partner-funded projects — over the course of the next year. The company plans to dedicate a third of this work toward its flagship projects in Russell Lake and Moore Lake and is fully funded to conduct this work.
Catalyst: Plans to Break Ground at Russell Lake
Rio Tinto Plc. (RIO:NYSE; RIO:ASX; RIO:LSE; RTPPF:OTCPK), whose asset focus lies primarily in iron and copper, temporarily shelved the Russell Lake project. Rio has since optioned the project to Skyharbour, which plans to engage in advanced-stage exploration by drill testing “a number of the prospective targets [that] weren’t fully and systematically drill tested,” according to CEO Jordan Trimble. It wasn’t until a recent “resurgence in uranium and the nuclear industry” Trimble suggested that the industrial metals giant was willing to option the project to Skyharbour.
In resuming operations on the Russell Lake project, Skyharbour assumes the 40-person exploration camp previously used by Rio. Trimble believes that the inheritance and use of this asset for staging purposes “will bring [its] drill costs down quite a bit, not just at Russell Lake, but also at the adjacent Moore Lake Project.”
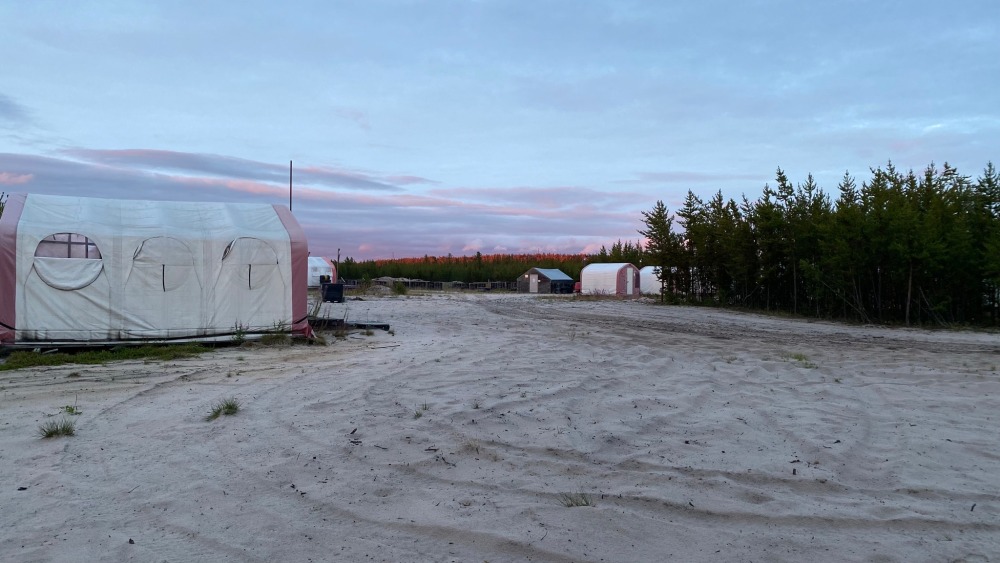
On November 23, the company announced it will carry out multiple phases of diamond drilling totaling 10,000 meters at Russell Lake. It plans on breaking ground sometime within the next month.
This minimum 10,000-meter exploration program will be carried out concurrently with Skyharbour’s multiple partner-funded uranium-drilling program at some of its other projects in the Athabasca Basin.
Analyst Sid Rajeev of Fundamental Research noted that Russell Lake “is strategically located between Cameco’s Key Lake mill and MacArthur uranium mine,” such that Skyharbour has a direct and rapid processing line between “the world’s largest uranium mill and the largest high-grade uranium mine.”
Catalyst: 2022 Drilling Complete at Mann Lake
At the end of last month, the company announced its partner company Basin Uranium Corp. had completed drilling at Mann Lake for 2022. 6,279 meters were drilled. Core samples have been submitted for analysis to the Saskatchewan Research Council (SRC).
As they hold steady for the assay results, Skyharbour’s partner company Basin Uranium plans to continue its exploration programs at it Mann Lake project in the Athabasca Basin in 2023.
Rajeev identified “the ongoing/planned exploration programs by Skyharbour and its partners” as major catalysts toward the company’s impending growth” and said that “as a result, Fundamental Research maintains its Buy recommendations for Skyharbour.”
Catalyst: Skyharbour Receives US$895 Million
Friday, Skyharbour announced it had received US$895,027.32 from the exercise of share purchase warrants with a strike price of US$0.22 since June 29, 2022. 4,068,306 of the warrants have been exercised, with this batch of warrants expiring on Nov. 29, 2022.
Furthermore, the company noted that “collectively, Skyharbour has now signed option agreements with partners that total over US$34 million in partner-financed exploration expenditures, over US$22 million in stock being issued and just under US$15 million in cash payments coming into Skyharbour, assuming that these partner companies earn in the full amounts at their respective projects.”
Ownership and Share Structure
Skyharbour’s management owns approx. 5% of the company’s 145 million marketable shares. CEO Trimble owns 2.514 million shares of Skyharbour, maintaining a 1.73% stake. Director David Cates’ 1.247 million shares constitute an additional 0.86% management stake. Mr. Cates is the President and CEO of Denison Mines, a larger uranium developer that is a strategic partner and shareholder of Skyharbour Resources.
Aside from the aforementioned Denison and Rio Tinto, notable strategic and institutional investors in the company’s growth include the Global X and Sprott Uranium ETFs, Extract Capital, L2, Sachem Cove, and Sprott Capital Partners.
It is also worth noting that Skyharbour maintains a minority equity stake in several of its other option and joint-venture partner companies. Skyharbour has signed option agreements over the last several years with partners that total approx. CA$22 million worth of shares being issued between Azincourt Energy, Valor Resources, Basin Uranium, Medaro Mining, Yellow Rocks Energy, and Tisdale Clean Energy — the companies behind Skyharbour’s partnerships in East Preston, Hook Lake, Mann Lake, Yurchison, Wallee/Usam, and South Falcon East respectively.
The company’s burn rate is US$110,000. It has over US$6M in the treasury, with another approximately US$2.5 million expected to come in from option partner payments and shares in the next 12 months.
Skyharbour has a market cap of US$39 million and 144.99 million outstanding shares. It has 138.45 million shares in the public float and trades in the 52-week range at between US$0.2223 and US$0.6558 per share.
Disclosures:
1) Katherine DeGilio and Thomas Griffin wrote this article for Streetwise Reports LLC, and Thomas Griffin provides services to Streetwise Reports as an independent contractor. They or members of their household own securities of the following companies mentioned in the article: None. They or members of their household are paid by the following companies mentioned in this article: None.
2) The following companies mentioned in this article are billboard sponsors of Streetwise Reports: Skyharbour Resources Ltd. Click here for important disclosures about sponsor fees. As of the date of this article, an affiliate of Streetwise Reports has a consulting relationship with: None. Please click here for more information.
3) Statements and opinions expressed are the opinions of the author and not of Streetwise Reports or its officers. The author is wholly responsible for the validity of the statements. The author was not paid by Streetwise Reports for this article. Streetwise Reports was not paid by the author to publish or syndicate this article. Streetwise Reports requires contributing authors to disclose any shareholdings in, or economic relationships with, companies that they write about. Streetwise Reports relies upon the authors to accurately provide this information and Streetwise Reports has no means of verifying its accuracy.
4) This article does not constitute investment advice. Each reader is encouraged to consult with his or her individual financial professional and any action a reader takes as a result of information presented here is his or her own responsibility. By opening this page, each reader accepts and agrees to Streetwise Reports’ terms of use and full legal disclaimer. This article is not a solicitation for investment. Streetwise Reports does not render general or specific investment advice and the information on Streetwise Reports should not be considered a recommendation to buy or sell any security. Streetwise Reports does not endorse or recommend the business, products, services or securities of any company mentioned on Streetwise Reports.
5) From time to time, Streetwise Reports LLC and its directors, officers, employees or members of their families, as well as persons interviewed for articles and interviews on the site, may have a long or short position in securities mentioned. Directors, officers, employees or members of their immediate families are prohibited from making purchases and/or sales of those securities in the open market or otherwise from the time of the decision to publish an article until three business days after the publication of the article. The foregoing prohibition does not apply to articles that in substance only restate previously published company releases. As of the date of this article, officers and/or employees of Streetwise Reports LLC (including members of their household) own securities of Skyharbour Resources Ltd., a company mentioned in this article.


 Graphene has many incredible physical properties that arise from its one-atom-thick carbon structure.


