Are criminals rational? In his groundbreaking work of 1968, Gary Becker argued that they are. The American economist, who would go on to win the Nobel prize in economics in 1992, theorised that individuals engage in crime only if the returns are greater than the returns from engaging in legal activities, after you factor in the risk of being caught.
This has been largely supported by empirical evidence. But one aspect of Becker’s model which has proven difficult to confirm is whether criminal activity is sensitive to changes in the financial returns from crime. This is mostly because those returns are themselves affected by criminal activity.
For example, when more phones are stolen, the supply of stolen phones increases and their retail value drops, which makes them less attractive to steal. Since the price affects the burglaries as well as the burglaries affecting the price, it can be difficult for researchers to empirically assess the extent to which each is affecting the other.
One way around this problem is to look at a commodity whose price won’t be affected by how much is stolen by criminals. We chose gold. The question our research asked was: how does the gold price affect the rate of burglary in England and Wales?
The burglary business
Jewellery is only stolen in 7% of burglaries. This is according to the Crime Survey for England and Wales (CSEW), which also says that these types of burglaries are perceived as more serious by the victims than other types. No doubt this is partially because of the sentimental value associated with some of the jewellery, but also because of its financial value.
Anecdotal evidence, supported by the CSEW, suggests that south Asian households are more likely to store gold jewellery, in some cases as a way of saving, though also for cultural reasons. This means that when the price of gold goes up, the returns from burgling a south Asian household will go up too. You might therefore expect the rational burglar to disproportionately target these households when the gold price is higher.
It might not be easy for these burglars to recognise a house as belonging to a south Asian family, but they will know which neighbourhoods tend to be popular with this ethnic group. So we should expect that when the price of gold goes up, burglars may become more active in neighbourhoods with a greater share of south Asian families.
Using detailed crime data at the neighbourhood level for the period 2011-19, we tested this hypothesis by comparing burglary rates in neighbourhoods with a relatively high share of south Asian households and neighbourhoods with a lower share. To make the comparison more pertinent, we only compared neighbourhoods within the same local authority, contrasting periods in which the gold price was low to when it was high.
What we consistently found was that burglaries increase when the price of gold surges. A 10% increase in the price of gold increases the burglary rate by an average of 1.5%. In south Asian neighbourhoods, however, burglaries increase by 3.4%.
The wider economy
You might be thinking that burglars aren’t responding to the gold price but to economic conditions more generally, but this is an unlikely explanation. There certainly is a link between burglary rates and economic conditions. For example, when unemployment rises, there are more burglaries everywhere.
But by comparing neighbourhoods within the same local authority, we found it was only neighbourhoods with a higher share of Asian households that saw a larger increase in the rate of burglaries when the price of gold increased. We also found that the location of other crimes was unaffected by variations in the gold price.
In any case, gold and the economy are not especially well correlated. The price of gold is determined by global supply and demand rather than economic conditions in the UK.
Finally, we showed that variations in the price of gold drive up the burglary rate in general. So it’s not just a case of burglars relocating their activities to neighbourhoods with a higher share of south Asian households. When gold is more valuable there are more burglaries, and disproportionately more in south Asian neighbourhoods.
Our results seem to confirm that burglars act rationally and redirect their efforts towards neighbourhoods with higher returns when the reward is greater. If police forces allocate more resources to visible police patrols in areas rich in potential targets when the price of gold or some other valuable commodity is high, it may prove a successful deterrent. Additionally, it might be helpful to introduce policies making it more difficult to resell jewellery.
To end on a positive, the gold price is around 20% down from the highs of the past couple of years. So long as that continues, the temptation to burglars should at least be slightly less than it was before.
Here are the latest charts and statistics for the Commitment of Traders (COT) data published by the Commodities Futures Trading Commission (CFTC).
The latest COT data is updated through Tuesday November 1st and shows a quick view of how large traders (for-profit speculators and commercial entities) were positioned in the futures markets.
Copper & Platinum lead Weekly Speculator Changes
The COTprecious metals speculator bets were slightly higher this week as three out of the five metals markets we cover had higher positioning this week while two markets had lower contracts.
Leading the gains for the precious metals markets was Copper (9,435 contracts) with Platinum (4,606 contracts) and Silver (1,625 contracts) also showing a positive week.
The metals markets leading the declines in speculator bets this week was Gold (-3,409 contracts) with Palladium (-122 contracts) also registering lower bets on the week.
Highlighting the COT metals data this week is the improvement in the Copper speculators positioning over the past few months. The large speculators raised their Copper bets for the second straight week this week and for the fourth time out of the past five weeks. Copper spec positions have been in an overall bearish standing since April (currently in a 28-week streak of bearish contracts) with the lowest level of -31,796 contracts coming in July. However, the bearish bets have been lightening up of late and this week’s total of -7,484 contracts marks the least bearish level of the past twenty-one weeks, dating back to June 7th.
Data Snapshot of Commodity Market Traders | Columns Legend
Nov-01-2022
OI
OI-Index
Spec-Net
Spec-Index
Com-Net
COM-Index
Smalls-Net
Smalls-Index
WTI Crude
1,459,052
2
254,809
12
-275,761
90
20,952
35
Gold
467,276
10
64,623
4
-74,782
96
10,159
5
Silver
138,875
12
1,524
16
-10,363
85
8,839
13
Copper
179,801
18
-7,484
30
7,998
73
-514
22
Palladium
8,372
12
-1,867
13
2,221
87
-354
20
Platinum
56,534
16
15,987
31
-19,690
71
3,703
18
Natural Gas
986,116
7
-148,653
34
127,501
71
21,152
30
Brent
134,010
0
-21,908
74
17,423
22
4,485
70
Heating Oil
268,025
23
21,380
74
-41,295
27
19,915
67
Soybeans
584,073
2
86,522
40
-57,886
69
-28,636
23
Corn
1,472,517
29
340,788
74
-286,790
31
-53,998
12
Coffee
217,400
25
2,183
12
-4,162
93
1,979
27
Sugar
737,846
9
69,093
46
-90,576
56
21,483
34
Wheat
333,061
20
-15,766
0
22,493
92
-6,727
75
Strength Scores led by Copper & Platinum
Strength scores (a measure of the 3-Year range of Speculator positions, from 0 to 100 where above 80 is extreme bullish and below 20 is extreme bearish) showed that Platinum (30.6 percent) and Copper (30.4 percent) lead the metals category.
On the downside, Gold (4.2 percent) continues to be at the lowest strength level currently and is followed by Palladium (12.8 percent) and Silver (15.8 percent). All three of these markets remain in a bearish extreme position with scores below 20 percent.
Strength Statistics: Gold (4.2 percent) vs Gold previous week (5.3 percent) Silver (15.8 percent) vs Silver previous week (14.0 percent) Copper (30.4 percent) vs Copper previous week (22.9 percent) Platinum (30.6 percent) vs Platinum previous week (24.4 percent) Palladium (12.8 percent) vs Palladium previous week (13.6 percent)
Strength Trends topped by Platinum
Strength Score Trends (or move index, calculates the 6-week changes in strength scores) show that Platinum (18.3 percent) leads the past six weeks trends for metals this week. Copper (10.2 percent) and Silver (3.5 percent) fill out the other positive movers in the latest trends data.
Palladium (-4.6 percent) leads the downside trend scores currently while the next market with lower trend scores was Gold (-0.4 percent).
Move Statistics: Gold (-0.4 percent) vs Gold previous week (-9.7 percent) Silver (3.5 percent) vs Silver previous week (5.0 percent) Copper (10.2 percent) vs Copper previous week (1.6 percent) Platinum (18.3 percent) vs Platinum previous week (17.8 percent) Palladium (-4.6 percent) vs Palladium previous week (-2.8 percent)
Individual Markets:
Gold Comex Futures:
The Gold Comex Futures large speculator standing this week equaled a net position of 64,623 contracts in the data reported through Tuesday. This was a weekly reduction of -3,409 contracts from the previous week which had a total of 68,032 net contracts.
This week’s current strength score (the trader positioning range over the past three years, measured from 0 to 100) shows the speculators are currently Bearish-Extreme with a score of 4.2 percent. The commercials are Bullish-Extreme with a score of 96.1 percent and the small traders (not shown in chart) are Bearish-Extreme with a score of 5.0 percent.
Gold Futures Statistics
SPECULATORS
COMMERCIALS
SMALL TRADERS
– Percent of Open Interest Longs:
46.3
26.9
8.3
– Percent of Open Interest Shorts:
32.5
42.9
6.1
– Net Position:
64,623
-74,782
10,159
– Gross Longs:
216,341
125,689
38,559
– Gross Shorts:
151,718
200,471
28,400
– Long to Short Ratio:
1.4 to 1
0.6 to 1
1.4 to 1
NET POSITION TREND:
– Strength Index Score (3 Year Range Pct):
4.2
96.1
5.0
– Strength Index Reading (3 Year Range):
Bearish-Extreme
Bullish-Extreme
Bearish-Extreme
NET POSITION MOVEMENT INDEX:
– 6-Week Change in Strength Index:
-0.4
0.2
1.1
Silver Comex Futures:
The Silver Comex Futures large speculator standing this week equaled a net position of 1,524 contracts in the data reported through Tuesday. This was a weekly boost of 1,625 contracts from the previous week which had a total of -101 net contracts.
This week’s current strength score (the trader positioning range over the past three years, measured from 0 to 100) shows the speculators are currently Bearish-Extreme with a score of 15.8 percent. The commercials are Bullish-Extreme with a score of 85.4 percent and the small traders (not shown in chart) are Bearish-Extreme with a score of 13.1 percent.
Silver Futures Statistics
SPECULATORS
COMMERCIALS
SMALL TRADERS
– Percent of Open Interest Longs:
36.9
37.3
15.9
– Percent of Open Interest Shorts:
35.8
44.8
9.5
– Net Position:
1,524
-10,363
8,839
– Gross Longs:
51,286
51,802
22,076
– Gross Shorts:
49,762
62,165
13,237
– Long to Short Ratio:
1.0 to 1
0.8 to 1
1.7 to 1
NET POSITION TREND:
– Strength Index Score (3 Year Range Pct):
15.8
85.4
13.1
– Strength Index Reading (3 Year Range):
Bearish-Extreme
Bullish-Extreme
Bearish-Extreme
NET POSITION MOVEMENT INDEX:
– 6-Week Change in Strength Index:
3.5
-4.5
7.5
Copper Grade #1 Futures:
The Copper Grade #1 Futures large speculator standing this week equaled a net position of -7,484 contracts in the data reported through Tuesday. This was a weekly lift of 9,435 contracts from the previous week which had a total of -16,919 net contracts.
This week’s current strength score (the trader positioning range over the past three years, measured from 0 to 100) shows the speculators are currently Bearish with a score of 30.4 percent. The commercials are Bullish with a score of 73.2 percent and the small traders (not shown in chart) are Bearish with a score of 22.3 percent.
Copper Futures Statistics
SPECULATORS
COMMERCIALS
SMALL TRADERS
– Percent of Open Interest Longs:
28.2
42.5
7.8
– Percent of Open Interest Shorts:
32.4
38.0
8.1
– Net Position:
-7,484
7,998
-514
– Gross Longs:
50,738
76,394
14,103
– Gross Shorts:
58,222
68,396
14,617
– Long to Short Ratio:
0.9 to 1
1.1 to 1
1.0 to 1
NET POSITION TREND:
– Strength Index Score (3 Year Range Pct):
30.4
73.2
22.3
– Strength Index Reading (3 Year Range):
Bearish
Bullish
Bearish
NET POSITION MOVEMENT INDEX:
– 6-Week Change in Strength Index:
10.2
-11.8
14.0
Platinum Futures:
The Platinum Futures large speculator standing this week equaled a net position of 15,987 contracts in the data reported through Tuesday. This was a weekly gain of 4,606 contracts from the previous week which had a total of 11,381 net contracts.
This week’s current strength score (the trader positioning range over the past three years, measured from 0 to 100) shows the speculators are currently Bearish with a score of 30.6 percent. The commercials are Bullish with a score of 71.2 percent and the small traders (not shown in chart) are Bearish-Extreme with a score of 17.8 percent.
Platinum Futures Statistics
SPECULATORS
COMMERCIALS
SMALL TRADERS
– Percent of Open Interest Longs:
50.6
31.9
12.7
– Percent of Open Interest Shorts:
22.3
66.7
6.1
– Net Position:
15,987
-19,690
3,703
– Gross Longs:
28,611
18,041
7,159
– Gross Shorts:
12,624
37,731
3,456
– Long to Short Ratio:
2.3 to 1
0.5 to 1
2.1 to 1
NET POSITION TREND:
– Strength Index Score (3 Year Range Pct):
30.6
71.2
17.8
– Strength Index Reading (3 Year Range):
Bearish
Bullish
Bearish-Extreme
NET POSITION MOVEMENT INDEX:
– 6-Week Change in Strength Index:
18.3
-17.9
7.9
Palladium Futures:
The Palladium Futures large speculator standing this week equaled a net position of -1,867 contracts in the data reported through Tuesday. This was a weekly decline of -122 contracts from the previous week which had a total of -1,745 net contracts.
This week’s current strength score (the trader positioning range over the past three years, measured from 0 to 100) shows the speculators are currently Bearish-Extreme with a score of 12.8 percent. The commercials are Bullish-Extreme with a score of 86.8 percent and the small traders (not shown in chart) are Bearish with a score of 20.4 percent.
Palladium Futures Statistics
SPECULATORS
COMMERCIALS
SMALL TRADERS
– Percent of Open Interest Longs:
22.8
54.1
13.6
– Percent of Open Interest Shorts:
45.1
27.6
17.9
– Net Position:
-1,867
2,221
-354
– Gross Longs:
1,906
4,532
1,141
– Gross Shorts:
3,773
2,311
1,495
– Long to Short Ratio:
0.5 to 1
2.0 to 1
0.8 to 1
NET POSITION TREND:
– Strength Index Score (3 Year Range Pct):
12.8
86.8
20.4
– Strength Index Reading (3 Year Range):
Bearish-Extreme
Bullish-Extreme
Bearish
NET POSITION MOVEMENT INDEX:
– 6-Week Change in Strength Index:
-4.6
5.5
-10.5
Article By InvestMacro – Receive our weekly COT Newsletter
*COT Report: The COT data, released weekly to the public each Friday, is updated through the most recent Tuesday (data is 3 days old) and shows a quick view of how large speculators or non-commercials (for-profit traders) were positioned in the futures markets.
The CFTC categorizes trader positions according to commercial hedgers (traders who use futures contracts for hedging as part of the business), non-commercials (large traders who speculate to realize trading profits) and nonreportable traders (usually small traders/speculators) as well as their open interest (contracts open in the market at time of reporting). See CFTC criteria here.
With the possibility of a Fed pivot looming, expert Clive Maund touches on his views of the precious metals sector and why he believes you should invest in it sooner rather than later.
On the 1-year chart for gold shown below, we can see precisely why it has been in a quite severe downtrend from its peak last March. It is because the dollar and interest rates, shown at the top and bottom of the chart, have been in strong uptrends during this period.
A very important point to note is that while gold has dropped about $400 from its March peak, in real terms, this decline is much more serious because of the robust inflation during this period.
So if the Fed does pivot soon, that is to say, it stops raising rates and starts lowering them, or other Central Banks start raising rates, thus reducing the dollar’s appeal.
It will mean a reversal to the downside in the dollar and to the upside in gold and commodities and risk-on assets generally, and as we saw on Friday 21st, even talk of a pivot is enough to generate a recovery.
Gold
A very important point to note is that while gold has dropped about $400 from its March peak, in real terms, this decline is much more serious because of the robust inflation during this period.
So when you talk about $1600 gold now, it means that in, say, 2019 prices, it’s probably about $1200. This gives us more of an idea about how undervalued gold and especially silver are now. Before leaving this chart, observe that gold may be making a Double Bottom here with its September lows.
The next chart, the 1-year chart for PM sector proxy GDX, is most interesting as it makes plain that, even on a log chart as this is, the downtrend in the sector from its April highs has been decelerating steadily to the point that the MACD indicator has recovered back almost to the zero line.
If this interpretation is correct, then we are at a point of huge opportunity to buy the sector before it breaks out.
This is the sort of behavior that usually precedes a reversal to the upside, so it is not surprising to see that a small Head-and-Shoulders appears to be completed within the downtrend channel, whose validity is endorsed by the bullish volume pattern that has accompanied it, with strong volume on the rise to form the right side of the Head of the pattern and again on the rise late last week as it completes what is believed to be the Right Shoulder of the pattern.
If this interpretation is correct, then we are at a point of huge opportunity to buy the sector before it breaks out.
In the context of the foregoing, it’s useful for us to consider the extent to which the PM sector has markedly underperformed even the frail stock market in recent months.
Silver is regarded as probably the most undervalued asset in the world.
On the 1-year chart for GDX over the S&P500 index, we can see that it has seriously underperformed due, of course, to the strong rise in the dollar and interest rates.
This is important because it means that the PM sector is even better value here compared to the broad market.
Alright, so if we are at or close to a bottom in gold and the PM sector, then we would expect to see the normally wrong Large Specs having Little interest in gold, and that is exactly what we see on the latest COT chart for gold, which shows that they have pretty much given up on it.
This COT chart alone augurs well for a new bull market phase in gold . . .
Silver
What about silver?
On its 1-year chart, we can see that it has dropped back from its March highs for the same reasons that gold has, the strong uptrends in the dollar, and interest rates.
This is looking like a great place to load up on the better gold and silver stocks.
However, since July, a potential base pattern has been building out that is now starting to look like a completing Triple Bottom, and with the steadily uptrending momentum (MACD) now about to swing positive, the outlook is brightening and the strong volume on the rally out of the low in the middle of the month, better seen on a 6-month chart, looks like the beginnings of a rally up towards the resistance at the upper boundary of the pattern.
Silver is regarded as probably the most undervalued asset in the world, and in the dark times that we are headed towards, physical silver is probably the best asset to have in your possession, along with some firearms to make sure that it stays in your possession.
If silver is close to an optimum point to buy, then we would expect to see the dumb Large Specs having no interest in it all, and that is exactly what we see on silver’s latest COT chart, which shows the Large Specs net long positions to be virtually non-existent . . .
It’s useful here to take a quick look at the 5-year chart for the dollar index because, on this chart, we see that it has gone parabolic in recent months, and it’s possible that it just topped out.
Two possible reasons for it to turn and break down that have already been mentioned are a “Fed pivot” and other countries or trading blocs, such as the European Union, following the Fed’s lead and raising rates too.
The U.S. Dollar and British Pound
Just for laughs, let’s take a quick look at the 5-year chart for the British Pound.
It shows that it has been terribly weak, dropping an incredible 40% in less than 18 months . . .
For U.S. readers who’ve always wanted to see the sights in Britain, and have the time and money, now is a good time to vacation there while the exchange rate is good before the Winter.
If you want ideas on what to visit, I can give you a list as long as your arm.
The Risk of a Market Crash
Finally, what about the ongoing risk of an all-out market crash? Would that not drag gold and silver, and PM stocks down even further?
Well, it could, although it may not because, this time, there will be no hiding place for investors in the Treasury market, which is already on the rocks.
So with this option closed off, funk money will probably flee into gold and silver instead. This time round is very different in that the powers that be fully intend to destroy the world economy kill off most of the population, and turn the survivors into cyborg-like slaves, and have made their intentions very clear to anyone with more than a few functioning brain cells.
This would best be achieved by a state of hyperinflation, Venezuela style, that would render the population destitute and totally at the mercy of the State (except for some preppers, who will probably be identified and rounded up anyway).
Following this logic, they will continue to create money to defer the debt market collapse for as long as possible, and the hyperinflation that will result, which we are already close to, must mean an exponential rise in the price of hard assets like gold and silver, with physical being very highly prized and hard to obtain.
The charts that we have reviewed in this update strongly suggest that, whatever the broad market does from here, the PM sector has bottomed out and is going to rally soon. An important article posted by Adam Hamilton a couple of days ago, Gold Stocks’ Winter Rally 7, strongly supports this contention.
Although long, this common sense article presents reasoned arguments based on his many years of experience with this sector and should thus be taken seriously.
Conclusion — This is looking like a great place to load up on the better gold and silver stocks.
CliveMaund.com Disclosures
The above represents the opinion and analysis of Mr. Maund, based on data available to him, at the time of writing. Mr. Maund’s opinions are his own, and are not a recommendation or an offer to buy or sell securities. Mr. Maund is an independent analyst who receives no compensation of any kind from any groups, individuals or corporations mentioned in his reports. As trading and investing in any financial markets may involve serious risk of loss, Mr. Maund recommends that you consult with a qualified investment advisor, one licensed by appropriate regulatory agencies in your legal jurisdiction and do your own due diligence and research when making any kind of a transaction with financial ramifications. Although a qualified and experienced stock market analyst, Clive Maund is not a Registered Securities Advisor. Therefore Mr. Maund’s opinions on the market and stocks can only be construed as a solicitation to buy and sell securities when they are subject to the prior approval and endorsement of a Registered Securities Advisor operating in accordance with the appropriate regulations in your area of jurisdiction.
Disclosures: 1) Statements and opinions expressed are the opinions of Clive Maund and not of Streetwise Reports or its officers. The author is wholly responsible for the validity of the statements. Streetwise Reports was not involved in any aspect of the article preparation. The author was not paid by Streetwise Reports LLC for this article. Streetwise Reports was not paid by the author to publish or syndicate this article.
2) This article does not constitute investment advice. Each reader is encouraged to consult with his or her individual financial professional and any action a reader takes as a result of information presented here is his or her own responsibility. By opening this page, each reader accepts and agrees to Streetwise Reports’ terms of use and full legal disclaimer. This article is not a solicitation for investment. Streetwise Reports does not render general or specific investment advice and the information on Streetwise Reports should not be considered a recommendation to buy or sell any security. Streetwise Reports does not endorse or recommend the business, products, services or securities of any company mentioned on Streetwise Reports.
3) From time to time, Streetwise Reports LLC and its directors, officers, employees or members of their families, as well as persons interviewed for articles and interviews on the site, may have a long or short position in securities mentioned. Directors, officers, employees or members of their immediate families are prohibited from making purchases and/or sales of those securities in the open market or otherwise from the time of the decision to publish an article until three business days after the publication of the article. The foregoing prohibition does not apply to articles that in substance only restate previously published company releases.
Here are the latest charts and statistics for the Commitment of Traders (COT) data published by the Commodities Futures Trading Commission (CFTC).
The latest COT data is updated through Tuesday October 25th and shows a quick view of how large traders (for-profit speculators and commercial entities) were positioned in the futures markets.
Copper and Platinum lead Weekly Speculator Changes
The COTprecious metals speculator bets were lower this week as two out of the five metals markets we cover had higher positioning this week while three markets had lower contracts.
Leading the gains for the precious metals markets was Copper (3,383 contracts) with Platinum (2,887 contracts) also showing a positive week.
The metals markets leading the declines in speculator bets this week was Gold (-8,924 contracts) with Silver (-1,368 contracts) and Palladium (-536 contracts) also registering lower bets on the week.
Highlighting the COT metals data this week is the decline in the speculators positions for Silver. The large speculators dropped their Silver bets for the third straight week following gains in the previous four weeks. This has brought the overall net position back into a small bearish standing this week (-101 contracts) for the first time in the past five weeks. Previously, the Silver net positioning had spent five weeks from August 23rd to September 20th in bearish territory before seeing speculator positions improve and regain their bullishness on September 27th.
The Silver price, like the other precious metals, remains under pressure and saw a small decline this week. The futures price trades around the $19.15 level and has been in a range between $18 and $20 over the past three weeks.
Data Snapshot of Commodity Market Traders | Columns Legend
Oct-25-2022
OI
OI-Index
Spec-Net
Spec-Index
Com-Net
COM-Index
Smalls-Net
Smalls-Index
WTI Crude
1,436,942
0
249,079
10
-268,026
92
18,947
32
Gold
456,072
7
68,032
5
-80,213
94
12,181
10
Silver
139,085
12
-101
14
-8,857
87
8,958
14
Copper
179,344
17
-16,919
23
15,907
79
1,012
31
Palladium
7,343
7
-1,745
14
2,228
87
-483
13
Platinum
56,117
15
11,381
24
-14,971
77
3,590
16
Natural Gas
970,872
5
-151,766
33
133,397
73
18,369
24
Brent
166,931
14
-40,301
44
36,912
55
3,389
55
Heating Oil
272,663
25
20,411
72
-38,238
31
17,827
60
Soybeans
651,685
17
57,385
31
-35,301
76
-22,084
34
Corn
1,445,842
25
329,784
72
-273,645
33
-56,139
11
Coffee
208,280
18
11,351
37
-13,326
68
1,975
27
Sugar
723,503
6
111,888
59
-140,147
43
28,259
43
Wheat
324,137
16
-12,913
2
19,896
88
-6,983
74
Strength Scores led by Platinum and Copper
Strength scores (a measure of the 3-Year range of Speculator positions, from 0 to 100 where above 80 is extreme bullish and below 20 is extreme bearish) show that Platinum (24.4 percent) and Copper (22.9 percent) lead the metals category.
On the downside, Gold (5.3 percent), Palladium (13.6 percent) and Silver (14.0 percent) are at the lowest strength levels currently and all are in extreme bearish positions (below 20 percent).
Strength Statistics: Gold (5.3 percent) vs Gold previous week (8.2 percent) Silver (14.0 percent) vs Silver previous week (15.5 percent) Copper (22.9 percent) vs Copper previous week (20.2 percent) Platinum (24.4 percent) vs Platinum previous week (20.5 percent) Palladium (13.6 percent) vs Palladium previous week (16.7 percent)
Platinum leads the Strength Trends
Strength Score Trends (or move index, calculates the 6-week changes in strength scores) show that Platinum (17.8 percent) leads the past six weeks trends for metals this week. Silver (5.0 percent) and Copper (1.6 percent) fill out the other positive movers in the latest trends data.
Gold (-9.7 percent) leads the downside trend scores currently while the next market with lower trend scores was Palladium (-2.8 percent).
Move Statistics: Gold (-9.7 percent) vs Gold previous week (-8.9 percent) Silver (5.0 percent) vs Silver previous week (15.5 percent) Copper (1.6 percent) vs Copper previous week (2.9 percent) Platinum (17.8 percent) vs Platinum previous week (20.5 percent) Palladium (-2.8 percent) vs Palladium previous week (2.3 percent)
Individual Markets:
Gold Comex Futures:
The Gold Comex Futures large speculator standing this week reached a net position of 68,032 contracts in the data reported through Tuesday. This was a weekly lowering of -8,924 contracts from the previous week which had a total of 76,956 net contracts.
This week’s current strength score (the trader positioning range over the past three years, measured from 0 to 100) shows the speculators are currently Bearish-Extreme with a score of 5.3 percent. The commercials are Bullish-Extreme with a score of 94.4 percent and the small traders (not shown in chart) are Bearish-Extreme with a score of 10.1 percent.
Gold Futures Statistics
SPECULATORS
COMMERCIALS
SMALL TRADERS
– Percent of Open Interest Longs:
46.7
27.0
8.7
– Percent of Open Interest Shorts:
31.8
44.6
6.0
– Net Position:
68,032
-80,213
12,181
– Gross Longs:
212,853
123,085
39,637
– Gross Shorts:
144,821
203,298
27,456
– Long to Short Ratio:
1.5 to 1
0.6 to 1
1.4 to 1
NET POSITION TREND:
– Strength Index Score (3 Year Range Pct):
5.3
94.4
10.1
– Strength Index Reading (3 Year Range):
Bearish-Extreme
Bullish-Extreme
Bearish-Extreme
NET POSITION MOVEMENT INDEX:
– 6-Week Change in Strength Index:
-9.7
9.5
-3.6
Silver Comex Futures:
The Silver Comex Futures large speculator standing this week reached a net position of -101 contracts in the data reported through Tuesday. This was a weekly reduction of -1,368 contracts from the previous week which had a total of 1,267 net contracts.
This week’s current strength score (the trader positioning range over the past three years, measured from 0 to 100) shows the speculators are currently Bearish-Extreme with a score of 14.0 percent. The commercials are Bullish-Extreme with a score of 86.9 percent and the small traders (not shown in chart) are Bearish-Extreme with a score of 13.7 percent.
Silver Futures Statistics
SPECULATORS
COMMERCIALS
SMALL TRADERS
– Percent of Open Interest Longs:
36.8
38.1
16.1
– Percent of Open Interest Shorts:
36.9
44.4
9.6
– Net Position:
-101
-8,857
8,958
– Gross Longs:
51,163
52,952
22,331
– Gross Shorts:
51,264
61,809
13,373
– Long to Short Ratio:
1.0 to 1
0.9 to 1
1.7 to 1
NET POSITION TREND:
– Strength Index Score (3 Year Range Pct):
14.0
86.9
13.7
– Strength Index Reading (3 Year Range):
Bearish-Extreme
Bullish-Extreme
Bearish-Extreme
NET POSITION MOVEMENT INDEX:
– 6-Week Change in Strength Index:
5.0
-6.0
8.5
Copper Grade #1 Futures:
The Copper Grade #1 Futures large speculator standing this week reached a net position of -16,919 contracts in the data reported through Tuesday. This was a weekly increase of 3,383 contracts from the previous week which had a total of -20,302 net contracts.
This week’s current strength score (the trader positioning range over the past three years, measured from 0 to 100) shows the speculators are currently Bearish with a score of 22.9 percent. The commercials are Bullish with a score of 79.3 percent and the small traders (not shown in chart) are Bearish with a score of 31.1 percent.
Copper Futures Statistics
SPECULATORS
COMMERCIALS
SMALL TRADERS
– Percent of Open Interest Longs:
27.9
44.5
8.6
– Percent of Open Interest Shorts:
37.3
35.6
8.0
– Net Position:
-16,919
15,907
1,012
– Gross Longs:
50,000
79,742
15,339
– Gross Shorts:
66,919
63,835
14,327
– Long to Short Ratio:
0.7 to 1
1.2 to 1
1.1 to 1
NET POSITION TREND:
– Strength Index Score (3 Year Range Pct):
22.9
79.3
31.1
– Strength Index Reading (3 Year Range):
Bearish
Bullish
Bearish
NET POSITION MOVEMENT INDEX:
– 6-Week Change in Strength Index:
1.6
-3.6
14.7
Platinum Futures:
The Platinum Futures large speculator standing this week reached a net position of 11,381 contracts in the data reported through Tuesday. This was a weekly boost of 2,887 contracts from the previous week which had a total of 8,494 net contracts.
This week’s current strength score (the trader positioning range over the past three years, measured from 0 to 100) shows the speculators are currently Bearish with a score of 24.4 percent. The commercials are Bullish with a score of 77.1 percent and the small traders (not shown in chart) are Bearish-Extreme with a score of 16.3 percent.
Platinum Futures Statistics
SPECULATORS
COMMERCIALS
SMALL TRADERS
– Percent of Open Interest Longs:
50.7
33.3
12.2
– Percent of Open Interest Shorts:
30.5
60.0
5.8
– Net Position:
11,381
-14,971
3,590
– Gross Longs:
28,471
18,686
6,825
– Gross Shorts:
17,090
33,657
3,235
– Long to Short Ratio:
1.7 to 1
0.6 to 1
2.1 to 1
NET POSITION TREND:
– Strength Index Score (3 Year Range Pct):
24.4
77.1
16.3
– Strength Index Reading (3 Year Range):
Bearish
Bullish
Bearish-Extreme
NET POSITION MOVEMENT INDEX:
– 6-Week Change in Strength Index:
17.8
-16.3
-4.5
Palladium Futures:
The Palladium Futures large speculator standing this week reached a net position of -1,745 contracts in the data reported through Tuesday. This was a weekly reduction of -536 contracts from the previous week which had a total of -1,209 net contracts.
This week’s current strength score (the trader positioning range over the past three years, measured from 0 to 100) shows the speculators are currently Bearish-Extreme with a score of 13.6 percent. The commercials are Bullish-Extreme with a score of 86.8 percent and the small traders (not shown in chart) are Bearish-Extreme with a score of 12.7 percent.
Palladium Futures Statistics
SPECULATORS
COMMERCIALS
SMALL TRADERS
– Percent of Open Interest Longs:
22.0
60.0
14.6
– Percent of Open Interest Shorts:
45.8
29.6
21.2
– Net Position:
-1,745
2,228
-483
– Gross Longs:
1,618
4,403
1,074
– Gross Shorts:
3,363
2,175
1,557
– Long to Short Ratio:
0.5 to 1
2.0 to 1
0.7 to 1
NET POSITION TREND:
– Strength Index Score (3 Year Range Pct):
13.6
86.8
12.7
– Strength Index Reading (3 Year Range):
Bearish-Extreme
Bullish-Extreme
Bearish-Extreme
NET POSITION MOVEMENT INDEX:
– 6-Week Change in Strength Index:
-2.8
4.5
-18.1
Article By InvestMacro – Receive our weekly COT Newsletter
*COT Report: The COT data, released weekly to the public each Friday, is updated through the most recent Tuesday (data is 3 days old) and shows a quick view of how large speculators or non-commercials (for-profit traders) were positioned in the futures markets.
The CFTC categorizes trader positions according to commercial hedgers (traders who use futures contracts for hedging as part of the business), non-commercials (large traders who speculate to realize trading profits) and nonreportable traders (usually small traders/speculators) as well as their open interest (contracts open in the market at time of reporting). See CFTC criteria here.
With global interest and use of copper rising, copper may not be able to meet demand. Expert Rick Mills of Ahead of the Herd reviews the demand for copper, the push for more infrastructure, and what he believes the future holds for this metal.
Copper is one of the most important metals, with more than 20 million tonnes consumed each year across a variety of industries, including building construction (wiring & piping,) power generation/ transmission, and electronic product manufacturing.
World mined copper production, in thousands of tonnes. Source: US Geological Survey
In recent years, the global transition towards clean energy has stretched the need for the tawny-colored metal even further. More copper will be required to feed our renewable energy infrastructure, such as photovoltaic cells used for solar power and wind turbines.
The metal is also a key component in transportation, and with increasing emphasis on electrification, demand is only going to increase.
According to S&P Global’s report, via Reuters, “Efforts to reach carbon neutrality by 2050 are likely to remain out of reach as copper supply fails to match demand amid the growing use of solar panels, electric vehicles, and other renewable technologies.”
A major rise in copper demand from new “blacktop” infrastructure (think roads, bridges, airports, etc.), combined with high demand for copper from large-scale efforts on behalf of governments to decarbonize and electrify, is not being met with an adequate supply of the industrial metal.
Trillions worth of new projects is thus in danger of falling by the wayside unless much more copper is discovered — more than is currently possible, in my opinion.
My position is supported by a recent report from S&P Global, which predicts the world’s appetite for copper will reach 53 million tonnes, on an annual basis, by mid-century. This is more than double the current global mine production of 21Mt, according to the U.S. Geological Survey.
How are we going to find the copper?
The Green Economy
According to S&P Global’s report via Reuters, “Efforts to reach carbon neutrality by 2050 are likely to remain out of reach as copper supply fails to match demand amid the growing use of solar panels, electric vehicles, and other renewable technologies.”
The continued move towards electric vehicles is a huge copper driver. In EVs, copper is a major component used in the electric motor, batteries, inverters, wiring, and in charging stations. An average electric vehicle contains about four times as much copper as regular vehicles.
Compared with traditional energy systems, renewables contain 12 times more copper. Wind farms use anywhere between 4 to 15 million pounds, while solar photovoltaic farms require 9,000 pounds per megawatt.
The big question is, will there be enough copper for future electrification needs globally? And remember, in addition to electrification, copper will still be required for all the standard uses.
The short answer is no, not without a massive acceleration of copper production worldwide.
According to a joint report from Ernst & Young (EY) and Eurelectric, Europe will have 130 million EVs by 2025. Each takes about 85 kg (187 pounds) of copper.
The report’s projections, cited by Bloomberg, show Europe’s EV fleet growing from its current <5 million to 65 million by 2030, then doubling over the following five years. This number of EVS will require 65 million chargers. Charging stations take 0.7 kg (for a 3.3 kW slow charger) or 8 kg (for a 200 kW fast charger), according to the Copper Alliance.
An EY leader notes it took 10 years to install 400,000 chargers; now, we will need about 500,000 per year until 2030 and 1 million every year between 2030 and 2035.
That would mean an extra million tonnes a year, over and above what we mine now, every year for the next 20 years! The world’s copper miners need to discover the equivalent of one Escondida, the largest copper mine on the planet, each and every year while keeping current production at ~20Mt.
There is also no shift from fossil fuels to green energy without copper, which has no substitutes for its uses in EVs (electric motors and wiring, batteries, inverters, charging stations), wind, and solar energy.
Many countries need to reduce their so-called “infrastructure deficits.” Basic infrastructure, such as roads, bridges, water and sewer systems, has been poorly maintained and requires hefty investments, measured in trillions of dollars, to repair or replace.
China, the world’s biggest commodities consumer, has committed to spend at least US$2.3 trillion this year on major infrastructure projects. They are part of Beijing’s most recent five-year plan that calls for developing “core technologies,” including high-speed rail, power infrastructure, and new energy. More money will be aside in years two to five.
There is also the “Made in China 2025″ initiative, which seeks to end Chinese reliance on foreign technology by investing in a number of key sectors, including IT and robotics, and China’s $900 billion “Belt and Road Initiative,” designed to open channels between China and its neighbors, mostly through infrastructure investments. Dozens of countries have signed up for it, including Russia.
Research commissioned by the International Copper Association, quoted by Mining Technology, found that Belt and Road projects in over 60 Eurasian countries will push the demand for copper to 6.5 million tonnes by 2027.
China’s Belt and Road Initiative
That much copper equates to nearly a third of the 21Mt of copper produced in 2021 — a new copper supply that would need to be either mined from existing operations or discovered.
The U.S. is pursuing its own US$1.2 trillion infrastructure package, to be spent on roads, bridges, power & water systems, transit, rail, electric vehicles, and upgrades to broadband, airports, ports, and waterways, among many other items.
According to S&P Global, Among the metals-intensive funding in the legislation is US$110 billion for roads, bridges, and major projects, US$66 billion for passenger and freight rail, US$39 billion for public transit, and US$7.5 billion for electric vehicles.
Some of the largest copper mines are seeing their reserves dwindle; they are having to slow production due to major capital-intensive projects to move operations from open pit to underground. Examples include the world’s two largest copper mines, Escondida in Chile and Grasberg in Indonesia, along with Chuquicamata, the biggest open-pit mine on Earth.
Without new capital investments, Commodities Research Unit (CRU) predicts global copper mined production will drop from the current 21Mt to below 12Mt, leading to a supply shortfall of more than 15Mt. Over 200 copper mines are expected to run out of ore before 2035, with not enough new mines in the pipeline to take their place.
Graph courtesy of Hamish Sampson, analyst at CRU’s copper team
Bank of America, in a recent report, predicts the copper market will flip into a deficit as early as 2025 following the completion of the current wave of project buildouts, the latest being Ivanhoe Mines’ massive Kamoa-Kakula project in the Democratic Republic of the Congo.
Five years later, analysts at Rystad Energy project that copper demand will outstrip supply by more than 6 million tonnes. That equates to nearly the entire annual production of Chile, the world’s top producer.
By 2040, the supply shortfall grows to 14Mt, according to a BloombergNEF August report, with a “best-case scenario” shortage of >5 million short tons possible by 2040.
In fact, we don’t have to wait to see signs of an emerging copper crisis. Some of the world’s largest copper miners this year have proven unable to produce as much as they said they would. BHP, Rio Tinto, Anglo American, First Quantum Minerals, and Glencore have all pared back production forecasts, blaming higher costs for their lower output figures. (see ‘Cost creep’ below)
Following a 14% drop in copper production in Q1, Glencore cut its 2022 guidance by 3% or 40,000 tonnes.
According to Goldman Sachs, the incentive price to make mining attractive is now 30% higher than in 2018, at roughly US$9,000 a ton (as I write this copper is US$7060.00t).
Some of this has to do with deposits getting mined out. As grades decline, higher amounts of ore need to be processed to yield an equivalent amount of copper.
New deposits are getting trickier and pricier to find and develop. There is a lot of anti-mining sentiment in Canada and the United States, and politicians are beholden to these pressure groups. It can take up to 20 years to build a mine after all the stakeholders have been consulted and the many permitting requirements have been satisfied.
Overall, it is getting harder and taking longer for new projects to be green-lit.
Source: Energy & Capital
According to Goehring & Rozencwajg Associates, the number of new world-class copper discoveries coming online this decade “will decline substantially and depletion problems at existing mines will accelerate.”
According to the Wall Street firm’s model, the industry is “approaching the lower limits of cut-off grades,” and brownfield expansions are no longer a viable solution. “If this is correct, then we are rapidly approaching the point where reserves cannot be grown at all,” the report concluded.
It also shines a light on the importance of making new discoveries in establishing a sustainable copper supply chain.
Over the past 10 years, greenfield additions to copper reserves have slowed dramatically. S&P Global estimates that new discoveries averaged nearly 50Mt annually between 1990 and 2010. Since then, new discoveries have fallen by 80% to only 8Mt per year.
In fact, new copper supply is concentrated in just five mines — Chile’s Escondida, Spence and Quebrada Blanca, Cobre Panama, and the Kamoa-Kakula project in the DRC. Our analysis shows that in four of the five mines where new copper supply is concentrated, there are offtake agreements, either in place or implied, with non-Western buyers.
In the case of Kamoa-Kaukula, 100% of initial production will be split between two Chinese companies, one of which owns 39.6% of the joint venture project. Nearly half of Cobre Panama’s annual production goes to a Korean smelter under a 2017 offtake agreement.
Escondida and Quebrada Blanca are both partially owned by Japanese companies — one can make the assumption that a corresponding percentage of production will be going there.
Companies that diversify into copper now would be well-positioned to benefit from the coming copper shortfall, which should result in a much higher realized copper price.
Barrick Gold Corp. (ABX:TSX; GOLD:NYSE) and Agnico Eagle Mines Ltd. (AEM:TSX; AEM:NYSE) are two recent examples.
Agnico Eagle paid US$580 million for a 50% share in Teck’s San Nicolas copper-zinc mine in Zacatecas, Mexico.
About 20% of Barrick Gold’s production now comes from copper.
Cost Creep
Copper mining has become an especially capital-intensive industry – the average capital intensity for a new copper mine in 2000 was US$4,000-5,000 to build the capacity to produce a tonne of copper; in 2012, capital intensity was US$10,000/t, on average, for new projects.
Today, building a new copper mine can cost up to US$44,000 per tonne of production, an AOTH analysis has found.
Capex costs are escalating because:
Declining copper ore grades means a much larger relative scale of required mining and milling operations.
A growing proportion of mining projects are in remote areas of developing economies where there’s little to no existing infrastructure.
Many inputs necessary for mine-building are getting more expensive as cross-the-board inflation, the highest in 40 years, infiltrates the industry. This includes two of the largest costs, wages and diesel fuel used to run mining equipment.
The bottom line?
It is becoming increasingly costly to bring new copper mines online and run them. According to Goldman Sachs, the incentive price to make mining attractive is now 30% higher than in 2018, at roughly US$9,000 a ton (as I write this, copper is US$7060.00t).
Along with technical issues such as falling grades/deteriorating ore quality, there is also supply pressure from growing resource nationalism.
There is a need to go further afield and dig deeper to find copper at the grades needed to economically produce copper products. This usually means riskier jurisdictions that are often ruled by shaky governments.
In February, Goldman Sachs predicted a “scarcity episode” by the end of 2022 as global stocks of copper fell to dangerously low levels.
Peru and Chile, which together account for more than a third of global copper output, are both seeing a wave of resource nationalism, where governments try to exact a greater share of resource revenues through various means, such as higher royalties and export bans of raw ores.
Chile has attracted substantial mining investment in recent years, including from leading copper producers like BHP and Teck. But long-term, Chile’s declining ore grades present a key downside risk to production forecasts.
The chart below shows Chile’s average copper grades were more than cut in half between 1999 and 2016.
Source: Cochilco
Chile is also producing less copper. According to Cochilco, the country’s state copper commission, in 2000, Chile produced 34.7% of the world’s copper; by 2017, the percentage had fallen to 26.7% (the USGS’s latest figures show Chilean mine production at 26% of the global total).
State-owned copper miner Codelco, which is the largest copper company in the world, is facing challenges linked to the redevelopment of its copper mines, meaning it will produce 1.5 million tonnes of copper this year and next, compared with 1.7 million tonnes in 2021, Reuters said this week.
Making matters worse, after more than a decade of drought, freshwater supplies are becoming a big problem in Chile. Copper mines there require lots of water to process sulfide ores, and the lower the grade, the more water must be used.
Like Chile, the world’s second-largest copper miner has underperformed. Copper production in July totaled 195,234 tonnes, following a respective 9.1% and 14.5% drop in output at the Antamina and Southern Copper mines. The result was a 6.6% year-on-year loss.
While copper production at China-owned Las Bambas recovered in June, following a truce with indigenous communities who oppose the mine, the agreement ended in July, and renewed protests could risk copper supplies, Reuters said.
The Chinese copper market is at its tightest in more than a decade as traders pay massive premiums for immediate supplies.
Peru’s President Pedro Castillo has proposed to raise taxes on the mining sector by at least 3%, which the country’s mining chamber says could cost USD$50 billion in future investments.
In the Democratic Republic of Congo (DRC), weak infrastructure, including a lack of power, is limiting the growth potential for major copper deposits. This past summer, the Congolese government suspended metal exports from Tenke Fungurume, a large copper-cobalt mine owned by China’s CMOC.
The DRC is the world’s top producer of cobalt and Africa’s leading copper-mining country. Tenke Fugurume accounted for more than 10% of global cobalt output in 2021.
Dwindling Inventories
In February, Goldman Sachs predicted a “scarcity episode” by the end of 2022 as global stocks of copper fell to dangerously low levels. That never happened due to the abrupt fall in the copper price, owing to the Federal Reserve’s interest rate increases, the high US dollar, a slowdown in China, and talk of a global recession. Still, Goldman’s warning about a “stock-out” remains well supported.
Goehring & Rozencwajg, the Wall Street firm, published a chart of copper warehouse inventories showing a four-year down-trend from around April 2018 to the present.
These days, there is a puzzling disconnect between the copper price, which has dropped to a five-week low of US$3.54 a pound (at the time of writing), and market tightness.
The latter is aptly demonstrated by what is happening in Shanghai, China, where for the past 15 years, a huge copper stockpile, larger even than the London Metal Exchange, has been used by Chinese companies as collateral for cheap financing.
Now, according to Bloomberg, China’s bonded warehouses are all but empty. The once-frenetic flow of metal into the stockpile has come to a juddering halt as two dominant financiers of Chinese metals, JPMorgan Chase & Co. and ICBC Standard Bank Plc, have halted new business there. Numerous traders and bankers interviewed by Bloomberg said they believe the trade is dead for now, and some predicted the bonded stocks could drop to zero or close to it.
The implications are being felt across the market as the world’s largest copper consumer becomes more reliant on imports to meet its near-term needs at a time when global stocks are already at historically low levels. The Chinese copper market is at its tightest in more than a decade as traders pay massive premiums for immediate supplies.
At their peak in 2011-12, China’s bonded stocks held about a million tons of copper. This month they totaled just 30,000 tons — down nearly 300,000t from earlier this year, the lowest level in decades.
Bloomberg explains that the decline began several years ago, with a massive warehousing fraud in 2014 that soured many banks and traders in the Chinese metals industry. This year, the country’s economic slump, rising interest rates, and several high-profile losses caused more participants to stay away.
The key point is, without the Shanghai buffer of bonded stocks, any pickup in Chinese demand could send copper prices soaring.
In short, says Woodmac, “the global energy transition presents an almost unattainable mine supply challenge, with significant investment and price incentives required.”
It’s not only in China that copper stockpiles are getting depleted. As of this week, CRU Group estimates global stocks are down to just 1.6 weeks of consumption. That’s the lowest ever in the copper consultancy’s data going back to 2001, Bloomberg said.
On October 19, Reuters reported the available copper in London Metal Exchange warehouses halved within eight days.
A squeeze on the Shanghai Futures Exchange (ShFE) has generated a scramble for metal, metals columnist Andy Home explained, adding that, As bonded stocks rapidly deplete to fill on-shore ShFE warehouses, physical premiums are, in turn, rising to attract more metal from the international market.
The Yangshan copper premium, a useful proxy for China’s spot import demand, has soared to $147.50 per tonne over LME cash, its highest trading level since 2013.
Western sanctions on Russian companies due to the war in Ukraine are also factoring into low copper inventories. The LME is reportedly talking about suspending deliveries of Russian metal (aluminum, copper, and nickel), which at the end of September comprised over 60% of the exchange’s copper stocks.
Locking In
Some copper buyers are so worried about the future availability of the metal that they are looking to secure longer-term deals than normal. For example, Bloomberg said that Codelco recently signed contracts with customers in Europe for three to five years versus the traditional annual deals.
“We are prepared to continue to strengthen our long-term relations with customers because we can understand that in their risk matrix, their concern about copper supply is one of their priorities,” Codelco’s Chairman Maximo Pacheco said in an interview.
Pointing to forecasts for strong copper demand growth, he said, “Obviously, they have a question: ‘Where are we going to get this copper from?’.”
Supply-Demand Gap
It’s a good question, we find ourselves asking it repeatedly.
A new report from Wood Mackenzie estimates that 9.7 million tonnes of new copper supply is needed over 10 years to meet the targets set out in the Paris Climate Agreement. As stated earlier, this is the equivalent of putting a new Escondida Mine into production every year.
Source: Wood Mackenzie
Figures from the commodities consultancy show that mining project approval rates have stalled despite historically high copper prices (in Q1).
During the first half of 2022, the volume of committed projects totaled just 260,000 tonnes of production per year (against total annual mine production of around 21 million tonnes).
Source: Wood Mackenzie
“To successfully meet zero-carbon targets, the mining industry needs to deliver new projects at a frequency and consistent level of financing never previously accomplished,” said Nick Pickens, research director of copper markets at Wood Mackenzie.
In short, says Woodmac, “the global energy transition presents an almost unattainable mine supply challenge, with significant investment and price incentives required.”
The firm estimates over US$23 billion a year will be needed over 30 years to deliver new projects under the 1.5 degrees Celsius Paris scenario — a level of investment previously seen only for a limited period from 2012 to 2016, following the China-induced commodity super-cycle.
The copper price needed to meet demand under this scenario is US$4.25 a pound, about 25% higher than currently.
Source: Wood Mackenzie
In an article titled ‘A Great Copper Squeeze Is Coming for the Global Economy,’ Bloomberg reported in September that the recent downturn in copper prices stands to worsen the coming deficit because the slump discourages new copper investments.
A massive copper shortfall that could be visited upon the industry in as short as two years’ time could, says Bloomberg, hold back global growth, stoke inflation by raising manufacturing costs, and throw global climate goals off course. . .
And the latest market downturn stands to exacerbate future supply problems by offering a false sense of security, choking off cash flow, and chilling investments. It takes at least 10 years to develop a new mine and get it running, which means that the decisions producers are making today will help determine supplies for at least a decade. [in North America, the time frame is more like 20 years — Rick]
The coming supply squeeze will be truly breathtaking and deserves more of a numerical explanation.
According to a study from S&P Global, emissions goals commensurate with decarbonization and electrification will double copper demand to 50 million tonnes by 2035. Bloomberg New Energy Finance estimates demand will increase by over 50% from 2022 to 2040.
Supply growth is expected to peak around 2024, the result of very few new projects in the works and as existing mines are depleted. According to S&P’s research, this is setting up a supply deficit of 10 million tons in 2035 — the equivalent of 10 Escondidas.
Goldman Sachs thinks mining companies need to spend about US$150 billion over the next decade to solve an 8Mt deficit. BloombergNEF predicts that by 2040 the mined output gap could reach 14Mt.
Copper Prices
The next question is what this means for copper prices going forward. In 2021, when the copper deficit was 441,000 tons, copper prices jumped about 25%. 441,000t is less than 2% of demand, but in S&P Global’s worst-case scenario, 2035’s shortfall will be the equivalent of about 20% of consumption.
Goldman Sachs is forecasting the LME copper price to more than double its current level to US$15,000 a ton in 2025. Let’s step back here and remember the incentive price to make mining copper attractive is US$9,000.00 a ton copper is trading currently at US$7,000.00t.
Copper will have to rise from its current price of US$3.54 to a minimum of US$4.50lb to incentivize miners to build mines.
Of course, one of the biggest wildcards in all this is China, the world’s largest metals consumer, accounting for about half of global copper demand. If the country’s property sector contracts significantly, it would obviously mean less copper-demanded construction.
Another unknown is the potential for a global recession. Citigroup, via CNBC, sees copper prices in the short-term falling due to an economic slowdown driven by Europe. The bank forecasted copper at US$6,600 a ton in the first quarter of 2023.
Other forecasters, and that includes us at AOTH, believe a recession will only delay demand, which is inevitable due to the trillions of dollars being planned for electrification and infrastructure investments. An August 31 presentation from BloombergNEF states that a recession will not “significantly dent” consumption projections going into 2040.
Bloomberg points out there is already very little wiggle room on the supply side: The physical copper market is already so tight that despite the slump in futures prices, the premiums paid for immediate delivery of the metal have been moving higher.
Richard Adkerson, the CEO of Freeport McMoRan, recently weighed in on the disconnect between supply tightness and the lower copper price, saying during a conference call with analysts, “It’s striking how negative financial markets feel about this market, and yet the physical market is so tight.”
“We’re not seeing customers scaling back orders. Customers are really fighting to get products,” Adkerson said. He added that such a pricing environment will defer new copper projects and mine expansions just when the world’s epic shift to electrification requires a massive amount of the metal.
The copper price rose on Wednesday, October 26, to US$3.54 a pound, the highest since September 16, buoyed by a weaker US dollar. Hope for a rebound has also been strengthened due to recent news out of China.
The country is considering lessening its quarantine period for inbound visitors from 10 to seven days, an indication it is winning its war against the coronavirus pandemic that has resulted in nationwide lockdowns.
Conclusion
The demand pressure about to be exerted on copper producers in the coming years all but guarantees a market imbalance, resulting in copper becoming scarcer and dearer with each infrastructure initiative and with each ambitious green initiative rolled out by governments.
The problem is that existing copper mines are running out of ore, and the capital invested in new mines is far below the needed level.
In sum, the copper industry is in the grips of a structural supply deficit that, combined with inflationary cost pressures and creeping resource nationalism in some of the world’s largest copper producers, is only expected to get worse.
According to S&P Global Market Intelligence research, of 224 sizable copper deposits discovered in the past 30 years, only 16 have been found in the last decade.
It takes seven to 10 years, at minimum, to move a copper mine from discovery to production. In regulation-happy jurisdictions like Canada and the U.S., the time frame is more like 20 years.
The pipeline of copper development projects is the lowest it’s been in decades.
Why can’t we just mine more copper?
Over the past two decades, big mining companies have approached the problem of dwindling reserves by doing exactly that.
Historical Copper Price
Between 2001 and 2014, 80% of new reserves came from re-classifying what was once waste rock into mineable ore, i.e., lowering the cut-off grade.
The problem is that between lowering their cut-off grades and high-grading (removing all the best ore and leaving the rest), the grade of new reserves each year has steadily declined.
In 2001, the new reserves grade was 0.80% copper, but by 2012, it had fallen to 0.26%. The copper industry was still able to replace all the ore used in production with new reserves, but the quality of those reserves, i.e., the grade, had dropped by nearly two-thirds.
The authors of a recent report contend that even with prices above $10,000 per tonne, reserves cannot keep growing, specifically at porphyry deposits, where most copper is mined.
Their analysis also suggests that we are quickly approaching the lower limits of cut-off grades, concluding that we are rapidly approaching the point where reserves cannot be grown at all. In other words, peak copper.
The industry can no longer re-classify itself out of its problem. Billions and billions of dollars need to be invested in the exploration and development of new copper mines.
In sum, the copper industry is in the grips of a structural supply deficit that, combined with inflationary cost pressures and creeping resource nationalism in some of the world’s largest copper producers, is only expected to get worse.
Ahead of the Herd newsletter, aheadoftheherd.com, hereafter known as AOTH.
Please read the entire Disclaimer carefully before you use this website or read the newsletter. If you do not agree to all the AOTH/Richard Mills Disclaimer, do not access/read this website/newsletter/article, or any of its pages. By reading/using this AOTH/Richard Mills website/newsletter/article, and whether you actually read this Disclaimer, you are deemed to have accepted it.
Any AOTH/Richard Mills document is not, and should not be, construed as an offer to sell or the solicitation of an offer to purchase or subscribe for any investment.
Disclosures:
1) Rick Mills: I, or members of my immediate household or family, own securities of the following companies mentioned in this article: None. I personally am, or members of my immediate household or family are, paid by the following companies mentioned in this article: None. I determined which companies would be included in this article based on my research and understanding of the sector.
2) The following companies mentioned in this article are billboard sponsors of Streetwise Reports: None. Click here for important disclosures about sponsor fees. The information provided above is for informational purposes only and is not a recommendation to buy or sell any security.
3) Statements and opinions expressed are the opinions of the author and not of Streetwise Reports or its officers. The author is wholly responsible for the validity of the statements. The author was not paid by Streetwise Reports for this article. Streetwise Reports was not paid by the author to publish or syndicate this article. Streetwise Reports requires contributing authors to disclose any shareholdings in, or economic relationships with, companies that they write about. Streetwise Reports relies upon the authors to accurately provide this information and Streetwise Reports has no means of verifying its accuracy.
4) This article does not constitute investment advice. Each reader is encouraged to consult with his or her individual financial professional and any action a reader takes as a result of information presented here is his or her own responsibility. By opening this page, each reader accepts and agrees to Streetwise Reports’ terms of use and full legal disclaimer. This article is not a solicitation for investment. Streetwise Reports does not render general or specific investment advice and the information on Streetwise Reports should not be considered a recommendation to buy or sell any security. Streetwise Reports does not endorse or recommend the business, products, services, or securities of any company mentioned on Streetwise Reports.
5) From time to time, Streetwise Reports LLC and its directors, officers, employees, or members of their families, as well as persons interviewed for articles and interviews on the site, may have a long or short position in the securities mentioned. Directors, officers, employees, or members of their immediate families are prohibited from making purchases and/or sales of those securities in the open market or otherwise from the time of the decision to publish an article until three business days after the publication of the article. The foregoing prohibition does not apply to articles that in substance only restate previously published company release. As of the date of this article, officers and/or employees of Streetwise Reports LLC (including members of their household) own securities of Agnico Eagle, a company mentioned in this article.
Rock Tech Lithium Inc. shares traded 30% higher yesterday after the company reported it executed a five-year supply contract with Mercedes-Benz AG of Germany. Under the terms of the agreement, Rock Tech will provide Mercedes with 10,000 tonnes of battery-grade lithium hydroxide yearly, which is expected to generate CA$2 billion in revenue for the company.
The agreement between the two companies will run for a period of five years and is expected to provide Rock Tech with total revenues of around CA$2 billion over the life of the agreement.
Rock Tech’s CEO Markus Bruegmann remarked, “Signing the Supply Agreement marks a significant milestone of our offtake strategy, and I am honored that Mercedes-Benz demonstrates trust in Rock Tech as a new but reliable player in a diversified European battery supply chain.”
Vancouver B.C.-based lithium explorer and developer Rock Tech Lithium Inc. (RCK:TSX.V; RCKTF:OTCQX; RJIB:FSE; A1XF0V:WKN), which owns a 100% interest in the Georgia Lake lithium project in Ontario’s Thunder Bay Mining District, yesterday announced that “it has entered into a definitive supply agreement with Mercedes-Benz Group AG (MBGYY:OTCMKTS;MBGAF:OTC-Pink) providing for the supply of an average of 10,000 tonnes of battery-grade lithium hydroxide per year.”
The contracted deliveries will account for about 40% of the forecasted annual production from Rock Tech’s planned converter capacity in Guben, Germany.
Rock Tech’s CEO Markus Bruegmann remarked, “Signing the Supply Agreement marks a significant milestone of our offtake strategy, and I am honored that Mercedes-Benz demonstrates trust in Rock Tech as a new but reliable player in a diversified European battery supply chain.”
“We intend to focus our efforts on providing lithium hydroxide that will help to bring Mercedes-Benz’s electric mobility ambitions into action. This arrangement is a major step forward in our plans to directly contribute to clean mobility,” Bruegmann added.
Mercedes-Benz Group’s Chief Technology Officer Markus Schäfer commented, “This significant amount of lithium sourced directly from Rock Tech will help Mercedes-Benz to advance localization of European production of state-of-the-art battery cells. The on average 10,000 tonnes of lithium hydroxide per annum will play a key role in securing the lithium supply for our battery production in Europe to help achieve our ambitious electrification goals.”
It is anticipated that the high-quality lithium hydroxide produced by Rock Tech will allow Mercedes-Benz to scale up production and equip approximately 150,000 electric vehicles (EVs) with premium high-performance batteries.
Both firms are striving to meet their goals of achieving carbon neutrality and, as part of the agreement, are committed to creating a roadmap to achieving CO2-neutral production of lithium hydroxide by year-end 2030. The companies noted that to ensure this objective is met, the agreement specifically requires that “all lithium hydroxide supplied by Rock Tech shall be sourced from mining sites audited by the Initiative for Responsible Mining Assurances (IRMA).”
Rock Tech is headquartered in Vancouver, B.C., and is focused on the exploration and development of lithium properties. The company holds a 100% interest in the Georgia Lake lithium project located within Ontario’s Thunder Bay Mining District. In addition to its upstream activities, the firm is investing in downstream operations, with the first planned lithium hydroxide converter built in Germany to supply the EU auto market with the materials needed to manufacture EV batteries. Approximately 40% of the product produced at this plant will be sold to Mercedes-Benz to satisfy the recently signed 5-year supply contract.
Mercedes-Benz Group AG is dedicated to moving toward CO2 neutrality and is strategically acting to transform its vehicle production to an all-electric platform. The company is highly focused on developing and integrating advanced battery cell technology with higher energy density and safety to increase the quality, range, and performance of its cars and vans.
Rock Tech Lithium has a market cap of around US$178.3 million, with approximately 84.7 million shares outstanding. RCKTF shares opened nearly 28% higher yesterday at US$2.63 (+US$0.572, +27.79%) over the previous day’s US$2.058 closing price. The stock traded yesterday between US$2.44 and US$2.70 per share and closed for trading at US$2.68 (+US$0.622, +30.22%).
Disclosures: 1) Stephen Hytha wrote this article for Streetwise Reports LLC and provides services to Streetwise Reports as an independent contractor. He or members of his household own securities of the following companies mentioned in the article: None. He or members of his household are paid by the following companies mentioned in this article: None.
2) The following companies mentioned in this article are billboard sponsors of Streetwise Reports: None. Click here for important disclosures about sponsor fees.
3) Comments and opinions expressed are those of the specific experts and not of Streetwise Reports or its officers. The information provided above is for informational purposes only and is not a recommendation to buy or sell any security.
4) The article does not constitute investment advice. Each reader is encouraged to consult with his or her individual financial professional and any action a reader takes as a result of information presented here is his or her own responsibility. By opening this page, each reader accepts and agrees to Streetwise Reports’ terms of use and full legal disclaimer. This article is not a solicitation for investment. Streetwise Reports does not render general or specific investment advice and the information on Streetwise Reports should not be considered a recommendation to buy or sell any security. Streetwise Reports does not endorse or recommend the business, products, services or securities of any company mentioned on Streetwise Reports.
5) From time to time, Streetwise Reports LLC and its directors, officers, employees or members of their families, as well as persons interviewed for articles and interviews on the site, may have a long or short position in securities mentioned. Directors, officers, employees or members of their immediate families are prohibited from making purchases and/or sales of those securities in the open market or otherwise from the time of the decision to publish an article until three business days after the publication of the article. The foregoing prohibition does not apply to articles that in substance only restate previously published company releases.
Here are the latest charts and statistics for the Commitment of Traders (COT) data published by the Commodities Futures Trading Commission (CFTC).
The latest COT data is updated through Tuesday October 18th and shows a quick view of how large traders (for-profit speculators and commercial entities) were positioned in the futures markets.
Platinum tops Weekly Speculator Changes
The COTprecious metals speculator bets were lower this week as just one out of the five metals markets we cover had higher positioning this week while four markets had lower contracts.
Leading the precious metals markets was just Platinum (2,566 contracts) showing a positive week.
The metals markets leading the declines in speculator bets this week were Gold (-17,464 contracts) with Silver (-6,122 contracts), Copper (-4,403 contracts) and Palladium (-455 contracts) also registering lower bets on the week.
Highlighting the COT Metals data this week was the speculator positions in Platinum. The large speculative positions rose this week for a third straight week and for the fifth time in the past six weeks. Over the past six weeks, speculative bets have improved by a total of +15,245 contracts. This recent bullishness has brought the overall net standing to its highest level in the past twenty-eight weeks, dating back to April 5th of this year.
Platinum prices have been on the rise as well with a monthly gain above 8 percent so far in October. Platinum could also benefit going forward from an interesting tax loophole in India that has pushed Platinum imports to a record high to approximately 27 tonnes this September compared to a little over 1 tonnes last September, according to Reuters. Indian gold refiners are importing Platinum mixed with Gold to offset new higher taxes on Gold. A Gold/Platinum mix allows importers to classify the import as a Platinum alloy and pay a lower tax rate on it.
Platinum futures closed this week over 4 percent higher near the $933 level but below the $940 level which has acted as a resistance barrier over the past five weeks.
Data Snapshot of Commodity Market Traders | Columns Legend
Oct-18-2022
OI
OI-Index
Spec-Net
Spec-Index
Com-Net
COM-Index
Smalls-Net
Smalls-Index
WTI Crude
1,454,431
0
251,545
11
-273,757
90
22,212
37
Gold
434,701
1
76,956
8
-90,030
91
13,074
12
Silver
136,055
9
1,267
15
-9,085
87
7,818
8
Copper
178,730
17
-20,302
20
19,696
82
606
29
Palladium
6,805
4
-1,209
16
1,444
82
-235
30
Platinum
53,728
11
8,494
21
-11,632
81
3,138
10
Natural Gas
963,792
3
-154,734
32
126,760
71
27,974
46
Brent
163,296
11
-41,847
41
38,681
58
3,166
52
Heating Oil
283,702
29
24,555
79
-44,031
24
19,476
66
Soybeans
714,532
30
54,683
30
-30,595
77
-24,088
30
Corn
1,419,087
22
312,419
70
-249,255
36
-63,164
7
Coffee
196,729
9
19,223
53
-21,605
52
2,382
24
Sugar
711,664
4
126,412
63
-164,671
37
38,259
55
Wheat
309,429
10
-3,541
14
10,534
75
-6,993
74
Strength Scores led by Platinum and Copper
Strength scores (a measure of the 3-Year range of Speculator positions, from 0 to 100 where above 80 is extreme bullish and below 20 is extreme bearish) showed that Platinum (20.5 percent) and Copper (20.2 percent) lead the metals this week just above the bearish extreme level.
On the downside, Gold (8.2 percent) continues to be at the lowest strength level currently and is followed by Silver (15.5 percent) and Palladium (16.4 percent). All three markets in extreme bearish levels below 20 percent.
Strength Statistics: Gold (8.2 percent) vs Gold previous week (14.0 percent) Silver (15.5 percent) vs Silver previous week (22.3 percent) Copper (20.2 percent) vs Copper previous week (23.7 percent) Platinum (20.5 percent) vs Platinum previous week (17.1 percent) Palladium (16.4 percent) vs Palladium previous week (19.1 percent)
Platinum leads the Strength Trend Scores
Strength Score Trends (or move index, calculates the 6-week changes in strength scores) show that Platinum (20.5 percent) leads the past six weeks trends for metals this week. Silver (15.5 percent), Copper (2.9 percent) and Palladium (2.3 percent) fill out the other positive movers in the latest trends data.
Gold (-8.9 percent) leads the downside trend scores currently as the only negative mover in the latest data.
Move Statistics: Gold (-8.9 percent) vs Gold previous week (-7.7 percent) Silver (15.5 percent) vs Silver previous week (17.3 percent) Copper (2.9 percent) vs Copper previous week (5.9 percent) Platinum (20.5 percent) vs Platinum previous week (15.2 percent) Palladium (2.3 percent) vs Palladium previous week (2.2 percent)
Individual Markets:
Gold Comex Futures:
The Gold Comex Futures large speculator standing this week came in at a net position of 76,956 contracts in the data reported through Tuesday. This was a weekly reduction of -17,464 contracts from the previous week which had a total of 94,420 net contracts.
This week’s current strength score (the trader positioning range over the past three years, measured from 0 to 100) shows the speculators are currently Bearish-Extreme with a score of 8.2 percent. The commercials are Bullish-Extreme with a score of 91.4 percent and the small traders (not shown in chart) are Bearish-Extreme with a score of 12.4 percent.
Gold Futures Statistics
SPECULATORS
COMMERCIALS
SMALL TRADERS
– Percent of Open Interest Longs:
48.5
26.5
9.0
– Percent of Open Interest Shorts:
30.8
47.2
6.0
– Net Position:
76,956
-90,030
13,074
– Gross Longs:
210,890
115,073
39,286
– Gross Shorts:
133,934
205,103
26,212
– Long to Short Ratio:
1.6 to 1
0.6 to 1
1.5 to 1
NET POSITION TREND:
– Strength Index Score (3 Year Range Pct):
8.2
91.4
12.4
– Strength Index Reading (3 Year Range):
Bearish-Extreme
Bullish-Extreme
Bearish-Extreme
NET POSITION MOVEMENT INDEX:
– 6-Week Change in Strength Index:
-8.9
7.4
7.2
Silver Comex Futures:
The Silver Comex Futures large speculator standing this week came in at a net position of 1,267 contracts in the data reported through Tuesday. This was a weekly decline of -6,122 contracts from the previous week which had a total of 7,389 net contracts.
This week’s current strength score (the trader positioning range over the past three years, measured from 0 to 100) shows the speculators are currently Bearish-Extreme with a score of 15.5 percent. The commercials are Bullish-Extreme with a score of 86.6 percent and the small traders (not shown in chart) are Bearish-Extreme with a score of 8.2 percent.
Silver Futures Statistics
SPECULATORS
COMMERCIALS
SMALL TRADERS
– Percent of Open Interest Longs:
37.9
37.5
16.2
– Percent of Open Interest Shorts:
37.0
44.1
10.4
– Net Position:
1,267
-9,085
7,818
– Gross Longs:
51,541
50,956
22,014
– Gross Shorts:
50,274
60,041
14,196
– Long to Short Ratio:
1.0 to 1
0.8 to 1
1.6 to 1
NET POSITION TREND:
– Strength Index Score (3 Year Range Pct):
15.5
86.6
8.2
– Strength Index Reading (3 Year Range):
Bearish-Extreme
Bullish-Extreme
Bearish-Extreme
NET POSITION MOVEMENT INDEX:
– 6-Week Change in Strength Index:
15.5
-13.4
0.4
Copper Grade #1 Futures:
The Copper Grade #1 Futures large speculator standing this week came in at a net position of -20,302 contracts in the data reported through Tuesday. This was a weekly decline of -4,403 contracts from the previous week which had a total of -15,899 net contracts.
This week’s current strength score (the trader positioning range over the past three years, measured from 0 to 100) shows the speculators are currently Bearish with a score of 20.2 percent. The commercials are Bullish-Extreme with a score of 82.3 percent and the small traders (not shown in chart) are Bearish with a score of 28.8 percent.
Copper Futures Statistics
SPECULATORS
COMMERCIALS
SMALL TRADERS
– Percent of Open Interest Longs:
27.6
46.4
8.5
– Percent of Open Interest Shorts:
39.0
35.4
8.1
– Net Position:
-20,302
19,696
606
– Gross Longs:
49,335
82,890
15,118
– Gross Shorts:
69,637
63,194
14,512
– Long to Short Ratio:
0.7 to 1
1.3 to 1
1.0 to 1
NET POSITION TREND:
– Strength Index Score (3 Year Range Pct):
20.2
82.3
28.8
– Strength Index Reading (3 Year Range):
Bearish
Bullish-Extreme
Bearish
NET POSITION MOVEMENT INDEX:
– 6-Week Change in Strength Index:
2.9
-5.5
19.9
Platinum Futures:
The Platinum Futures large speculator standing this week came in at a net position of 8,494 contracts in the data reported through Tuesday. This was a weekly gain of 2,566 contracts from the previous week which had a total of 5,928 net contracts.
This week’s current strength score (the trader positioning range over the past three years, measured from 0 to 100) shows the speculators are currently Bearish with a score of 20.5 percent. The commercials are Bullish-Extreme with a score of 81.4 percent and the small traders (not shown in chart) are Bearish-Extreme with a score of 10.3 percent.
Platinum Futures Statistics
SPECULATORS
COMMERCIALS
SMALL TRADERS
– Percent of Open Interest Longs:
49.1
36.1
12.0
– Percent of Open Interest Shorts:
33.3
57.8
6.1
– Net Position:
8,494
-11,632
3,138
– Gross Longs:
26,385
19,406
6,436
– Gross Shorts:
17,891
31,038
3,298
– Long to Short Ratio:
1.5 to 1
0.6 to 1
2.0 to 1
NET POSITION TREND:
– Strength Index Score (3 Year Range Pct):
20.5
81.4
10.3
– Strength Index Reading (3 Year Range):
Bearish
Bullish-Extreme
Bearish-Extreme
NET POSITION MOVEMENT INDEX:
– 6-Week Change in Strength Index:
20.5
-18.6
-6.1
Palladium Futures:
The Palladium Futures large speculator standing this week came in at a net position of -1,209 contracts in the data reported through Tuesday. This was a weekly fall of -455 contracts from the previous week which had a total of -754 net contracts.
This week’s current strength score (the trader positioning range over the past three years, measured from 0 to 100) shows the speculators are currently Bearish-Extreme with a score of 16.4 percent. The commercials are Bullish-Extreme with a score of 82.3 percent and the small traders (not shown in chart) are Bearish with a score of 30.3 percent.
Palladium Futures Statistics
SPECULATORS
COMMERCIALS
SMALL TRADERS
– Percent of Open Interest Longs:
26.3
58.3
14.3
– Percent of Open Interest Shorts:
44.1
37.1
17.8
– Net Position:
-1,209
1,444
-235
– Gross Longs:
1,793
3,968
975
– Gross Shorts:
3,002
2,524
1,210
– Long to Short Ratio:
0.6 to 1
1.6 to 1
0.8 to 1
NET POSITION TREND:
– Strength Index Score (3 Year Range Pct):
16.4
82.3
30.3
– Strength Index Reading (3 Year Range):
Bearish-Extreme
Bullish-Extreme
Bearish
NET POSITION MOVEMENT INDEX:
– 6-Week Change in Strength Index:
2.3
-4.0
16.9
Article By InvestMacro – Receive our weekly COT Newsletter
*COT Report: The COT data, released weekly to the public each Friday, is updated through the most recent Tuesday (data is 3 days old) and shows a quick view of how large speculators or non-commercials (for-profit traders) were positioned in the futures markets.
The CFTC categorizes trader positions according to commercial hedgers (traders who use futures contracts for hedging as part of the business), non-commercials (large traders who speculate to realize trading profits) and nonreportable traders (usually small traders/speculators) as well as their open interest (contracts open in the market at time of reporting). See CFTC criteria here.
Frontier Lithium Inc. announced the latest group of drill results from its Spark Deposit in northwestern Ontario. The firm reported it intersected 326.6m of pegmatite averaging 1.92% lithium oxide (Li2O), which included a 50m high-grade zone of 2.98% Li2O. Canaccord Genuity Corp. (Canada) advised in a research update that the positive results achieved in Frontier’s Phase XII drill program once again demonstrate grades that are well above the current mineral resource estimate of 1.38% Li2O.
The firm’s 100%-owned PAK Lithium Project contains two delineated premium spodumene-bearing lithium deposits known as the Spark and the PAK deposits. The company stated that through September 11, 2022, it has drilled a total of 11,150 meters (m) across 34 holes during its Phase XII delineation and infill drilling program and indicated that the data it just released pertains to results from four holes drilled at Spark.
Canaccord Genuity Corp. (Canada) Analyst Katie Lachapelle, CPA, commented, “We continue to be impressed by the positive results from the Phase XII drill program.”
The firm said that these four additional drill holes targeting the Spark Deposit were designed to “convert inferred material to the indicated category for the planned open pit.”
Frontier highlighted that Hole DDH PL-065-22 intersected 171.5m of pegmatite averaging 1.57% lithium oxide (Li2O), and Hole PL-062-22 returned 19.2m of 2.88% Li2O, 2.23% cesium oxide (Cs2O) and 513 ppm (parts per million) tantalum pentoxide (Ta2O5).
The firm indicated that Hole DDH PL-067-22, which was drilled with the goal of converting inferred material at depth, intercepted 326.6m of pegmatite averaging 1.92% Li2O, including a section of 50m averaging 2.98% Li2O.
Two other holes, DDH PL-069-22 and DDH PL-072-22, intersected 275.3m of pegmatite, averaging 1.74% Li2O, and 124.1m of pegmatite, averaging 1.55% Li2O, respectively.
The company’s V.P. of Exploration Garth Drever remarked, “After tripling the meters drilled since the Resource update in March 2021 and targeting the Inferred, it is safe to say that the model remains robust and there will be substantial new Inferred.”
Drever noted that “the Spark deposit remains open in all directions with predictable grades and widths” and added that he is “extremely pleased with the drilling results to date.”
Lachappel commented, “The consistency of Frontier’s high-grade hits leads us to believe that there is a strong likelihood that the company will report an indicated resource with a higher overall grade. We also expect the updated mineral resource to include new inferred material, with drilling indicating that the Spark deposit is still open in all directions.”
In an October 11, 2022 research note, Canaccord Genuity Corp. (Canada) Analyst Katie Lachapelle, CPA, commented, “We continue to be impressed by the positive results from the Phase XII drill program, which continue to demonstrate grades well above the current mineral resource estimate (1.38% Li2O).”
The analyst emphasized this is evidenced by these latest results, which all returned significant widths averaging 1.55%, 1.57%, 1.74%, and 1.92% Li2O.
The report mentioned that the PAK Lithium Project encompasses nearly 27,000 ha (hectares) and “contains North America’s highest grade lithium resource that is top three in size on the continent and is considered premium quality globally as a result of its rare low-iron spodumene.” The PAK Project hosts a Measured and Indicated resource of 21.64 Mt (million tonnes) averaging 1.56% Li2O and an Inferred resource of 20.87 Mt averaging 1.42% Li2O.
As outlined in an N-43-101 compliant technical report issued on April 5, 2021, the plans for the Pak Project include “a fully integrated lithium operation from the resource to achieve downstream conversion plan for [the] production of battery-quality lithium salts.” The report estimated that the property had an after-tax net present value (NPV) of US$974M (million) with an internal rate of return (IRR) of 21%.
In addition, two other spodumene-bearing discoveries have been made within the confines of the PAK property, including the Bolt pegmatite and Pennock pegmatite areas.
The Catalyst
Frontier Lithium advised in its most recent news release that it is currently utilizing a phased approach to preparing a Preliminary Feasibility Study (PFS), which should be ready in Q1/23. The company indicated that during Phase 1, it will focus on mine advancement and mill development with the objective of producing premium-grade spodumene concentrates.
Canaccord presently maintains a “Speculative Buy” rating and a CA$4.75 per share target price for Frontier Lithium Inc. This target price is a 114.932% increase from the current price of CA$2.21.
During Phase 2, the firm said it will concentrate its efforts on raising mine and mill production volumes in order to supply its downstream refinery with materials needed to produce lithium chemicals intended for use in the energy storage and electric vehicle (EV) battery market.
The completion and delivery of the PFS may prove to be a positive catalyst going forward. In the October 11, 2022 research note, Canaccord Analyst Lachapelle stated that strong existing and future demand for concentrate provides a solid basis for a phased approach to development.
Lachappel commented, “The consistency of Frontier’s high-grade hits leads us to believe that there is a strong likelihood that the company will report an indicated resource with a higher overall grade. We also expect the updated mineral resource to include new inferred material, with drilling indicating that the Spark deposit is still open in all directions.”
Lachapelle noted that “Frontier Lithium currently trades at 0.48x NAV (net asset value), which we believe is an attractive discount to peers at 0.64x NAV.” Canaccord presently maintains a “Speculative Buy” rating and a CA$4.75 per share target price for Frontier Lithium Inc. This target price is a 114.932% increase from the current price of CA$2.21.
Resource Expansion Potential
Recent drill results show room for further resource growth at the company’s Electric Avenue District property.
Frontier Lithium’s V.P. of Exploration Garth Drever commented, “Our modeling beneath the central indicated resource appears solid, and drilling to the west continues to intersect significant pegmatite zones, and the Spark deposit remains open in all directions and zones of elevated tantalum and cesium along with lithium are being delineated.”
Lachapelle pointed out that Canaccord’s valuation for Frontier was predicated upon the extraction and processing of material produced by only a 23Mt resource, which is far below the firm’s total current resource, which has grown to 42Mt grading 1.54% Li2O and “is among the largest in North America and highest grade.”
Lachapelle continued, “Based on the consistency of infill drilling to date, we expect the majority of Frontier’s existing mineral resource at Spark to be upgraded and included in the mine plan in the future, which could result in a mine life extension of ~14-18 years (18Mt currently included in our mine plan; 32Mt current resource, ~1Mtpa processing).”
Company Operations
Frontier Lithium is a lithium exploration and development company based in Sudbury, Ont., Canada. The company is focused on the development and production of battery-grade lithium hydroxide and lithium salts for the North American EV battery and energy storage markets. Its wholly owned PAK Lithium Project is located in the premier Electric Avenue lithium mining district in northwestern Ontario.
The PAK project includes the PAK Deposit, which has a Measured, Indicated, and Inferred resource of 9.3 MT averaging 2.06% Li2O, and the larger Spark Deposit, which is located just 2.3 km away from PAK and has an estimated Indicated resource of 14.4 MT averaging 1.40% Li2O and an Inferred resource of 18.1 MT averaging 1.37% Li2O.
The property hosts what is believed to be one of the highest-grade large-tonnage hard rock lithium resources in North America. The company’s plans call for “a fully integrated operation from open pit mining through to chemical production (LiOH, 23kt per year).”
Share Structure, Ownership, and Coverage
Frontier Lithium has a diversified investor base. In aggregate, the firm’s management, directors, and advisors own about 25% of the company’s total outstanding shares. Institutional and private investors together account for about 20%, and the remaining 55% is owned by public shareholders.
The company has a market cap of CA$462.26 million with 213.02 million shares outstanding, and the firm’s shares trade in a 52-week range between CA$0.88 and CA$3.89.
Currently, Frontier Lithium is covered by Analyst Katie Lachapelle of Canaccord Genuity and newsletter writers Christ Temple and Clive Maund. Please click “See More Live Data” in the data box above to view more coverage.
Frontier Lithium Inc.’s shares trade on the TSX Venture Exchange under the symbol “FL” and last closed for trading at CA$2.17/share on October 18, 2022. The company’s shares are also listed in the U.S. on the OTCQX under the symbol “LITOF” and under the designation “HL2” on the Frankfort Stock Exchange in Germany.
Disclosures: 1) Stephen Hytha wrote this article for Streetwise Reports LLC and provides services to Streetwise Reports as an independent contractor. He or members of his household own securities of the following companies mentioned in the article: None. He or members of his household are paid by the following companies mentioned in this article: None.
2) The following companies mentioned in this article are billboard sponsors of Streetwise Reports: Frontier Lithium Inc. Click here for important disclosures about sponsor fees. As of the date of this article, an affiliate of Streetwise Reports has a consulting relationship with None. Please click here for more information. The information provided above is for informational purposes only and is not a recommendation to buy or sell any security.
3) Comments and opinions expressed are those of the specific experts and not of Streetwise Reports or its officers. The information provided above is for informational purposes only and is not a recommendation to buy or sell any security.
4) This article does not constitute investment advice. Each reader is encouraged to consult with his or her individual financial professional and any action a reader takes as a result of information presented here is his or her own responsibility. By opening this page, each reader accepts and agrees to Streetwise Reports’ terms of use and full legal disclaimer. This article is not a solicitation for investment. Streetwise Reports does not render general or specific investment advice and the information on Streetwise Reports should not be considered a recommendation to buy or sell any security. Streetwise Reports does not endorse or recommend the business, products, services or securities of any company mentioned on Streetwise Reports.
5) From time to time, Streetwise Reports LLC and its directors, officers, employees or members of their families, as well as persons interviewed for articles and interviews on the site, may have a long or short position in securities mentioned. Directors, officers, employees or members of their immediate families are prohibited from making purchases and/or sales of those securities in the open market or otherwise from the time of the decision to publish an article until three business days after the publication of the article. The foregoing prohibition does not apply to articles that in substance only restate previously published company releases. As of the date of this article, officers and/or employees of Streetwise Reports LLC (including members of their household) own securities of Frontier Lithium Inc., a company mentioned in this article.
Here are the latest charts and statistics for the Commitment of Traders (COT) data published by the Commodities Futures Trading Commission (CFTC).
The latest COT data is updated through Tuesday October 11th and shows a quick view of how large traders (for-profit speculators and commercial entities) were positioned in the futures markets.
The COTprecious metals speculator bets were higher this week as three out of the five metals markets we cover had higher positioning this week while two markets had lower contracts.
Leading the gains for the precious metals markets was Gold (6,035 contracts) with Platinum (2,647 contracts) and Copper (2,352 contracts) also showing a positive week.
The metals markets leading the declines in speculator bets this week were Silver (-1,319 contracts) with Palladium (-158 contracts) also registering lower bets on the week.
Highlighting the metals COT markets this week is the Gold positioning that has rebounded slightly from the steep declines over the past couple of months. Gold speculator bets rose for a second straight week this week after seeing a decline in the previous seven straight weeks (a total drop of -90,770 speculator contracts over that period). The Gold position, on September 27th, had fallen to the lowest level in the past 179-weeks before rebounding over the past two weeks. Last week’s rise in speculator bets by over +36,000 contracts was the largest one-week increase since February 18th of 2020 and today’s speculator positioning is now back close to the +100,000 contract level. Gold prices, meanwhile, are currently trading just below the $1,650 support level after falling over 3 percent this week. The price decline is potentially setting up a new test of the 2-year lows under $1,620 that took place in late September.
Data Snapshot of Commodity Market Traders | Columns Legend
Oct-11-2022
OI
OI-Index
Spec-Net
Spec-Index
Com-Net
COM-Index
Smalls-Net
Smalls-Index
WTI Crude
1,499,498
3
259,220
13
-283,626
88
24,406
41
Gold
431,395
0
94,420
14
-103,728
87
9,308
3
Silver
125,623
0
7,389
22
-15,603
80
8,214
10
Copper
167,449
8
-15,899
24
16,903
80
-1,004
19
Palladium
6,890
5
-754
19
810
79
-56
41
Platinum
52,435
9
5,928
17
-8,690
85
2,762
5
Natural Gas
974,468
5
-162,103
30
130,099
72
32,004
56
Brent
163,113
11
-41,888
41
38,882
58
3,006
50
Heating Oil
275,262
25
19,423
71
-38,448
30
19,025
64
Soybeans
694,960
26
55,769
30
-30,614
77
-25,155
29
Corn
1,408,939
20
325,121
72
-258,225
35
-66,896
5
Coffee
188,198
3
40,534
73
-43,359
30
2,825
29
Sugar
687,209
0
101,115
57
-135,145
43
34,030
50
Wheat
307,901
9
-1,990
16
8,705
72
-6,715
76
Silver and Copper top the Strength Scores
Strength scores (a measure of the 3-Year range of Speculator positions, from 0 to 100 where above 80 is extreme bullish and below 20 is extreme bearish) showed that the Copper (23.7 percent) and Silver (22.3 percent) lead the metals this week.
On the downside, Gold (14.0 percent), Platinum (17.1 percent) and Palladium (19.1 percent) continue to be at the lower end of their range and are all in bearish extreme positions below 20 percent.
Strength Statistics: Gold (14.0 percent) vs Gold previous week (12.0 percent) Silver (22.3 percent) vs Silver previous week (23.7 percent) Copper (23.7 percent) vs Copper previous week (21.8 percent) Platinum (17.1 percent) vs Platinum previous week (13.5 percent) Palladium (19.1 percent) vs Palladium previous week (20.0 percent)
Strength Trends led Silver and Platinum
Strength Score Trends (or move index, calculates the 6-week changes in strength scores) show that the Silver (17.3 percent) and Platinum (15.2 percent) lead the past six weeks trends for metals this week. Copper (5.9 percent) and Palladium (2.2 percent) fill out the other positive movers in the latest trends data.
This leaves Gold (-7.7 percent) as the only negative mover over the past six weeks. Gold, however, has been seeing improvements in the past few weeks and is higher this week from -12.4 percent last week.
Move Statistics: Gold (-7.7 percent) vs Gold previous week (-12.4 percent) Silver (17.3 percent) vs Silver previous week (14.6 percent) Copper (5.9 percent) vs Copper previous week (0.6 percent) Platinum (15.2 percent) vs Platinum previous week (5.2 percent) Palladium (2.2 percent) vs Palladium previous week (6.9 percent)
Individual Markets:
Gold Comex Futures:
The Gold Comex Futures large speculator standing this week came in at a net position of 94,420 contracts in the data reported through Tuesday. This was a weekly gain of 6,035 contracts from the previous week which had a total of 88,385 net contracts.
This week’s current strength score (the trader positioning range over the past three years, measured from 0 to 100) shows the speculators are currently Bearish-Extreme with a score of 14.0 percent. The commercials are Bullish-Extreme with a score of 87.1 percent and the small traders (not shown in chart) are Bearish-Extreme with a score of 2.9 percent.
Gold Futures Statistics
SPECULATORS
COMMERCIALS
SMALL TRADERS
– Percent of Open Interest Longs:
49.3
26.2
8.6
– Percent of Open Interest Shorts:
27.4
50.2
6.4
– Net Position:
94,420
-103,728
9,308
– Gross Longs:
212,561
112,867
36,988
– Gross Shorts:
118,141
216,595
27,680
– Long to Short Ratio:
1.8 to 1
0.5 to 1
1.3 to 1
NET POSITION TREND:
– Strength Index Score (3 Year Range Pct):
14.0
87.1
2.9
– Strength Index Reading (3 Year Range):
Bearish-Extreme
Bullish-Extreme
Bearish-Extreme
NET POSITION MOVEMENT INDEX:
– 6-Week Change in Strength Index:
-7.7
8.0
-6.6
Silver Comex Futures:
The Silver Comex Futures large speculator standing this week came in at a net position of 7,389 contracts in the data reported through Tuesday. This was a weekly decrease of -1,319 contracts from the previous week which had a total of 8,708 net contracts.
This week’s current strength score (the trader positioning range over the past three years, measured from 0 to 100) shows the speculators are currently Bearish with a score of 22.3 percent. The commercials are Bullish-Extreme with a score of 80.5 percent and the small traders (not shown in chart) are Bearish-Extreme with a score of 10.1 percent.
Silver Futures Statistics
SPECULATORS
COMMERCIALS
SMALL TRADERS
– Percent of Open Interest Longs:
38.2
37.9
17.0
– Percent of Open Interest Shorts:
32.3
50.3
10.5
– Net Position:
7,389
-15,603
8,214
– Gross Longs:
47,939
47,603
21,347
– Gross Shorts:
40,550
63,206
13,133
– Long to Short Ratio:
1.2 to 1
0.8 to 1
1.6 to 1
NET POSITION TREND:
– Strength Index Score (3 Year Range Pct):
22.3
80.5
10.1
– Strength Index Reading (3 Year Range):
Bearish
Bullish-Extreme
Bearish-Extreme
NET POSITION MOVEMENT INDEX:
– 6-Week Change in Strength Index:
17.3
-15.0
1.0
Copper Grade #1 Futures:
The Copper Grade #1 Futures large speculator standing this week came in at a net position of -15,899 contracts in the data reported through Tuesday. This was a weekly gain of 2,352 contracts from the previous week which had a total of -18,251 net contracts.
This week’s current strength score (the trader positioning range over the past three years, measured from 0 to 100) shows the speculators are currently Bearish with a score of 23.7 percent. The commercials are Bullish-Extreme with a score of 80.1 percent and the small traders (not shown in chart) are Bearish-Extreme with a score of 19.5 percent.
Copper Futures Statistics
SPECULATORS
COMMERCIALS
SMALL TRADERS
– Percent of Open Interest Longs:
30.5
47.2
8.3
– Percent of Open Interest Shorts:
40.0
37.1
8.9
– Net Position:
-15,899
16,903
-1,004
– Gross Longs:
51,021
79,079
13,853
– Gross Shorts:
66,920
62,176
14,857
– Long to Short Ratio:
0.8 to 1
1.3 to 1
0.9 to 1
NET POSITION TREND:
– Strength Index Score (3 Year Range Pct):
23.7
80.1
19.5
– Strength Index Reading (3 Year Range):
Bearish
Bullish-Extreme
Bearish-Extreme
NET POSITION MOVEMENT INDEX:
– 6-Week Change in Strength Index:
5.9
-6.3
4.2
Platinum Futures:
The Platinum Futures large speculator standing this week came in at a net position of 5,928 contracts in the data reported through Tuesday. This was a weekly boost of 2,647 contracts from the previous week which had a total of 3,281 net contracts.
This week’s current strength score (the trader positioning range over the past three years, measured from 0 to 100) shows the speculators are currently Bearish-Extreme with a score of 17.1 percent. The commercials are Bullish-Extreme with a score of 85.1 percent and the small traders (not shown in chart) are Bearish-Extreme with a score of 5.3 percent.
Platinum Futures Statistics
SPECULATORS
COMMERCIALS
SMALL TRADERS
– Percent of Open Interest Longs:
46.4
38.0
12.5
– Percent of Open Interest Shorts:
35.0
54.6
7.2
– Net Position:
5,928
-8,690
2,762
– Gross Longs:
24,306
19,947
6,554
– Gross Shorts:
18,378
28,637
3,792
– Long to Short Ratio:
1.3 to 1
0.7 to 1
1.7 to 1
NET POSITION TREND:
– Strength Index Score (3 Year Range Pct):
17.1
85.1
5.3
– Strength Index Reading (3 Year Range):
Bearish-Extreme
Bullish-Extreme
Bearish-Extreme
NET POSITION MOVEMENT INDEX:
– 6-Week Change in Strength Index:
15.2
-11.8
-26.2
Palladium Futures:
The Palladium Futures large speculator standing this week came in at a net position of -754 contracts in the data reported through Tuesday. This was a weekly fall of -158 contracts from the previous week which had a total of -596 net contracts.
This week’s current strength score (the trader positioning range over the past three years, measured from 0 to 100) shows the speculators are currently Bearish-Extreme with a score of 19.1 percent. The commercials are Bullish with a score of 79.0 percent and the small traders (not shown in chart) are Bearish with a score of 40.6 percent.
Palladium Futures Statistics
SPECULATORS
COMMERCIALS
SMALL TRADERS
– Percent of Open Interest Longs:
29.7
53.1
16.2
– Percent of Open Interest Shorts:
40.7
41.3
17.1
– Net Position:
-754
810
-56
– Gross Longs:
2,049
3,656
1,119
– Gross Shorts:
2,803
2,846
1,175
– Long to Short Ratio:
0.7 to 1
1.3 to 1
1.0 to 1
NET POSITION TREND:
– Strength Index Score (3 Year Range Pct):
19.1
79.0
40.6
– Strength Index Reading (3 Year Range):
Bearish-Extreme
Bullish
Bearish
NET POSITION MOVEMENT INDEX:
– 6-Week Change in Strength Index:
2.2
-2.9
8.0
Article By InvestMacro – Receive our weekly COT Newsletter
*COT Report: The COT data, released weekly to the public each Friday, is updated through the most recent Tuesday (data is 3 days old) and shows a quick view of how large speculators or non-commercials (for-profit traders) were positioned in the futures markets.
The CFTC categorizes trader positions according to commercial hedgers (traders who use futures contracts for hedging as part of the business), non-commercials (large traders who speculate to realize trading profits) and nonreportable traders (usually small traders/speculators) as well as their open interest (contracts open in the market at time of reporting). See CFTC criteria here.
Shares of Gatos Silver Inc. traded 29% higher yesterday after the company reported it achieved record levels of production at its Cerro Los Gatos mine during Q3/22. The firm raised its FY/22 production guidance while lowering its operating cost estimates.
After U.S. markets closed Tuesday, silver explorer, developer, and producer Gatos Silver Inc. (GATO:TSX; GATO:NYSE)announced “record production results from its 70%-owned Cerro Los Gatos (CLG) mine for the quarter and nine months ended September 30, 2022.”
The company highlighted that in Q3/22, silver production at GLG increased by 59% to 2.7 Moz Ag (million ounces silver), compared to 1.7 Moz Ag in Q3/21.
The firm advised that due to the positive results it achieved in Q3/22, it is raising its FY/22 production guidance and, at the same time, is lowering its FY/22 cost guidance.
Gatos Silver’s CEO Dale Andres stated, “Our continued strong operating performance at CLG during the quarter reflects planned production sequencing, with mill throughput exceeding design capacity by 15% and with higher ore grades compared with a year earlier.”
Gatos Silver raised its forward silver production guidance at the CLG mine by 9.2% over its previous estimates and advised that for FY/22, it expects the mine to produce 9.35-9.65 Moz Ag (silver), compared to its prior projections of 8.50-9.0 Moz Ag.
“Our priority exploration and definition drilling objectives are to extend our mine life by converting the higher-grade portion of our current Mineral Resource into Reserves and to follow up on the mineralization recently discovered at depth in the new South-East Deeps zone while assessing its potential implications for the entire Los Gatos district, Andres added.”
In addition to the record silver production mentioned above, during Q3/22, the GLG mine also registered record production of both lead and zinc. Zinc production increased by 32% year-over-year to 17.8 Mlb (million pounds), and lead production rose 13% y-o-y to 12.2 Mlb.
The company explained that the gains in production were attributed to record amounts of higher-grade material processed at the mill, which averaged 2,862 tpd (tonnes per day). The firm stated that it expects to process the same volumes but of somewhat lower-grade ore in Q4/22 as the highest-grade sections of the orebody were milled in Q3/22.
The company said that in Q3/22, it completed a fourth lift of the tailings dam and indicated that the construction of its paste plant is nearly finished. These events are expected to increase productivity and lower operating costs beginning in Q4/22.
Gatos Silver raised its forward silver production guidance at the CLG mine by 9.2% over its previous estimates and advised that for FY/22, it expects the mine to produce 9.35-9.65 Moz Ag (silver), compared to its prior projections of 8.50-9.0 Moz Ag.
The company added that it is also raising its estimates for gold (Au), lead (Pb), and zinc (Zn) concentrates production by even higher per percentages and stated that for FY/22, it expects to produce 5.0-5.3 Koz Au (thousand ounces gold), 43-45 Mlb Pb (million pounds lead), and 58-61 Mlb Zn.
The firm pointed out that while it is increasing production, it is now incurring lower total operating expenses and now expects FY/22 all-in-sustaining costs (AISC) to decrease by about 14% compared to prior forecasts. The company said that for FY/22, it expects AISC on a co-product basis of $15.50-16.50 per Ag eq oz. Gatos added that AISC for payable silver ounces produced is expected to be even lower at $11.50 -12.50 per Ag eq oz.
The firm advised that it estimates that for FY/22, it will have total sustaining capital expenditures in the amount of $75 million.
Gatos Silver mentioned that after it finishes construction of its paste plant in Q4/22, it expects that all-in –sustaining costs (AISC) will fall substantially throughout FY/23. In addition, there are no large expenses projected for tailings dam construction in FY/23, which will also lower overall expenses.
The company noted that, as it previously announced, it is proceeding with its plans to move its executive offices to Vancouver, B.C., from Denver, Colo., and expects to complete the transition in Q4/22.
The firm indicated that as of September 30, 2022, the Los Gatos Joint Venture (LGJV) had a cash balance of $39 million, compared to $40 million on June 30, 2022. In addition, the company advised that because of the CLG mine’s strong operating performance in Q3/22, it received its second quarterly dividend from the LGJV in the amount of $10 million.
The company stated that last week “it announced an updated CLG Mineral Reserve Estimate, Mineral Resource Estimate and Life of Mine plan and expects to produce a new technical report at the end of October 2022.”
Gatos Silver reiterated that, as it advised in a prior news release, it is presently working to find a licensed auditor in B.C., Canada, to perform an audit and complete a review of its financial statements. The firm indicated that it anticipates that at least one material issue may exist and will take the necessary steps to remedy any items discovered in the audit process as soon as practicable.
Specifically, the company advised that “it anticipates completing an impairment assessment based on the 2022 Mineral Reserve in Q4/22 and is working towards completing all outstanding SEC and OSC filings as soon as practicable.”
Gatos Silver is focused on exploration, development, and production at the Cerro Los Gatos deposit in the State of Chihuahua, Mexico, in which it owns a 70% interest through a joint venture. The property encompasses about 103,087 ha and is highly prospective for mining silver, zinc, lead, and some gold.
Gatos Silver started yesterday with a market cap of around $178.4 million, with approximately 69.1 million shares outstanding and a short interest of about 2.4%. GATO shares opened 8% higher yesterday at $2.79 (+$0.21, +8.14%) over the previous day’s $2.58 closing price. The stock traded between $2.78 and $3.43 per share and closed for trading at $3.33 (+$0.78, +29.07%).
Disclosures: 1) Stephen Hytha wrote this article for Streetwise Reports LLC and provides services to Streetwise Reports as an independent contractor. He or members of his household own securities of the following companies mentioned in the article: None. He or members of his household are paid by the following companies mentioned in this article: None.
2) The following companies mentioned in this article are billboard sponsors of Streetwise Reports: None. Click here for important disclosures about sponsor fees.
3) Comments and opinions expressed are those of the specific experts and not of Streetwise Reports or its officers. The information provided above is for informational purposes only and is not a recommendation to buy or sell any security.
4) The article does not constitute investment advice. Each reader is encouraged to consult with his or her individual financial professional and any action a reader takes as a result of information presented here is his or her own responsibility. By opening this page, each reader accepts and agrees to Streetwise Reports’ terms of use and full legal disclaimer. This article is not a solicitation for investment. Streetwise Reports does not render general or specific investment advice and the information on Streetwise Reports should not be considered a recommendation to buy or sell any security. Streetwise Reports does not endorse or recommend the business, products, services or securities of any company mentioned on Streetwise Reports.
5) From time to time, Streetwise Reports LLC and its directors, officers, employees or members of their families, as well as persons interviewed for articles and interviews on the site, may have a long or short position in securities mentioned. Directors, officers, employees or members of their immediate families are prohibited from making purchases and/or sales of those securities in the open market or otherwise from the time of the decision to publish an article until three business days after the publication of the article. The foregoing prohibition does not apply to articles that in substance only restate previously published company releases.

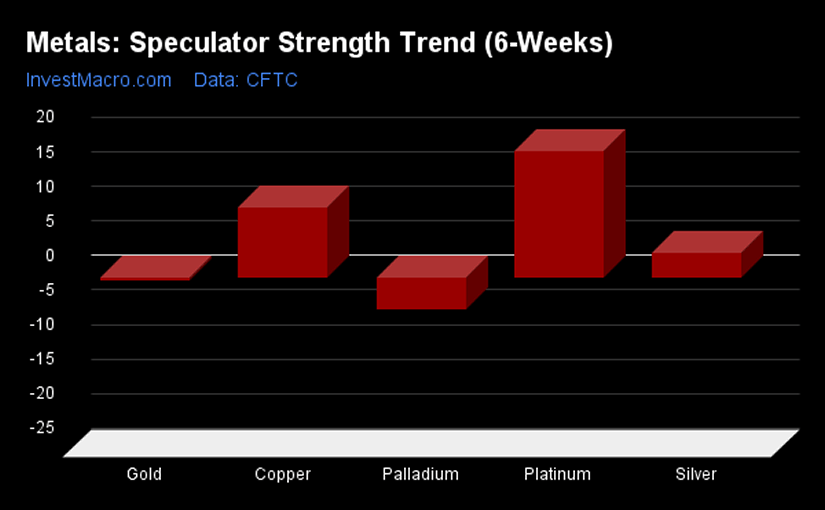

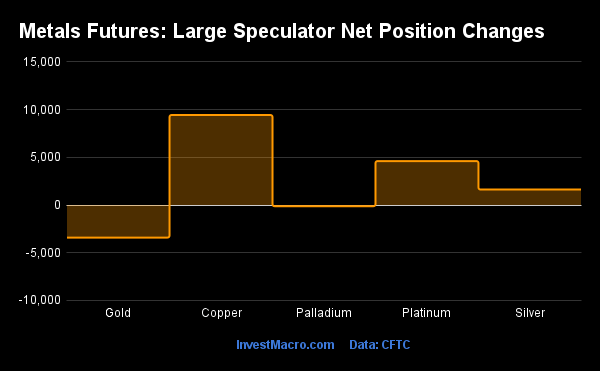
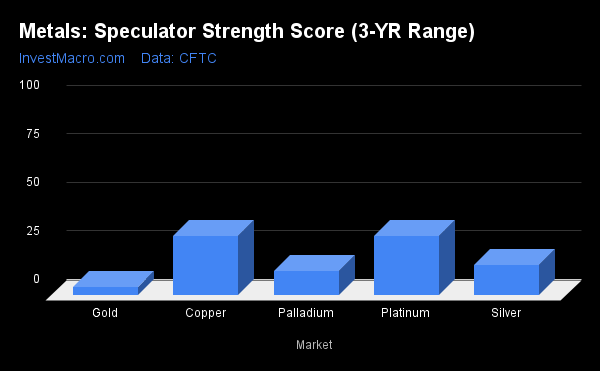

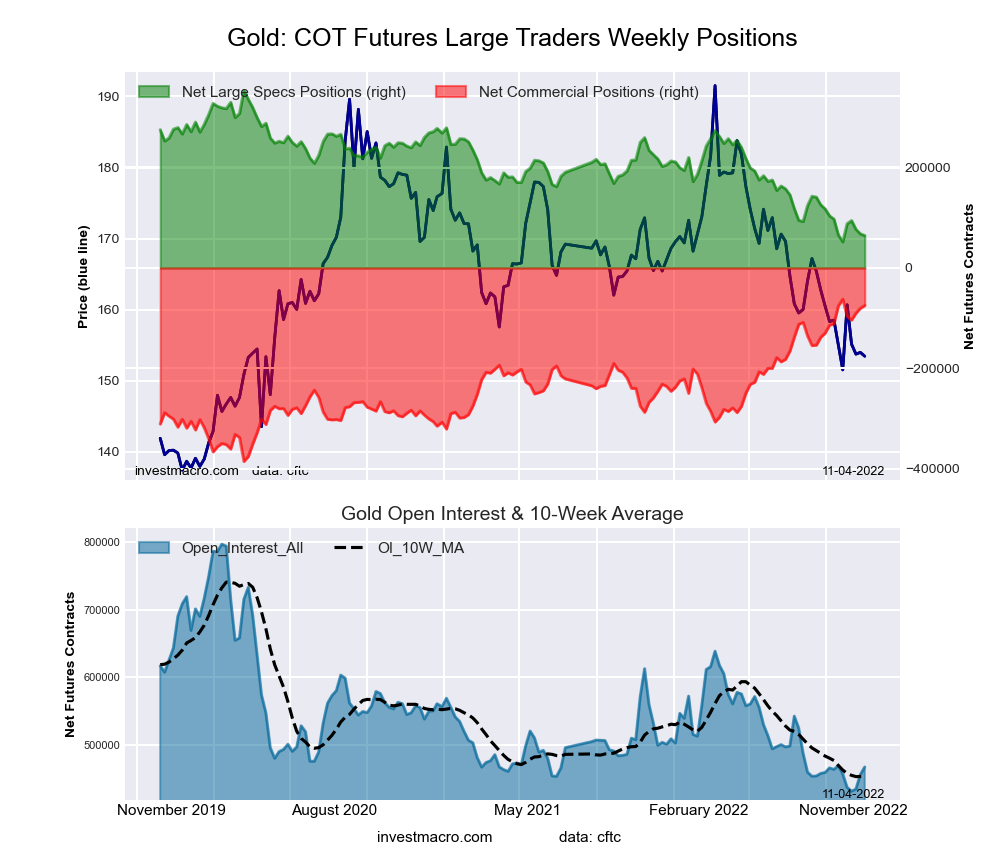
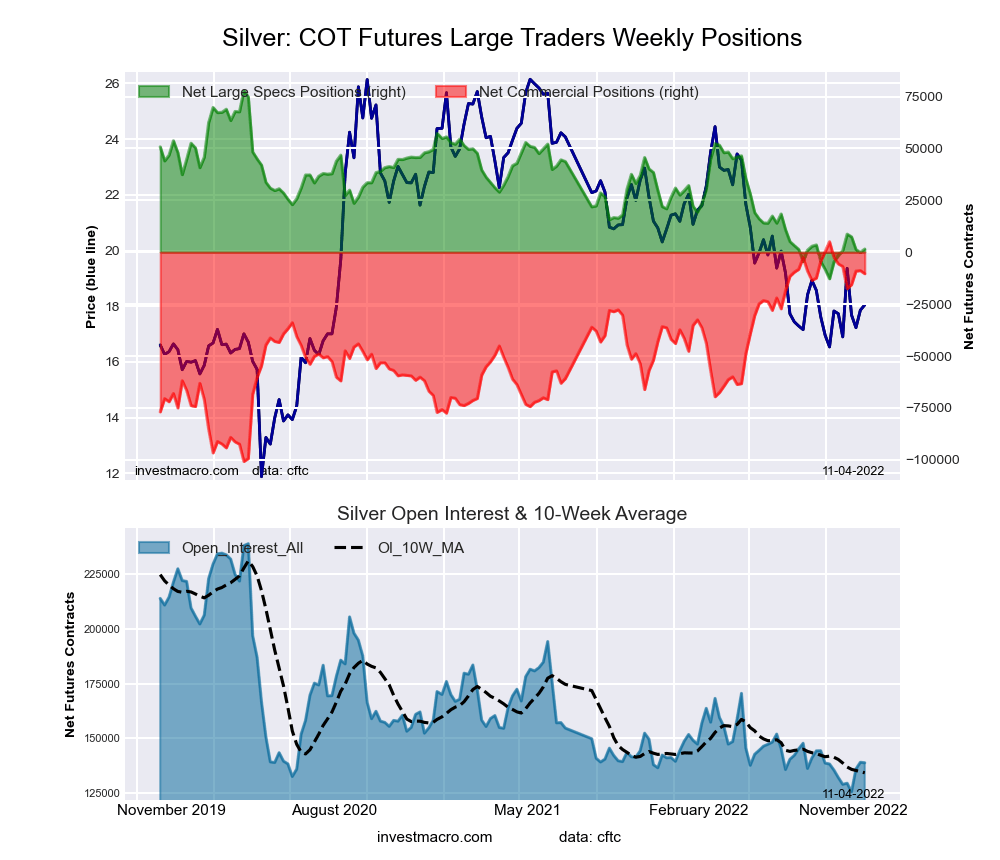
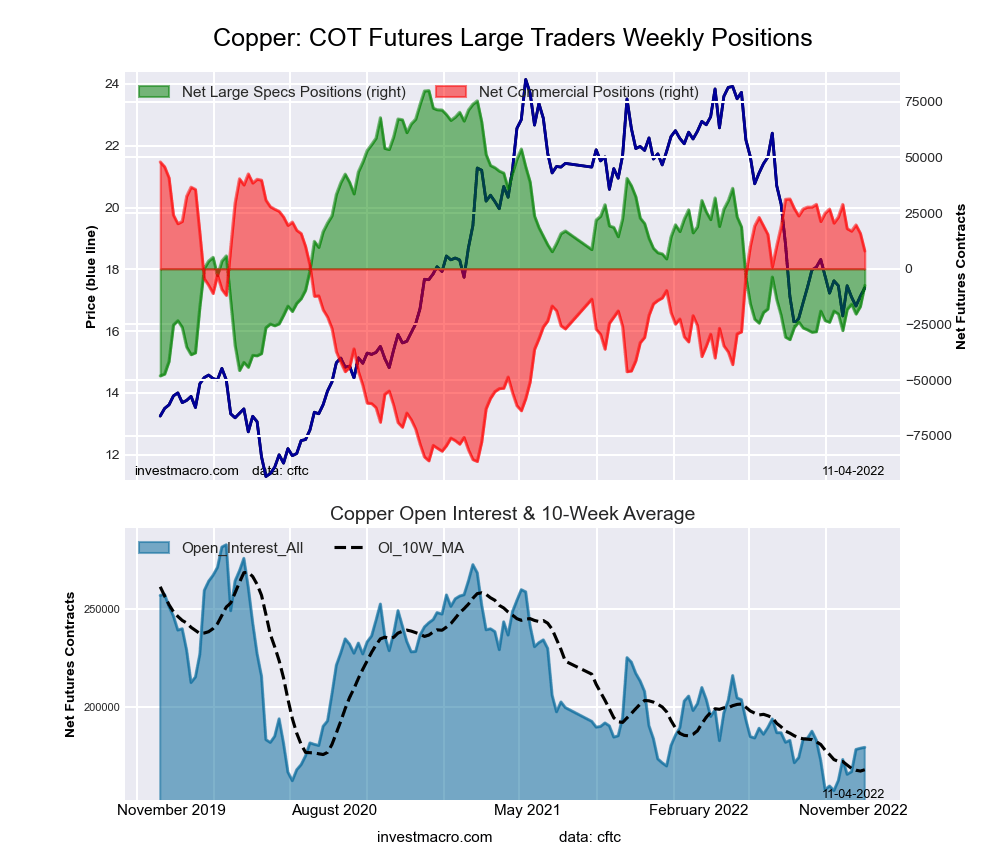
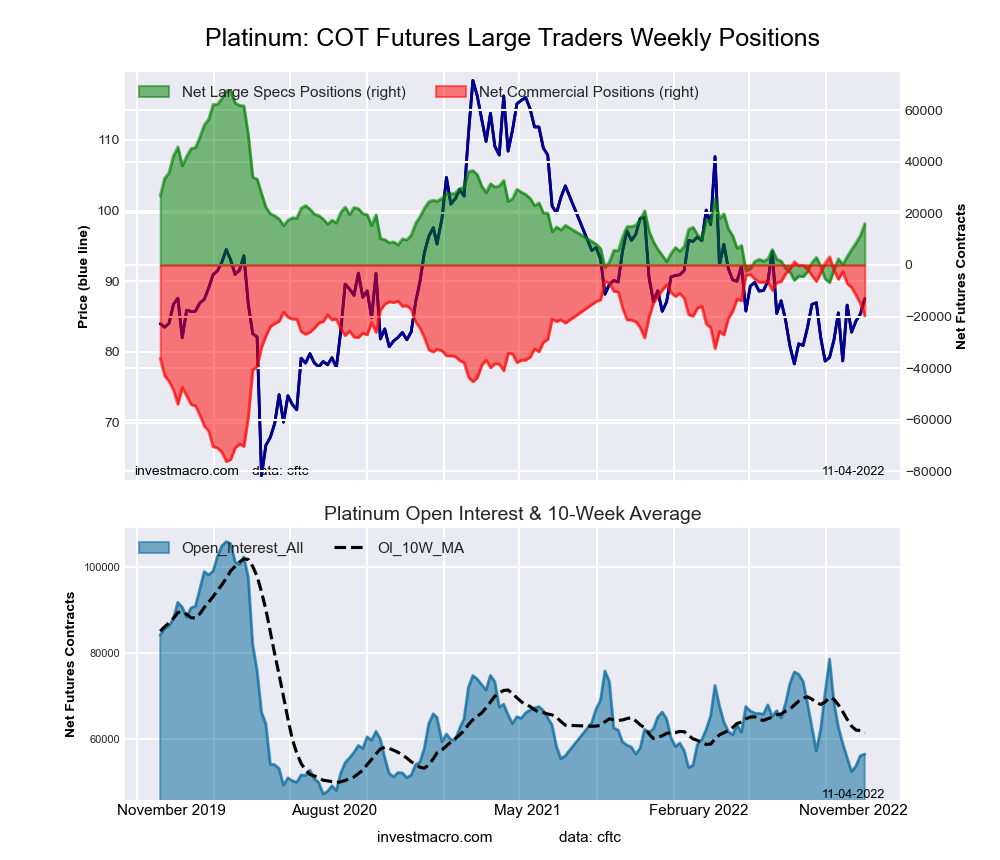

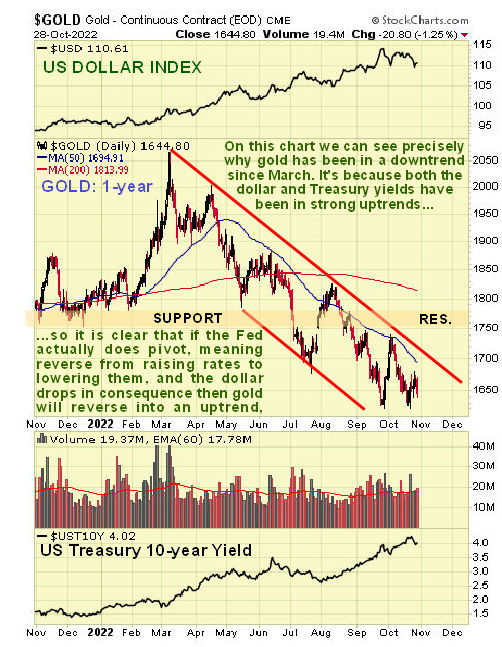
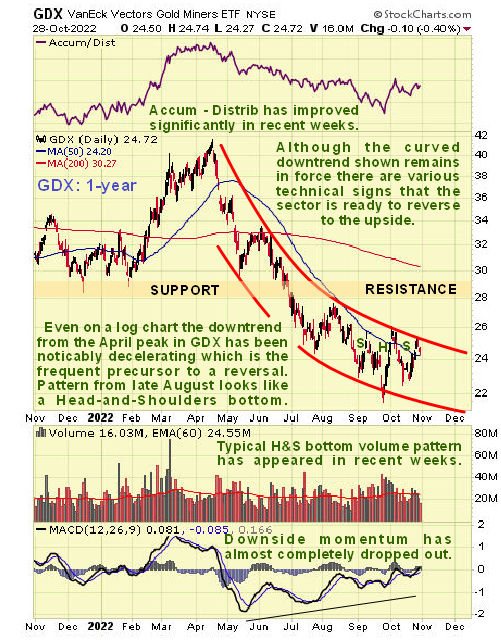
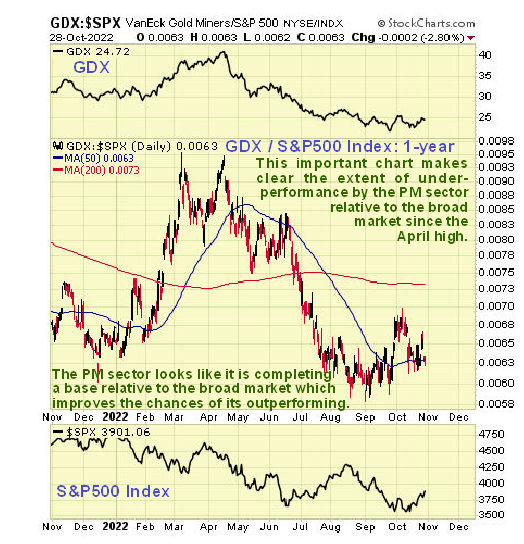
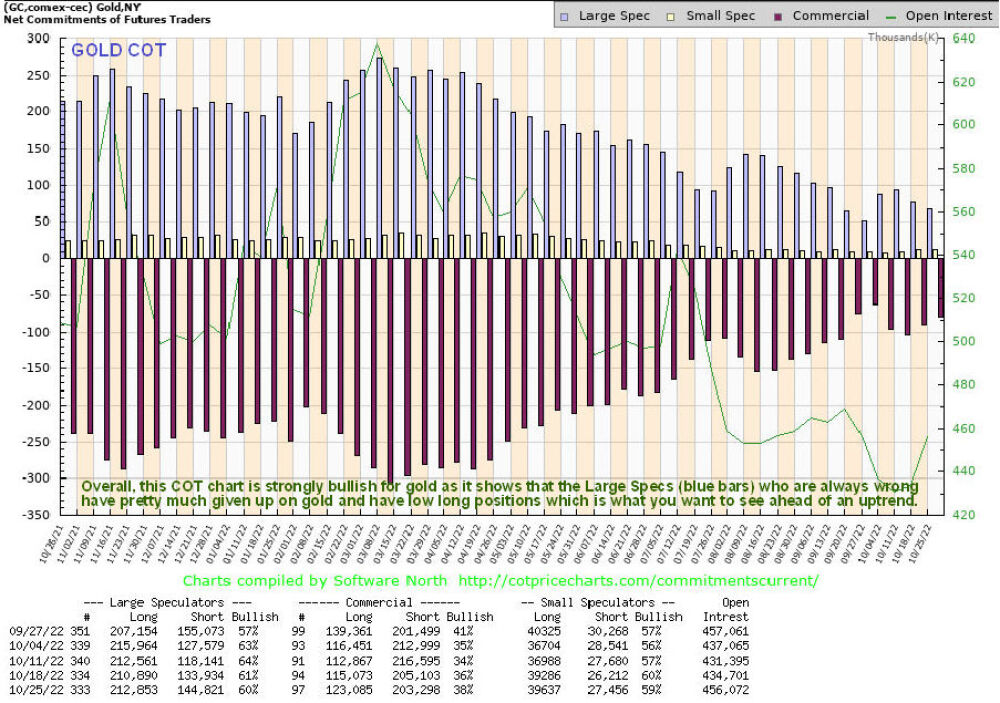
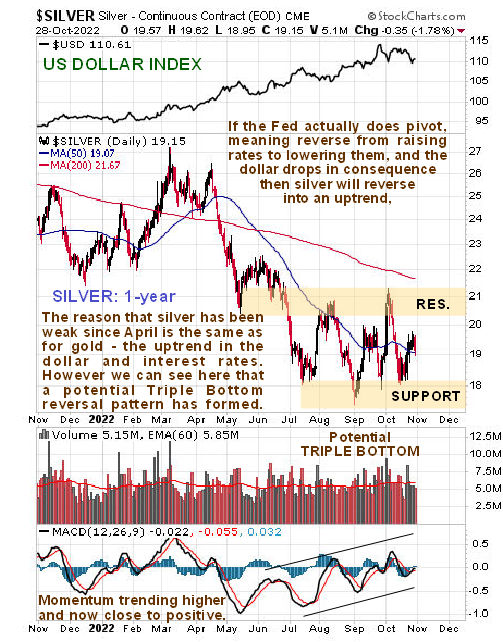
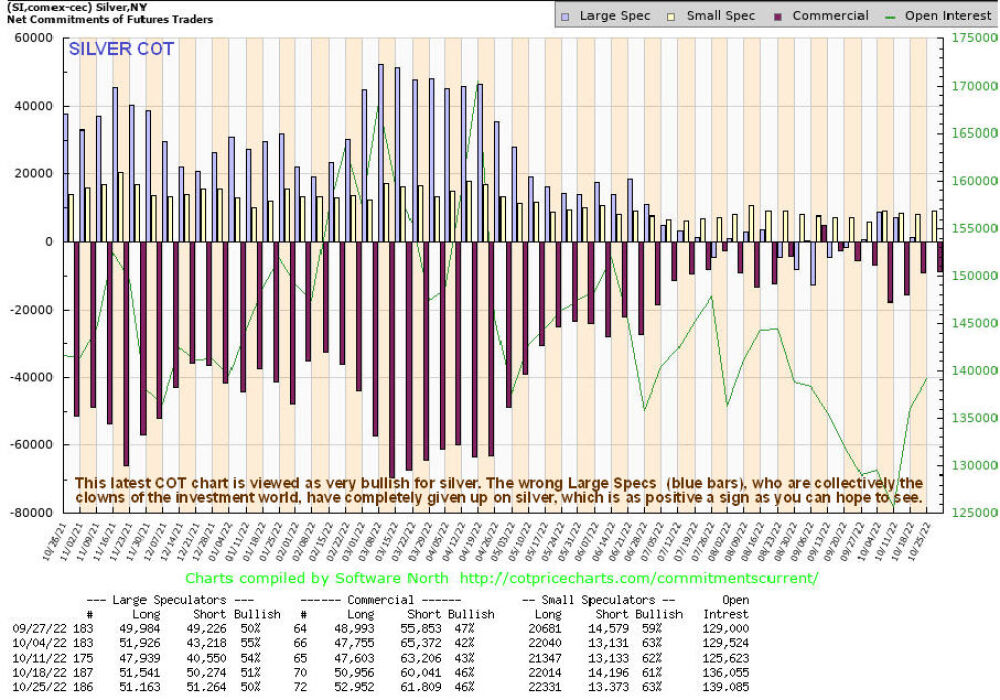
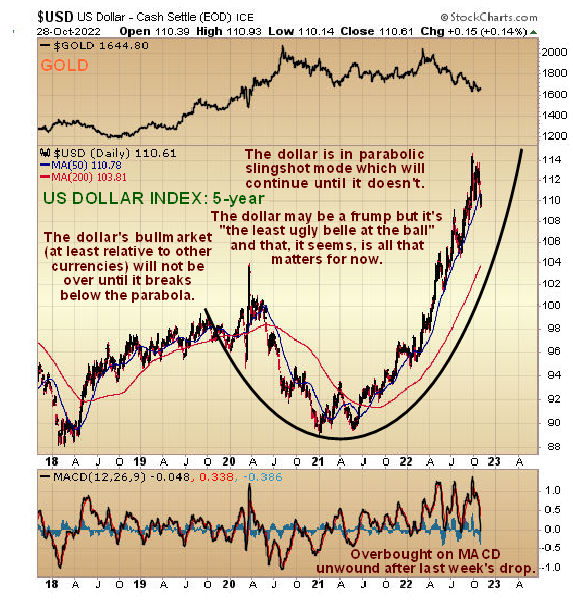
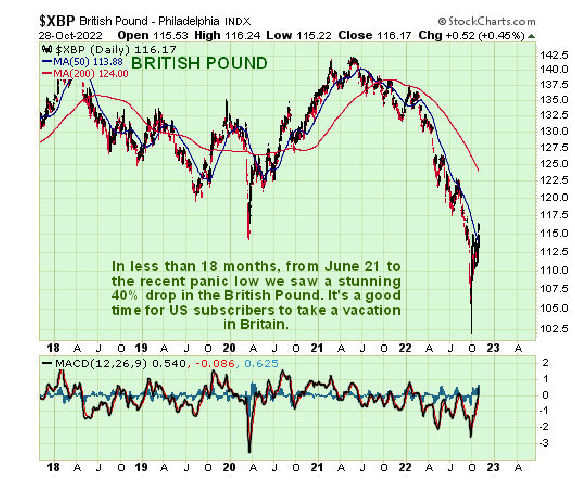


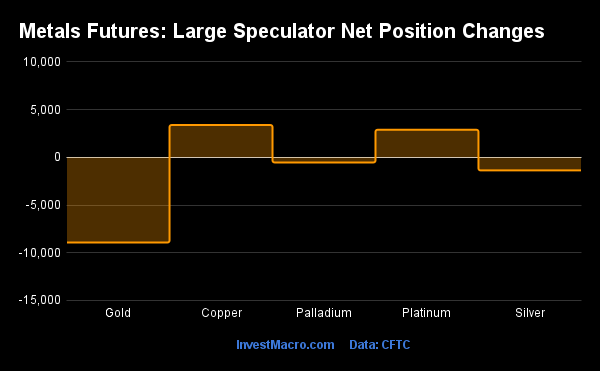
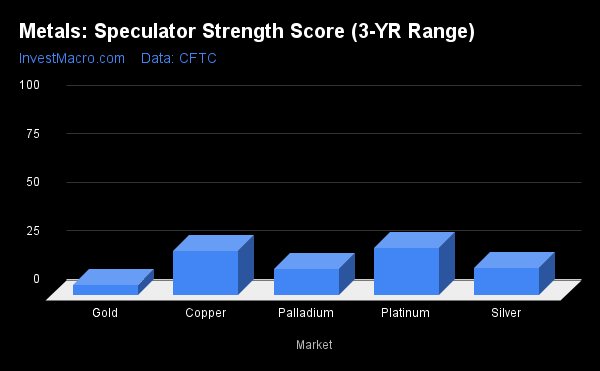
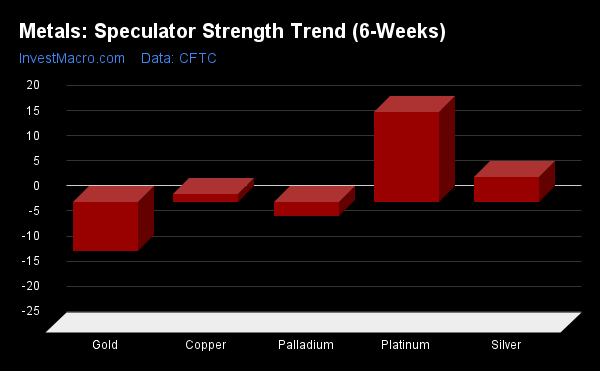
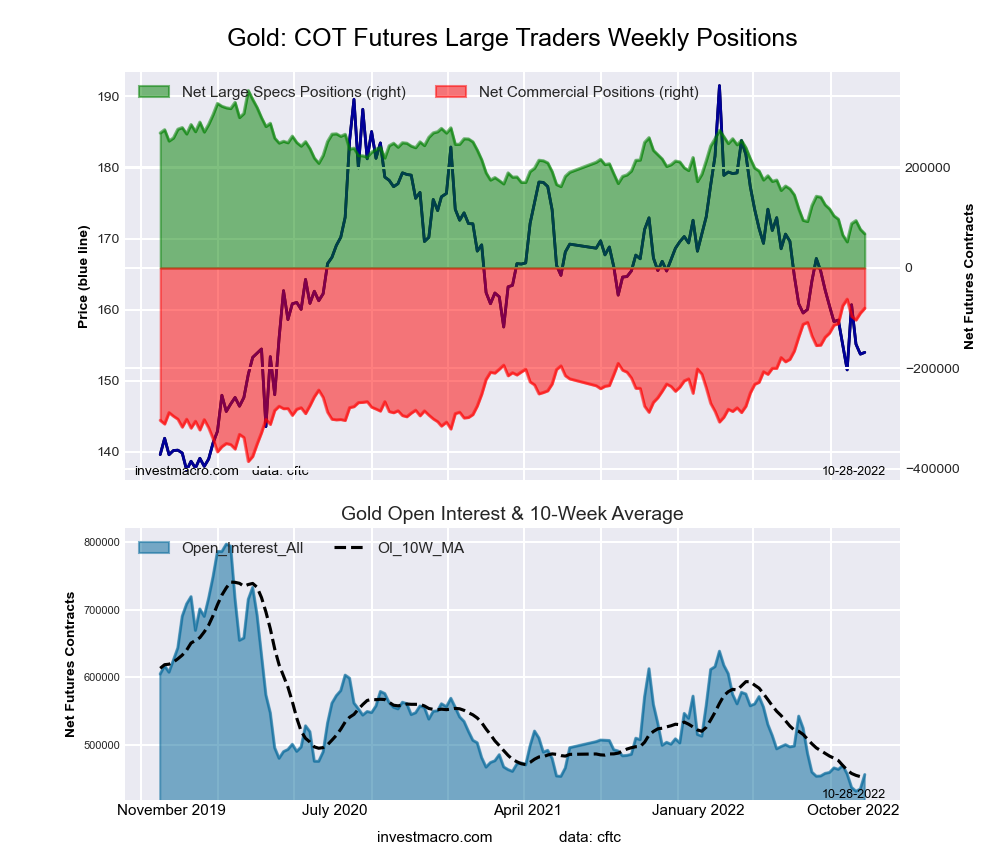


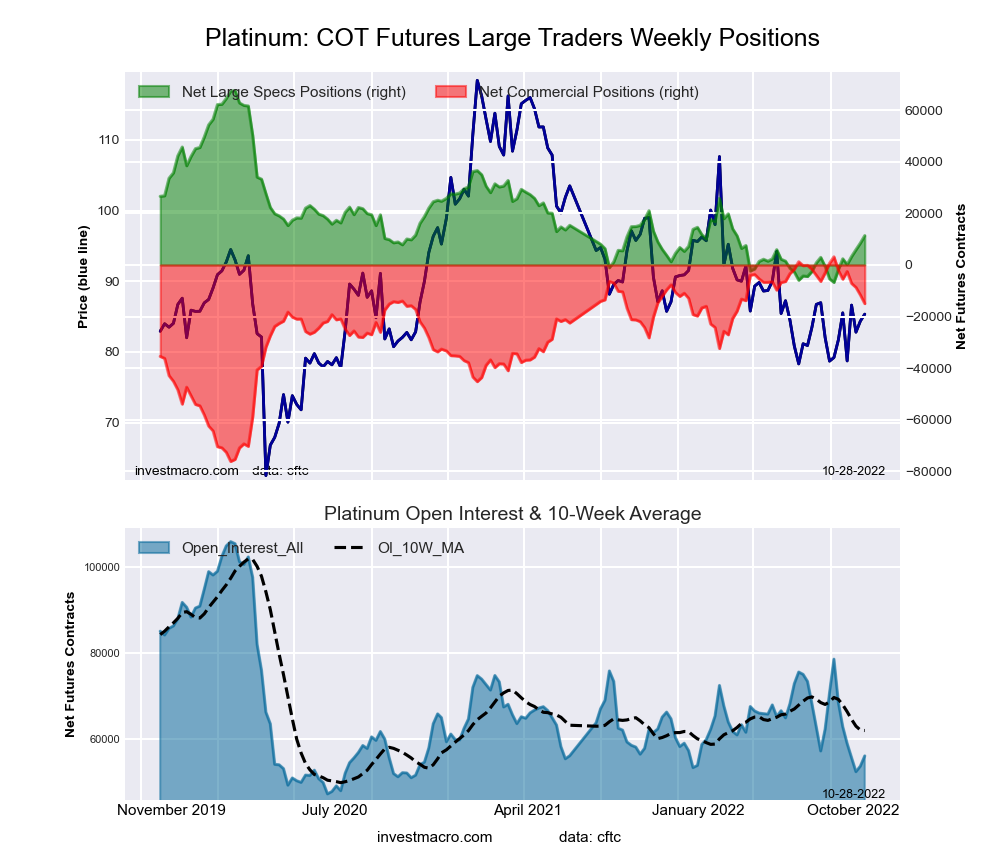
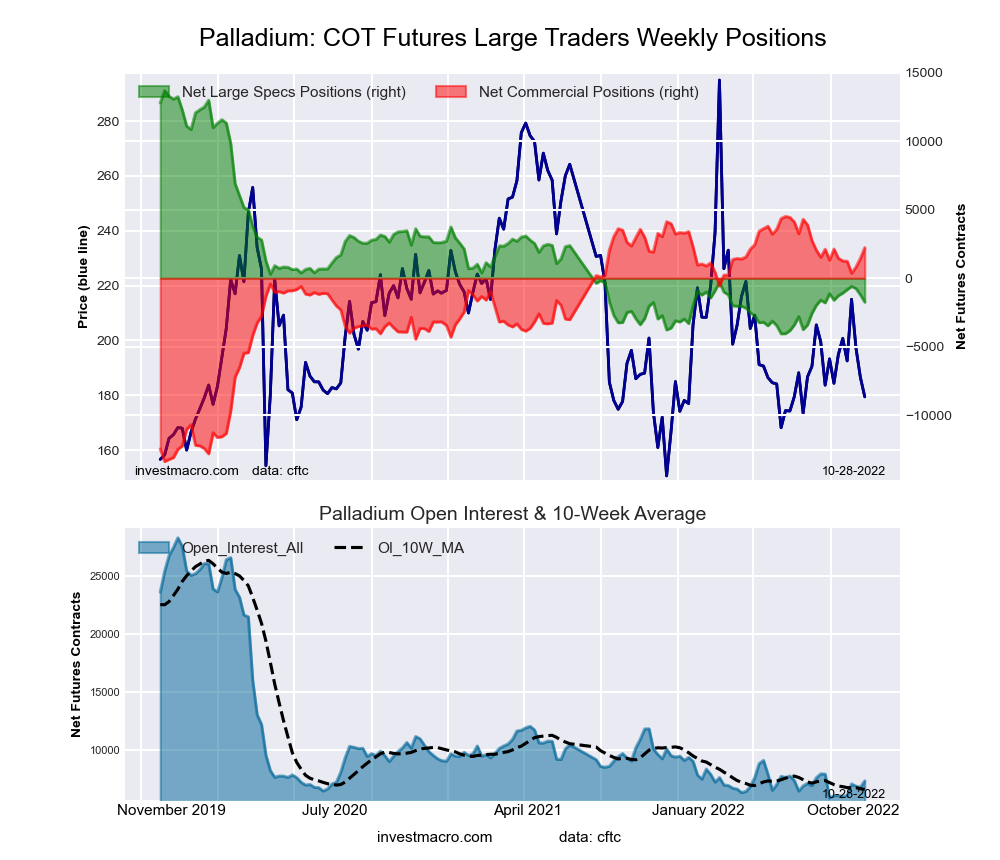

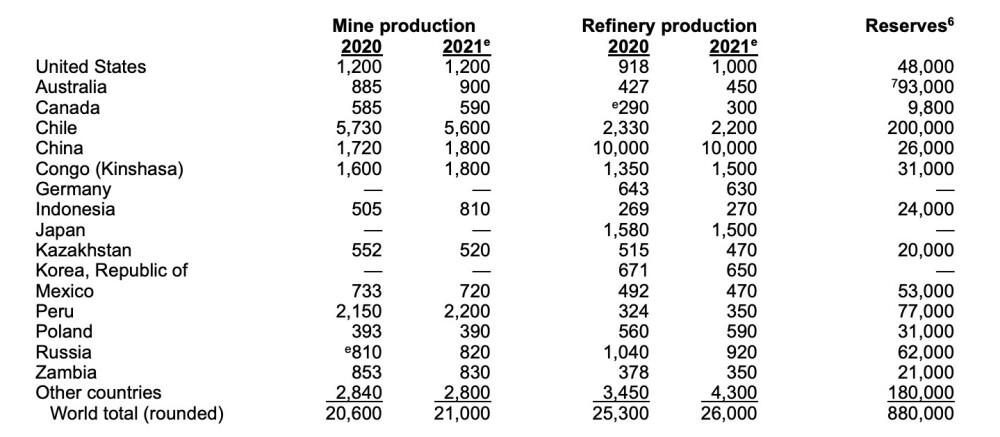
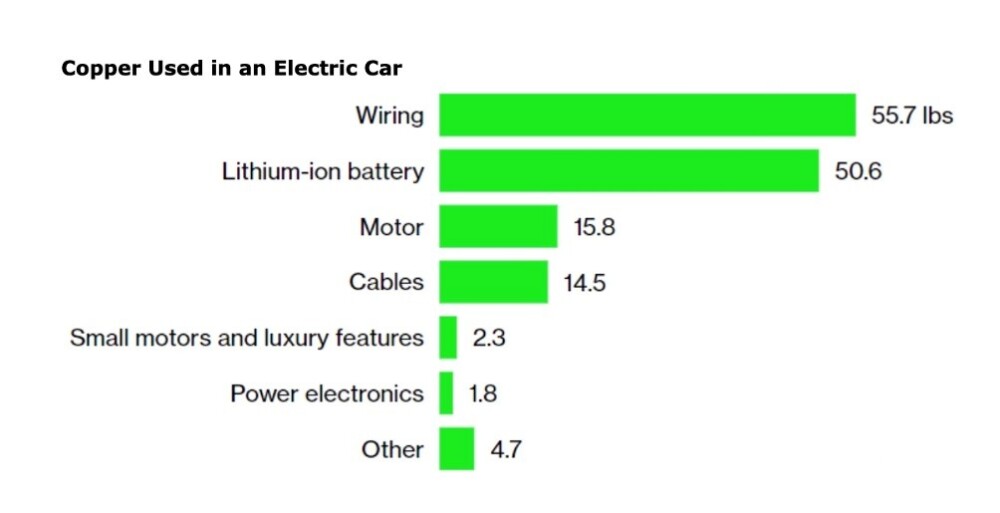
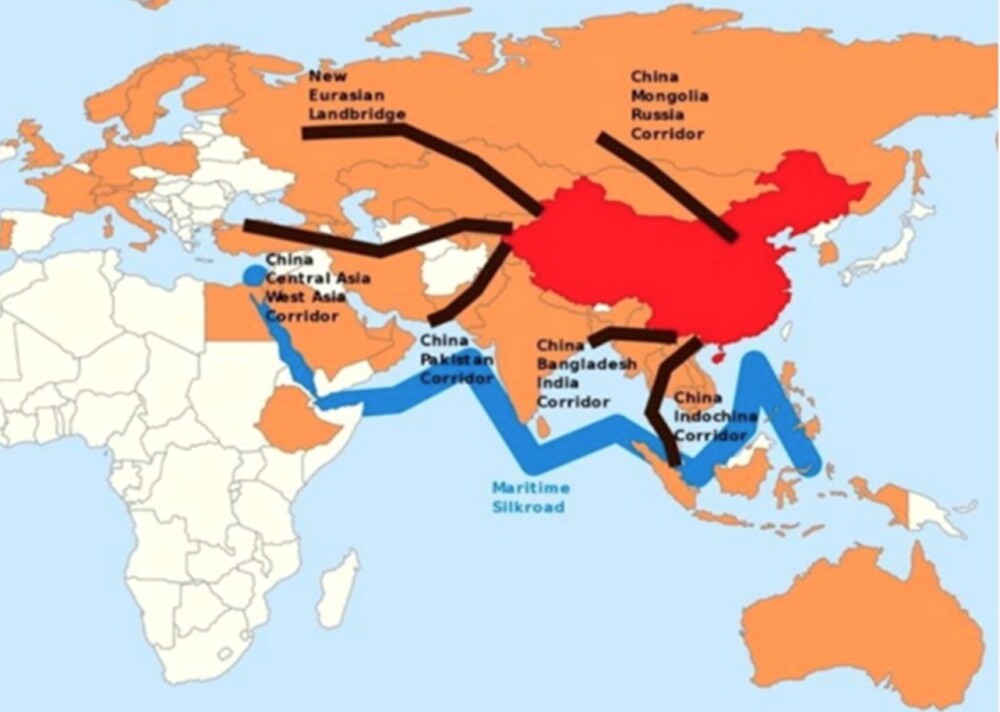
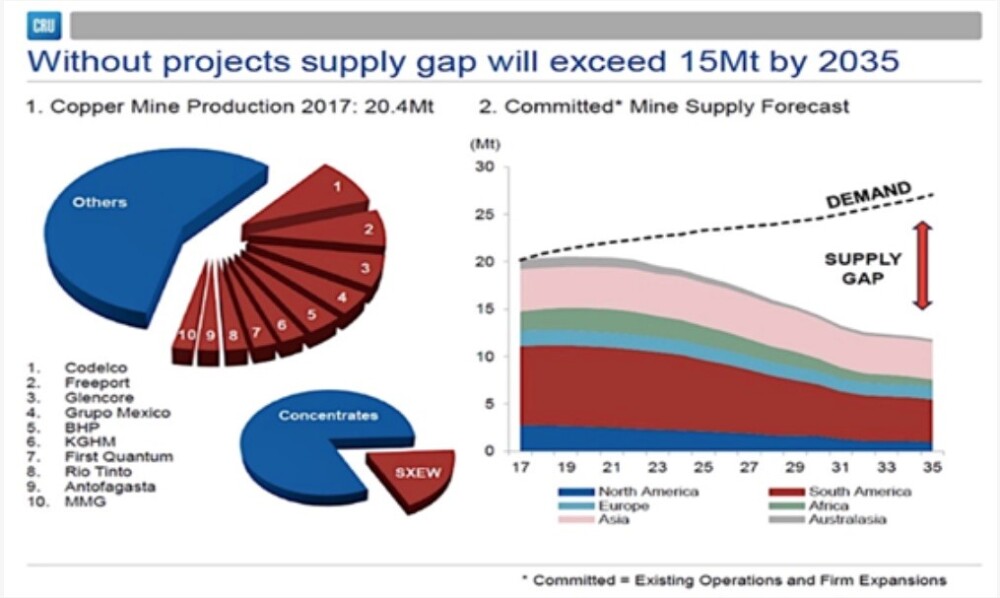
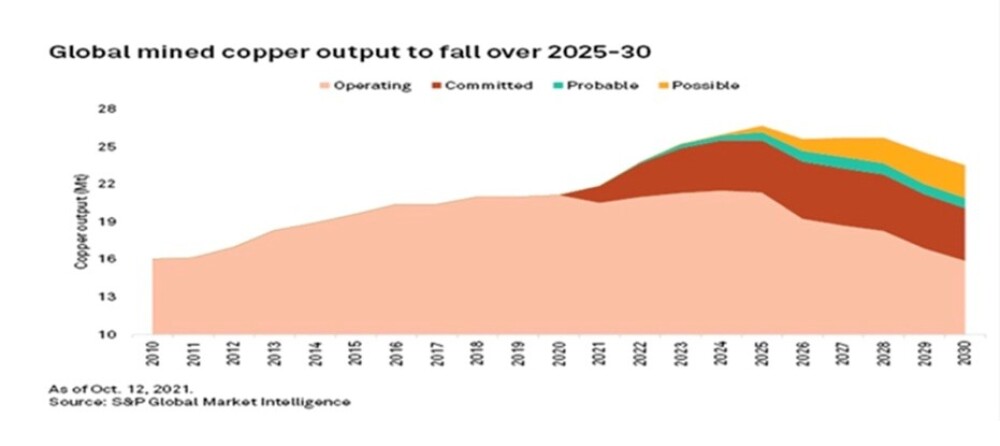
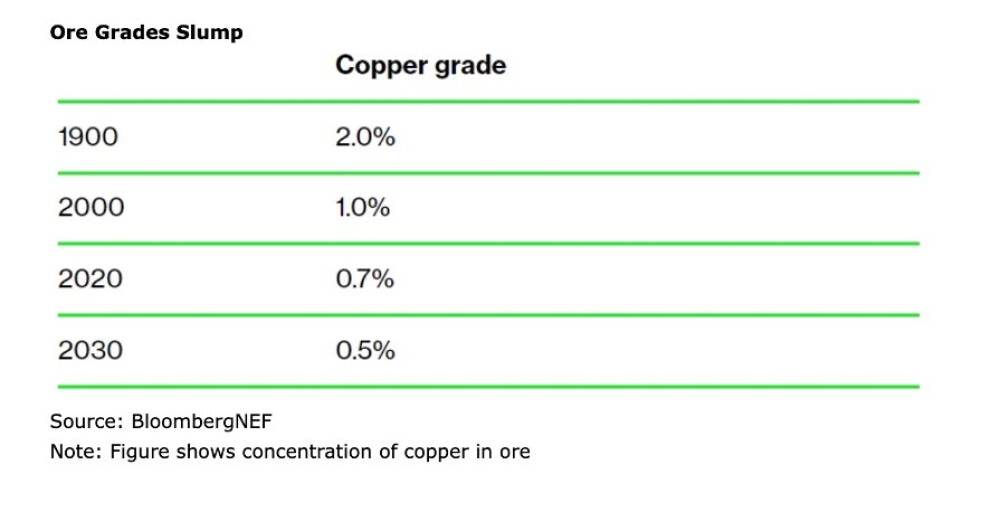
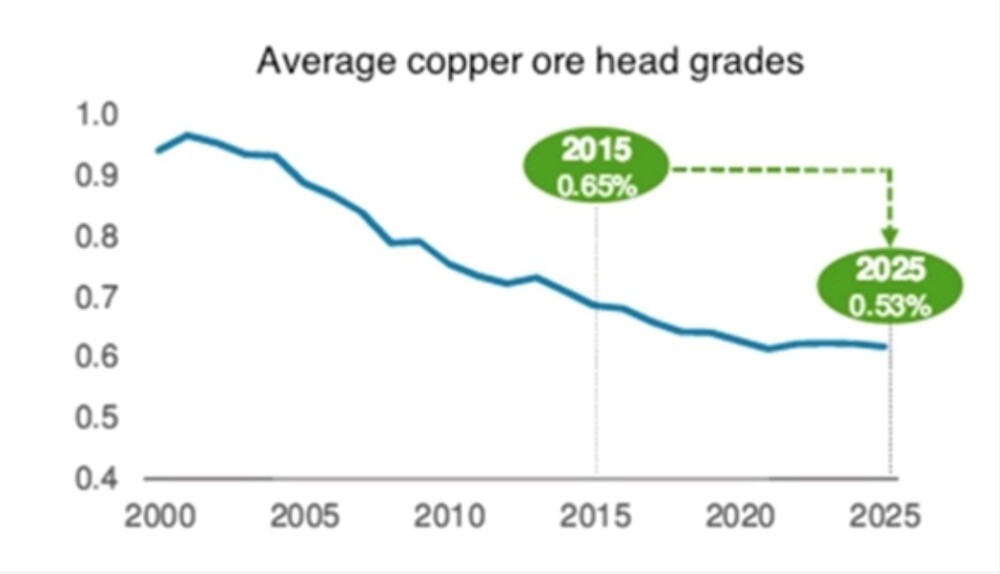
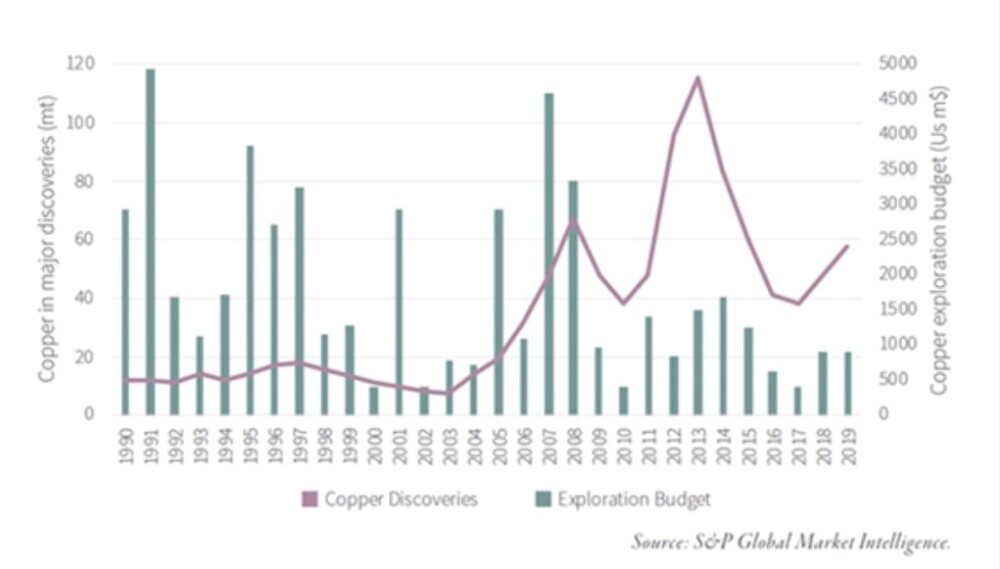

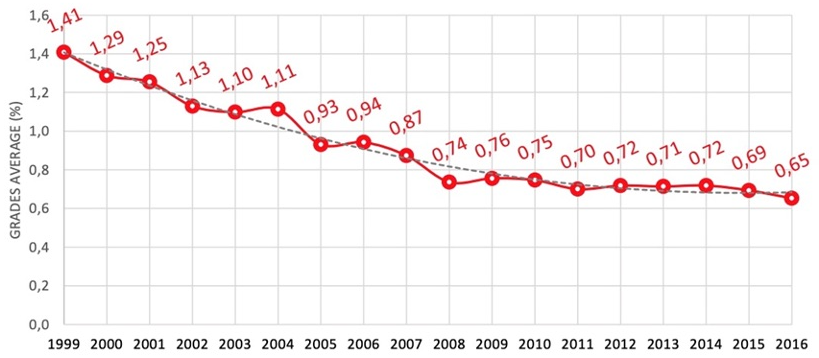
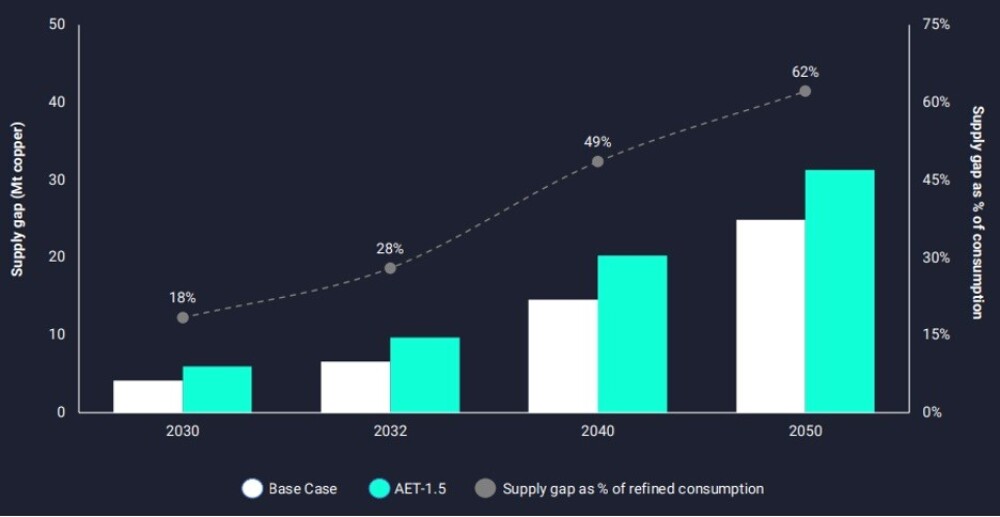
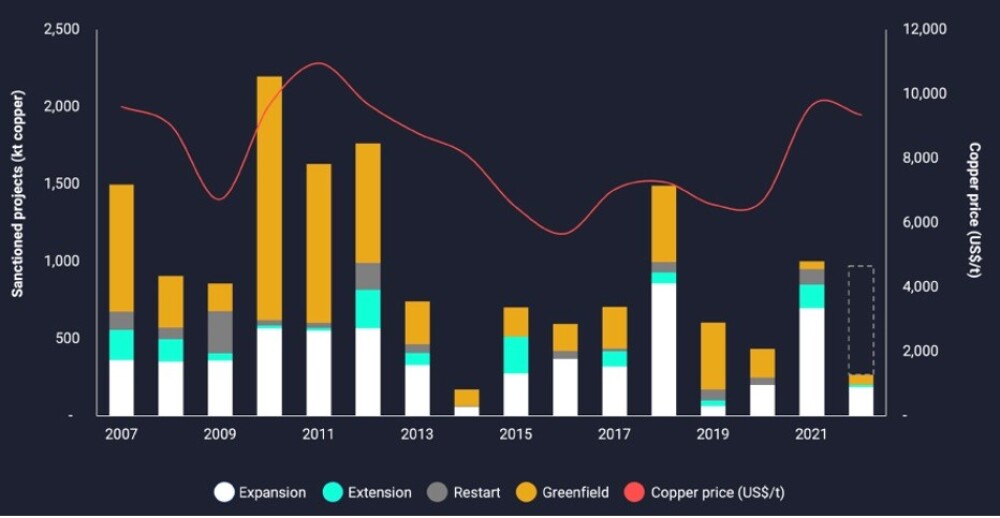
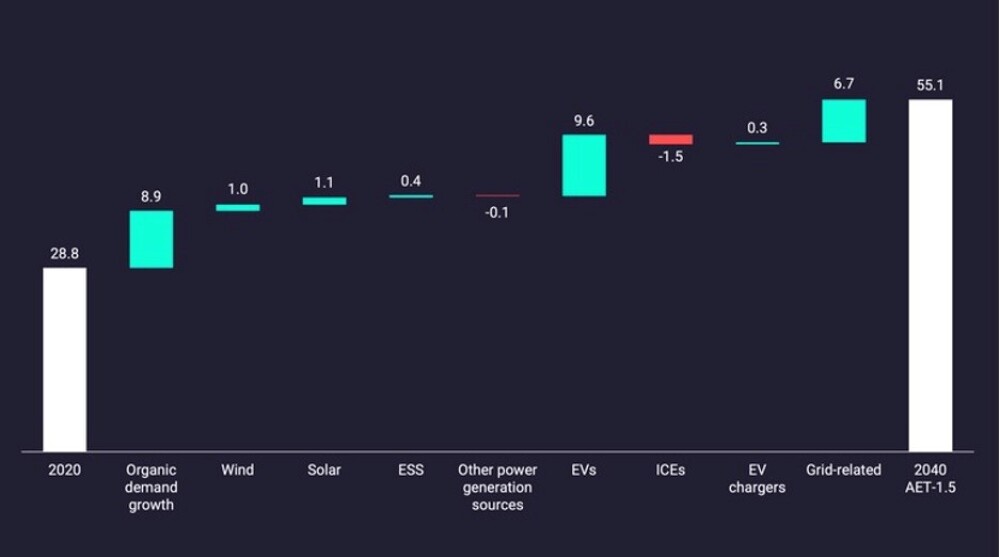
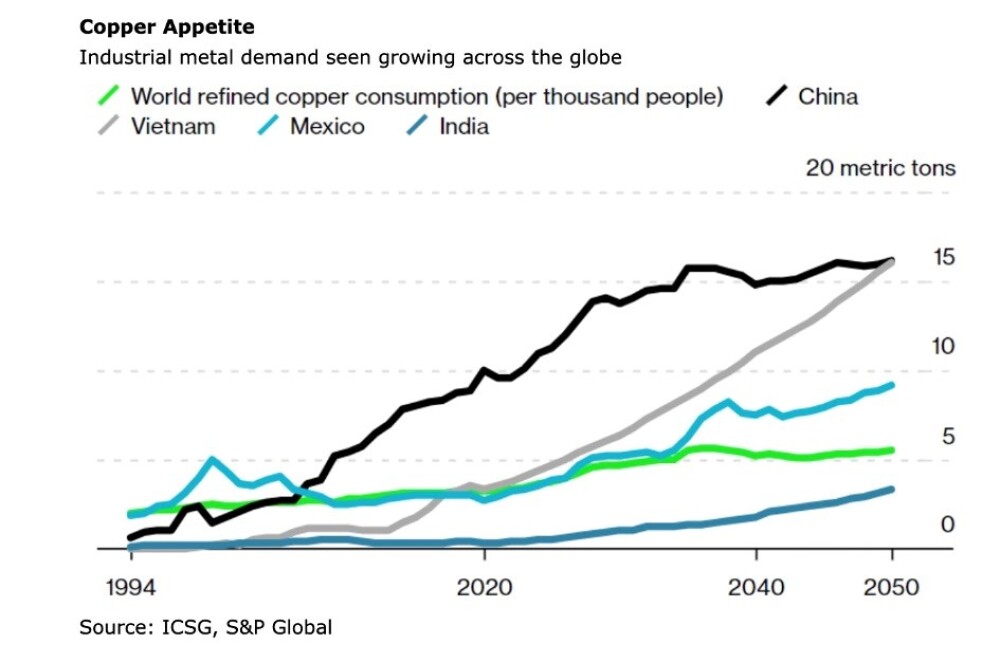
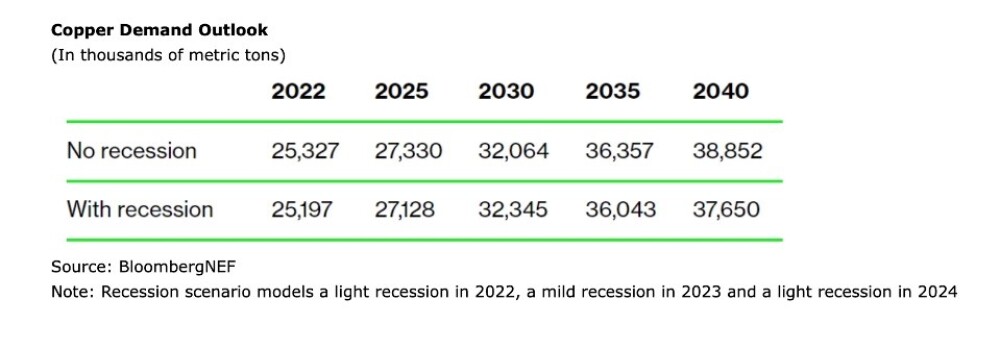
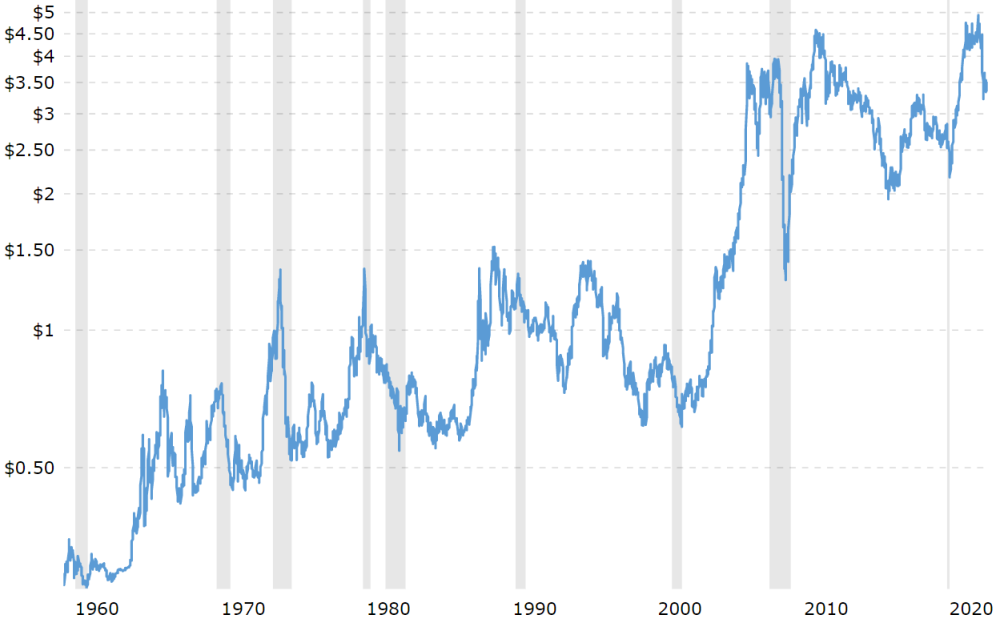

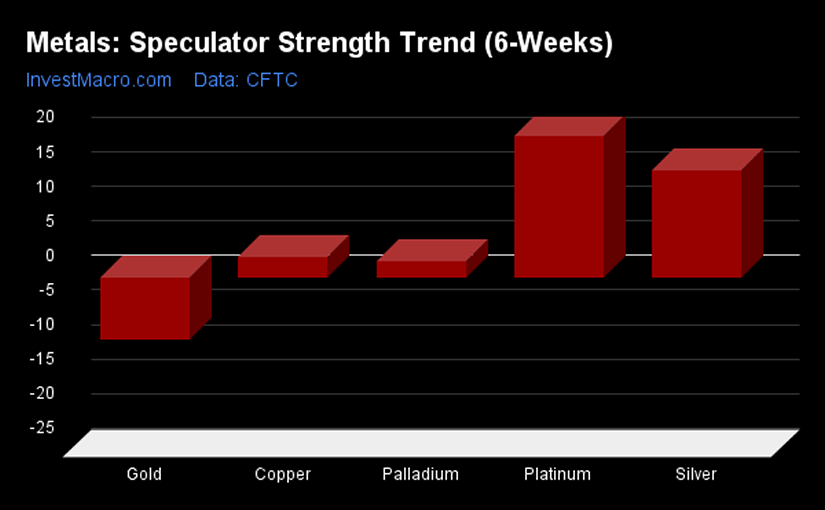

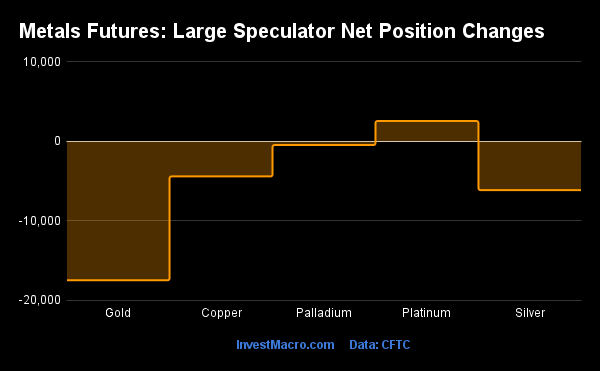
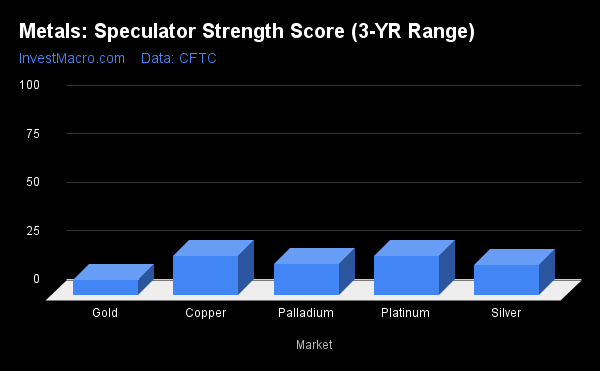


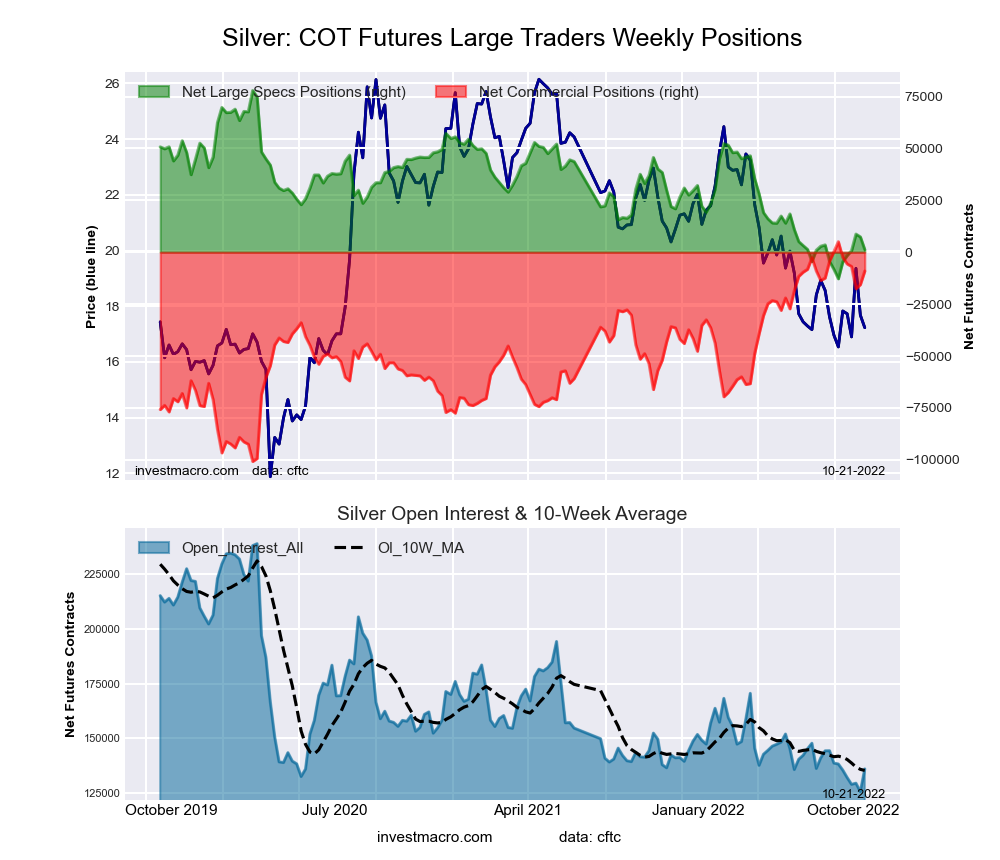

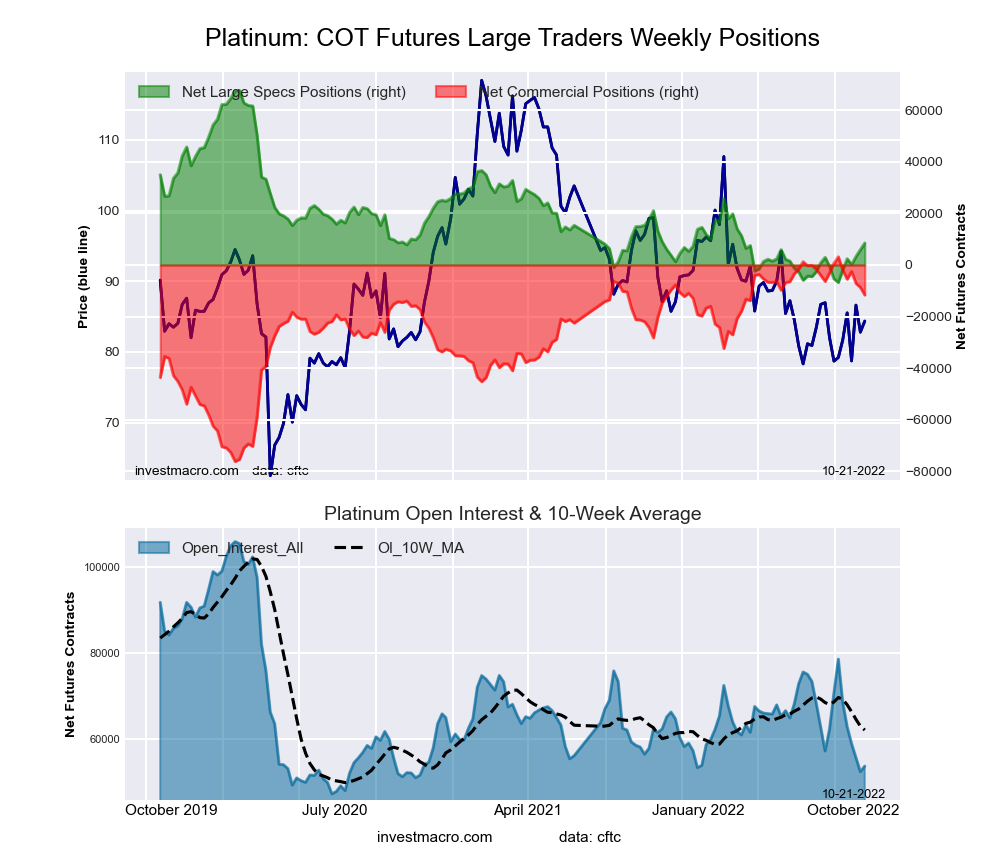


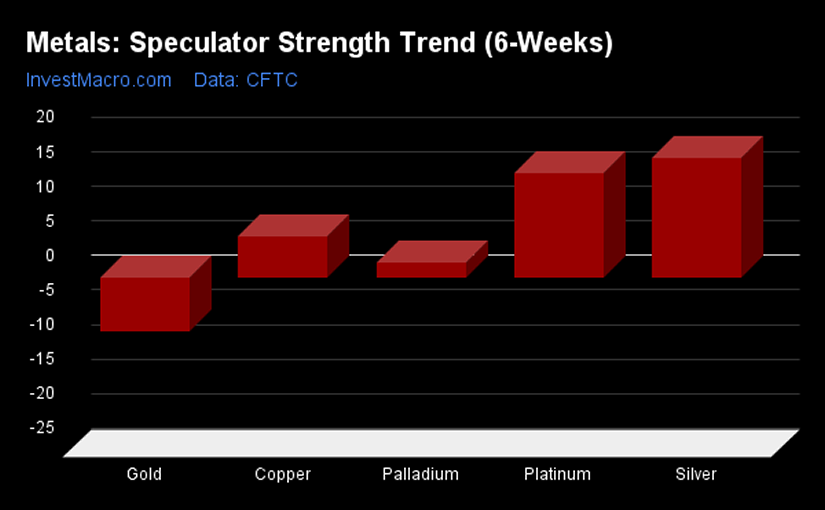
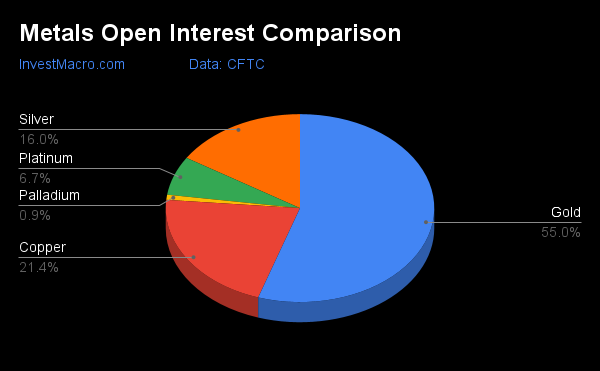
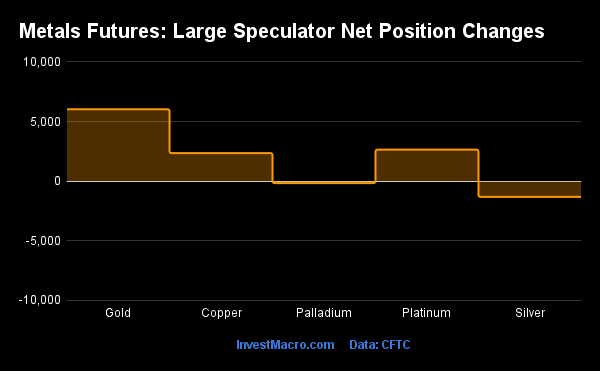
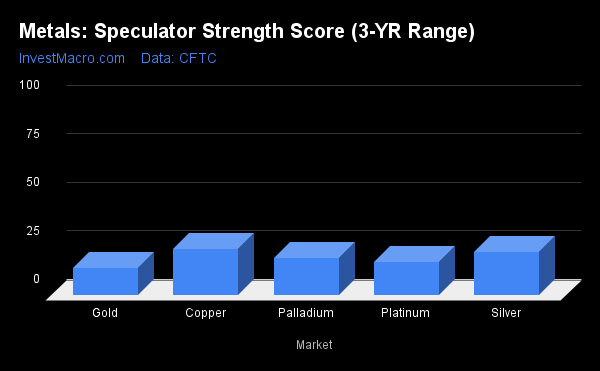

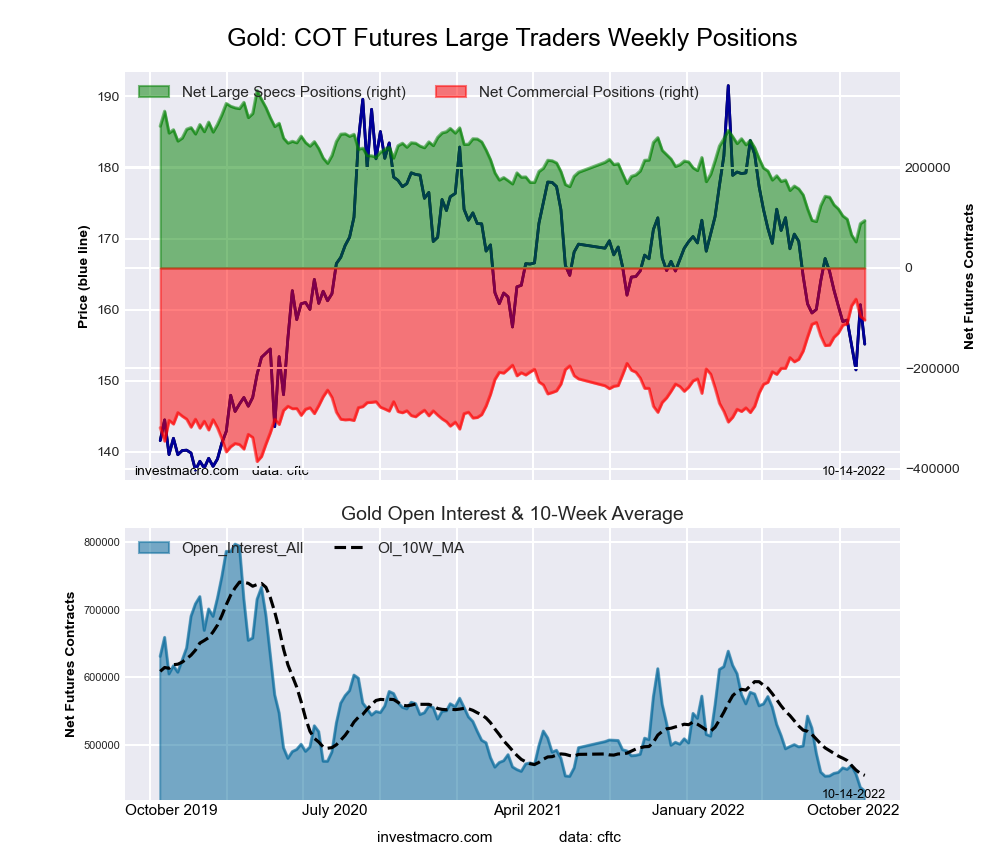
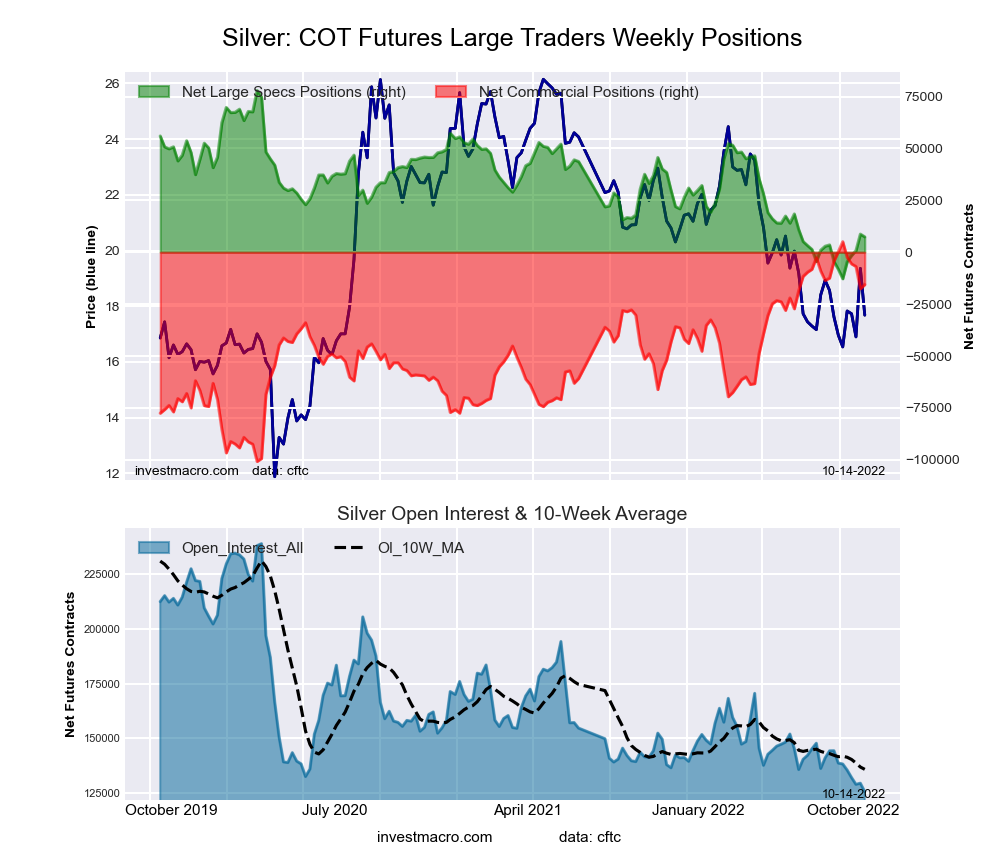
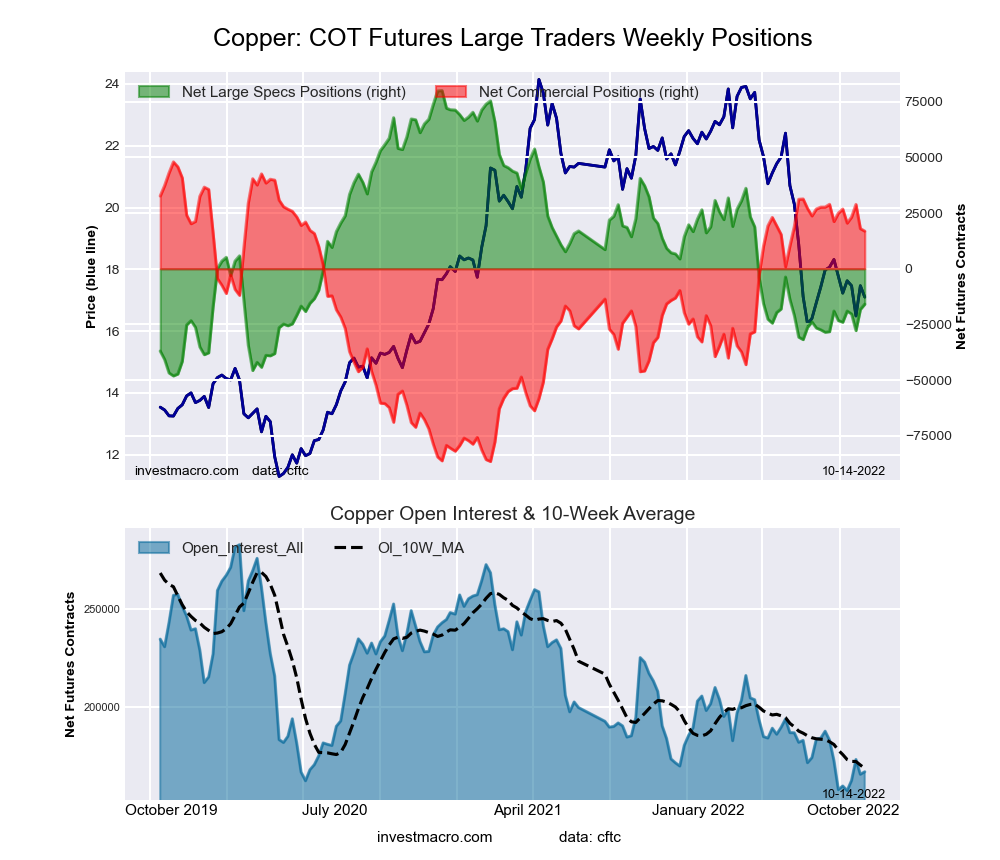

