By InvestMacro
Here are the latest charts and statistics for the Commitment of Traders (COT) reports data published by the Commodities Futures Trading Commission (CFTC).
The latest COT data is updated through Tuesday December 17th and shows a quick view of how large traders (for-profit speculators and commercial entities) were positioned in the futures markets.
Weekly Speculator Changes led by Live Cattle & Lean Hogs
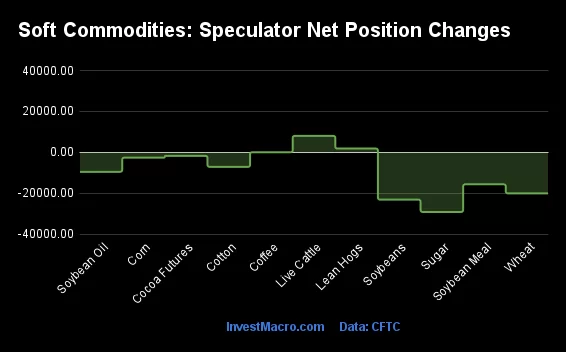
The COT soft commodities markets speculator bets were overall lower this week as three out of the eleven softs markets we cover had higher positioning while the other eight markets had lower speculator contracts.
Leading the gains for the softs markets was Live Cattle (8,077 contracts) with Lean Hogs (1,888 contracts) and Coffee (73 contracts) also showing positive weeks.
The markets with the declines in speculator bets this week were Sugar (-29,144 contracts), Soybeans (-23,113 contracts), Wheat (-20,050 contracts), Soybean Meal (-15,616 contracts), Soybean Oil (-9,513 contracts), Cotton (-7,075 contracts), Corn (-2,575 contracts) and with Cocoa (-1,696 contracts) also registering lower bets on the week.
Soft Commodities Net Speculators Leaderboard
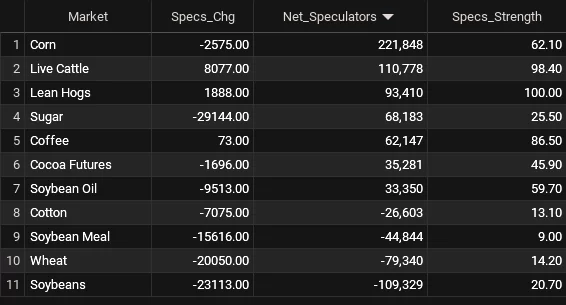
Legend: Weekly Speculators Change | Speculators Current Net Position | Speculators Strength Score compared to last 3-Years (0-100 range)
Strength Scores led by Lean Hogs & Live Cattle
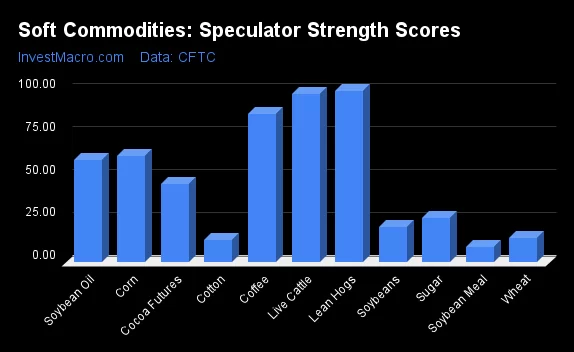
COT Strength Scores (a normalized measure of Speculator positions over a 3-Year range, from 0 to 100 where above 80 is Extreme-Bullish and below 20 is Extreme-Bearish) showed that Lean Hogs (100 percent) and Live Cattle (98 percent) lead the softs markets this week. Coffee (86 percent), Corn (62 percent) and Soybean Oil (60 percent) come in as the next highest in the weekly strength scores.
On the downside, Soybean Meal (9 percent), Cotton (13 percent) and Wheat (14 percent) come in at the lowest strength levels currently and are in Extreme-Bearish territory (below 20 percent).
Strength Statistics:
Corn (62.1 percent) vs Corn previous week (62.4 percent)
Sugar (25.5 percent) vs Sugar previous week (35.7 percent)
Coffee (86.5 percent) vs Coffee previous week (86.4 percent)
Soybeans (20.7 percent) vs Soybeans previous week (26.2 percent)
Soybean Oil (59.7 percent) vs Soybean Oil previous week (64.9 percent)
Soybean Meal (9.0 percent) vs Soybean Meal previous week (15.4 percent)
Live Cattle (98.4 percent) vs Live Cattle previous week (89.7 percent)
Lean Hogs (100.0 percent) vs Lean Hogs previous week (98.5 percent)
Cotton (13.1 percent) vs Cotton previous week (17.9 percent)
Cocoa (45.9 percent) vs Cocoa previous week (47.7 percent)
Wheat (14.2 percent) vs Wheat previous week (30.1 percent)
Live Cattle & Lean Hogs top the 6-Week Strength Trends
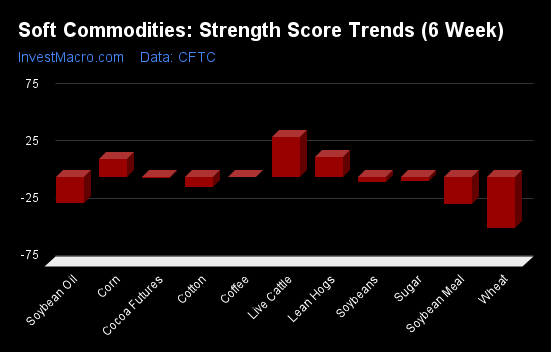
COT Strength Score Trends (or move index, calculates the 6-week changes in strength scores) showed that Live Cattle (34 percent) and Lean Hogs (17 percent) lead the past six weeks trends for soft commodities. Corn (15 percent) comes in as the next highest positive mover in the latest trends data.
Wheat (-45 percent) leads the downside trend scores currently with Soybean Oil (-24 percent), Soybean Meal (-24 percent) and Cotton (-10 percent) following next with lower trend scores.
Strength Trend Statistics:
Corn (15.2 percent) vs Corn previous week (18.0 percent)
Sugar (-3.5 percent) vs Sugar previous week (5.1 percent)
Coffee (-0.8 percent) vs Coffee previous week (-3.1 percent)
Soybeans (-4.8 percent) vs Soybeans previous week (1.4 percent)
Soybean Oil (-23.6 percent) vs Soybean Oil previous week (-11.8 percent)
Soybean Meal (-24.3 percent) vs Soybean Meal previous week (-23.1 percent)
Live Cattle (34.5 percent) vs Live Cattle previous week (22.6 percent)
Lean Hogs (17.0 percent) vs Lean Hogs previous week (23.5 percent)
Cotton (-9.5 percent) vs Cotton previous week (-5.2 percent)
Cocoa (-1.4 percent) vs Cocoa previous week (-0.4 percent)
Wheat (-45.1 percent) vs Wheat previous week (-28.9 percent)
Individual Soft Commodities Markets:
CORN Futures:
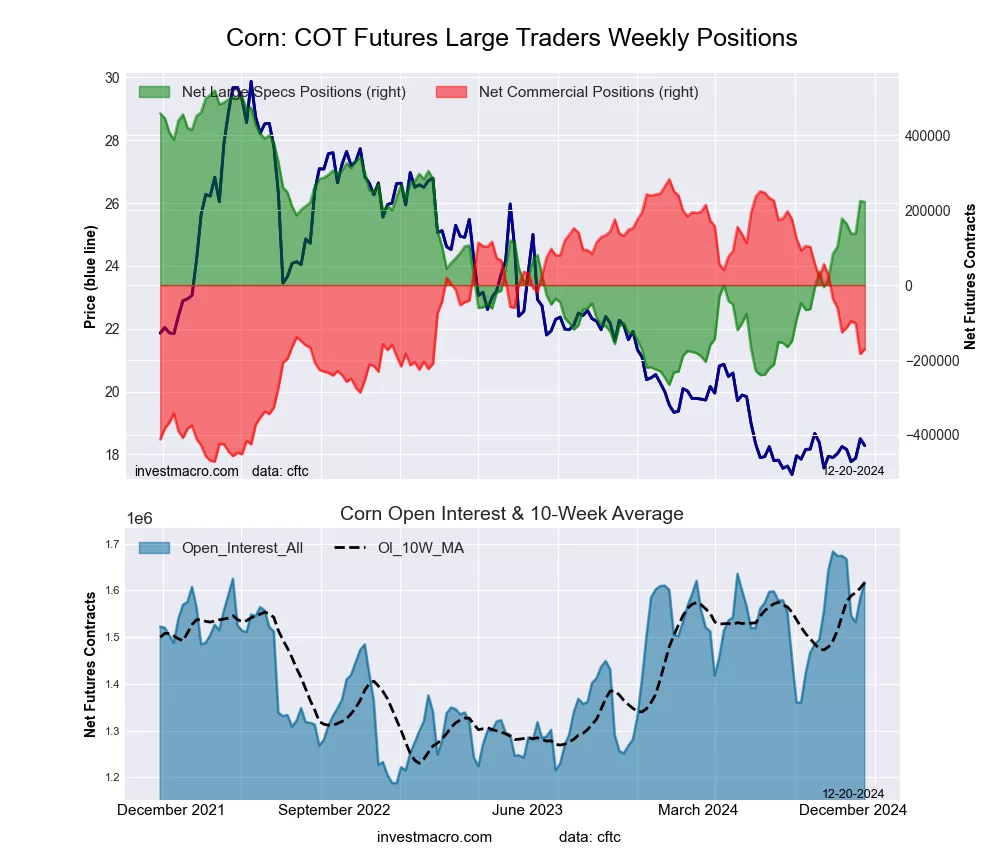 The CORN large speculator standing this week reached a net position of 221,848 contracts in the data reported through Tuesday. This was a weekly decline of -2,575 contracts from the previous week which had a total of 224,423 net contracts.
This week’s current strength score (the trader positioning range over the past three years, measured from 0 to 100) shows the speculators are currently Bullish with a score of 62.1 percent. The commercials are Bearish with a score of 39.8 percent and the small traders (not shown in chart) are Bearish with a score of 39.7 percent.
Price Trend-Following Model: Weak Uptrend
Our weekly trend-following model classifies the current market price position as: Weak Uptrend.
| CORN Futures Statistics | SPECULATORS | COMMERCIALS | SMALL TRADERS |
| – Percent of Open Interest Longs: | 28.1 | 46.1 | 7.5 |
| – Percent of Open Interest Shorts: | 14.4 | 56.6 | 10.7 |
| – Net Position: | 221,848 | -170,678 | -51,170 |
| – Gross Longs: | 454,635 | 745,237 | 121,259 |
| – Gross Shorts: | 232,787 | 915,915 | 172,429 |
| – Long to Short Ratio: | 2.0 to 1 | 0.8 to 1 | 0.7 to 1 |
| NET POSITION TREND: | |||
| – Strength Index Score (3 Year Range Pct): | 62.1 | 39.8 | 39.7 |
| – Strength Index Reading (3 Year Range): | Bullish | Bearish | Bearish |
| NET POSITION MOVEMENT INDEX: | |||
| – 6-Week Change in Strength Index: | 15.2 | -14.7 | -11.6 |
SUGAR Futures:
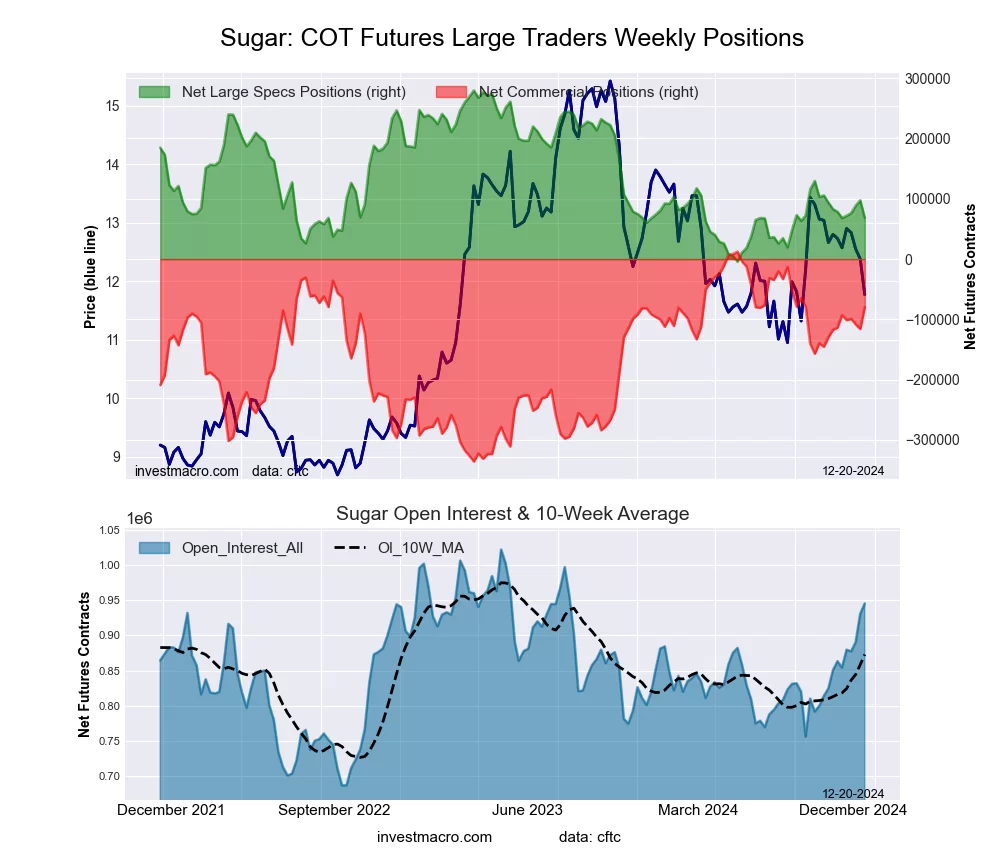 The SUGAR large speculator standing this week reached a net position of 68,183 contracts in the data reported through Tuesday. This was a weekly decline of -29,144 contracts from the previous week which had a total of 97,327 net contracts.
This week’s current strength score (the trader positioning range over the past three years, measured from 0 to 100) shows the speculators are currently Bearish with a score of 25.5 percent. The commercials are Bullish with a score of 73.5 percent and the small traders (not shown in chart) are Bearish with a score of 35.0 percent.
Price Trend-Following Model: Weak Uptrend
Our weekly trend-following model classifies the current market price position as: Weak Uptrend.
| SUGAR Futures Statistics | SPECULATORS | COMMERCIALS | SMALL TRADERS |
| – Percent of Open Interest Longs: | 23.4 | 53.4 | 7.3 |
| – Percent of Open Interest Shorts: | 16.2 | 61.9 | 6.0 |
| – Net Position: | 68,183 | -79,998 | 11,815 |
| – Gross Longs: | 221,468 | 505,126 | 68,565 |
| – Gross Shorts: | 153,285 | 585,124 | 56,750 |
| – Long to Short Ratio: | 1.4 to 1 | 0.9 to 1 | 1.2 to 1 |
| NET POSITION TREND: | |||
| – Strength Index Score (3 Year Range Pct): | 25.5 | 73.5 | 35.0 |
| – Strength Index Reading (3 Year Range): | Bearish | Bullish | Bearish |
| NET POSITION MOVEMENT INDEX: | |||
| – 6-Week Change in Strength Index: | -3.5 | 9.6 | -30.6 |
COFFEE Futures:
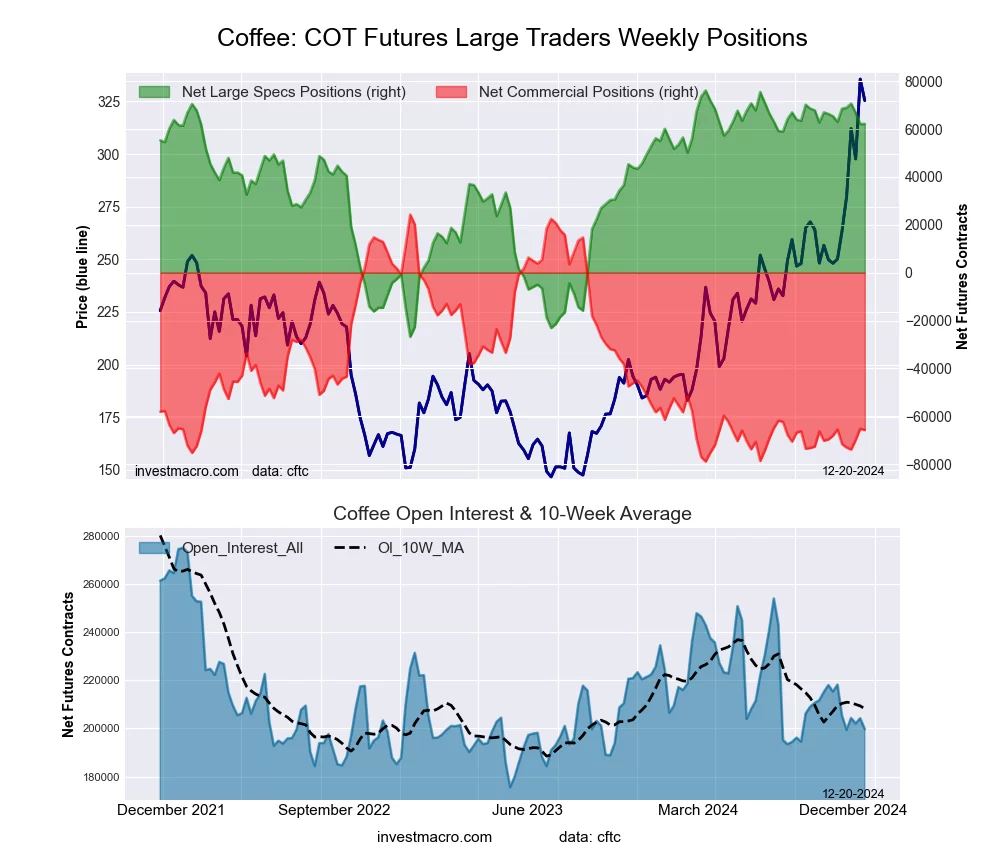 The COFFEE large speculator standing this week reached a net position of 62,147 contracts in the data reported through Tuesday. This was a weekly edge higher of 73 contracts from the previous week which had a total of 62,074 net contracts.
This week’s current strength score (the trader positioning range over the past three years, measured from 0 to 100) shows the speculators are currently Bullish-Extreme with a score of 86.5 percent. The commercials are Bearish-Extreme with a score of 12.7 percent and the small traders (not shown in chart) are Bullish with a score of 71.5 percent.
Price Trend-Following Model: Strong Uptrend
Our weekly trend-following model classifies the current market price position as: Strong Uptrend.
| COFFEE Futures Statistics | SPECULATORS | COMMERCIALS | SMALL TRADERS |
| – Percent of Open Interest Longs: | 37.2 | 34.6 | 4.8 |
| – Percent of Open Interest Shorts: | 6.0 | 67.5 | 3.0 |
| – Net Position: | 62,147 | -65,700 | 3,553 |
| – Gross Longs: | 74,227 | 69,145 | 9,539 |
| – Gross Shorts: | 12,080 | 134,845 | 5,986 |
| – Long to Short Ratio: | 6.1 to 1 | 0.5 to 1 | 1.6 to 1 |
| NET POSITION TREND: | |||
| – Strength Index Score (3 Year Range Pct): | 86.5 | 12.7 | 71.5 |
| – Strength Index Reading (3 Year Range): | Bullish-Extreme | Bearish-Extreme | Bullish |
| NET POSITION MOVEMENT INDEX: | |||
| – 6-Week Change in Strength Index: | -0.8 | -0.3 | 17.0 |
SOYBEANS Futures:
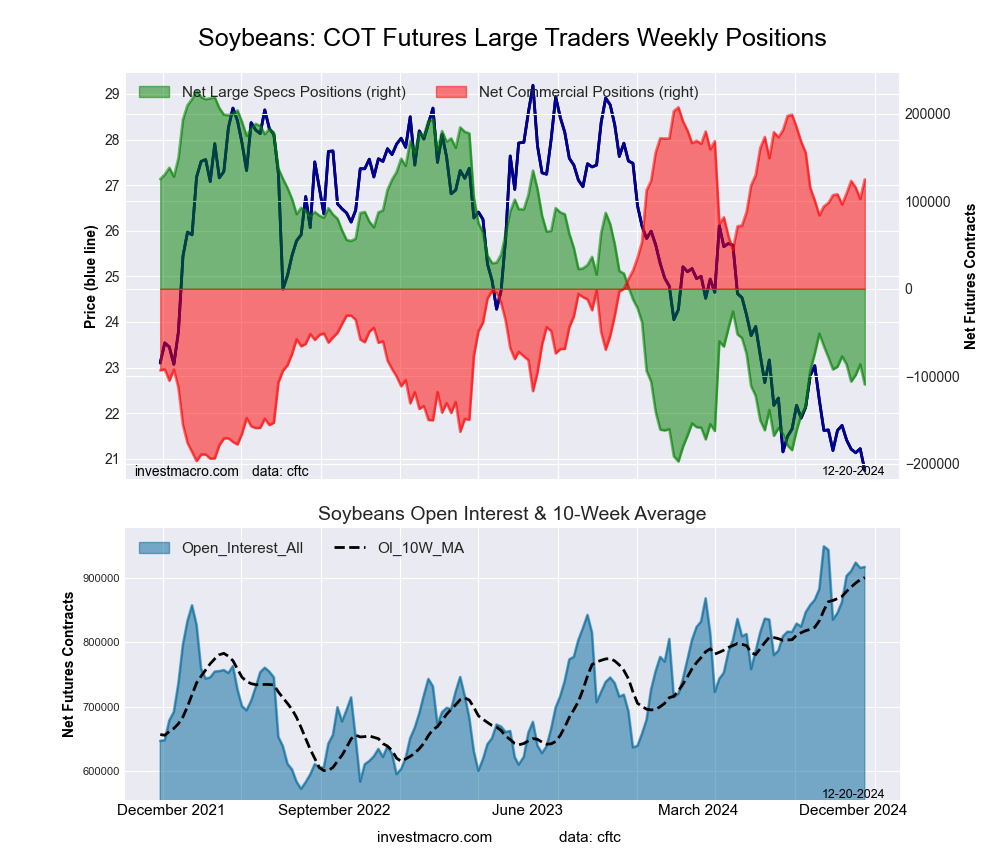 The SOYBEANS large speculator standing this week reached a net position of -109,329 contracts in the data reported through Tuesday. This was a weekly fall of -23,113 contracts from the previous week which had a total of -86,216 net contracts.
This week’s current strength score (the trader positioning range over the past three years, measured from 0 to 100) shows the speculators are currently Bearish with a score of 20.7 percent. The commercials are Bullish with a score of 79.6 percent and the small traders (not shown in chart) are Bullish with a score of 71.5 percent.
Price Trend-Following Model: Strong Downtrend
Our weekly trend-following model classifies the current market price position as: Strong Downtrend.
| SOYBEANS Futures Statistics | SPECULATORS | COMMERCIALS | SMALL TRADERS |
| – Percent of Open Interest Longs: | 17.0 | 56.6 | 5.7 |
| – Percent of Open Interest Shorts: | 29.0 | 42.9 | 7.4 |
| – Net Position: | -109,329 | 125,032 | -15,703 |
| – Gross Longs: | 156,034 | 518,263 | 52,313 |
| – Gross Shorts: | 265,363 | 393,231 | 68,016 |
| – Long to Short Ratio: | 0.6 to 1 | 1.3 to 1 | 0.8 to 1 |
| NET POSITION TREND: | |||
| – Strength Index Score (3 Year Range Pct): | 20.7 | 79.6 | 71.5 |
| – Strength Index Reading (3 Year Range): | Bearish | Bullish | Bullish |
| NET POSITION MOVEMENT INDEX: | |||
| – 6-Week Change in Strength Index: | -4.8 | 4.2 | 8.7 |
SOYBEAN OIL Futures:
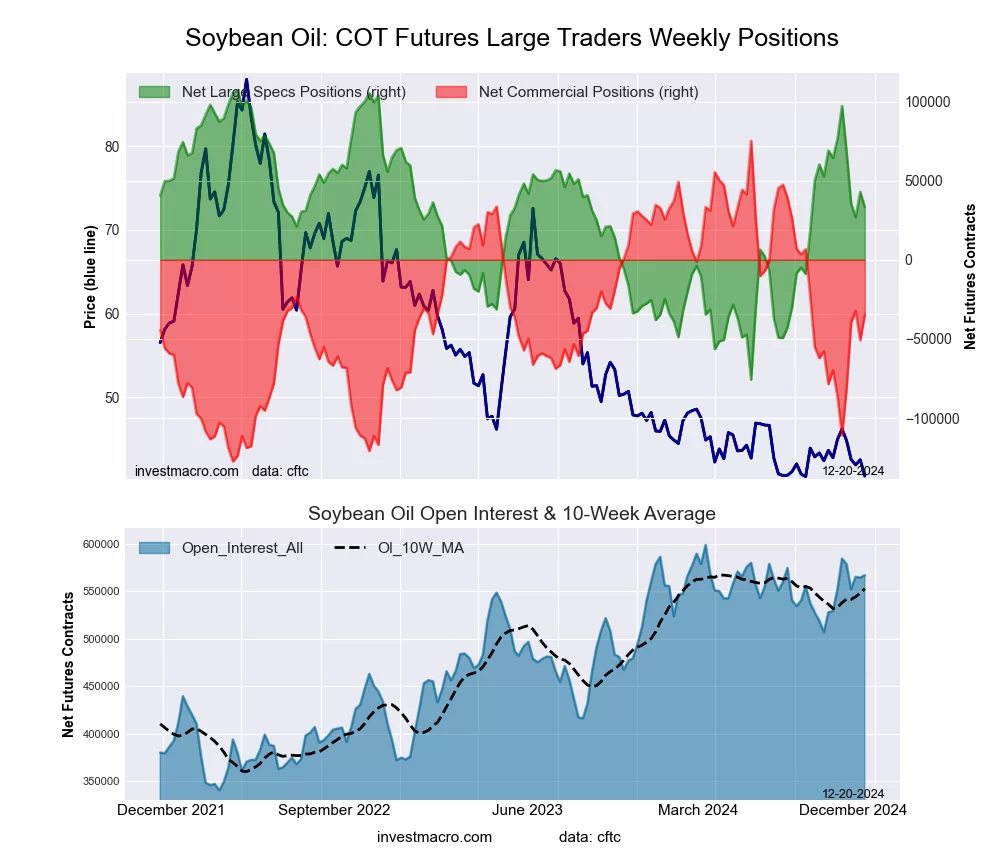 The SOYBEAN OIL large speculator standing this week reached a net position of 33,350 contracts in the data reported through Tuesday. This was a weekly fall of -9,513 contracts from the previous week which had a total of 42,863 net contracts.
This week’s current strength score (the trader positioning range over the past three years, measured from 0 to 100) shows the speculators are currently Bullish with a score of 59.7 percent. The commercials are Bearish with a score of 45.8 percent and the small traders (not shown in chart) are Bearish-Extreme with a score of 18.8 percent.
Price Trend-Following Model: Downtrend
Our weekly trend-following model classifies the current market price position as: Downtrend.
| SOYBEAN OIL Futures Statistics | SPECULATORS | COMMERCIALS | SMALL TRADERS |
| – Percent of Open Interest Longs: | 25.1 | 52.8 | 5.5 |
| – Percent of Open Interest Shorts: | 19.2 | 58.9 | 5.3 |
| – Net Position: | 33,350 | -34,566 | 1,216 |
| – Gross Longs: | 142,261 | 299,589 | 31,466 |
| – Gross Shorts: | 108,911 | 334,155 | 30,250 |
| – Long to Short Ratio: | 1.3 to 1 | 0.9 to 1 | 1.0 to 1 |
| NET POSITION TREND: | |||
| – Strength Index Score (3 Year Range Pct): | 59.7 | 45.8 | 18.8 |
| – Strength Index Reading (3 Year Range): | Bullish | Bearish | Bearish-Extreme |
| NET POSITION MOVEMENT INDEX: | |||
| – 6-Week Change in Strength Index: | -23.6 | 25.5 | -32.3 |
SOYBEAN MEAL Futures:
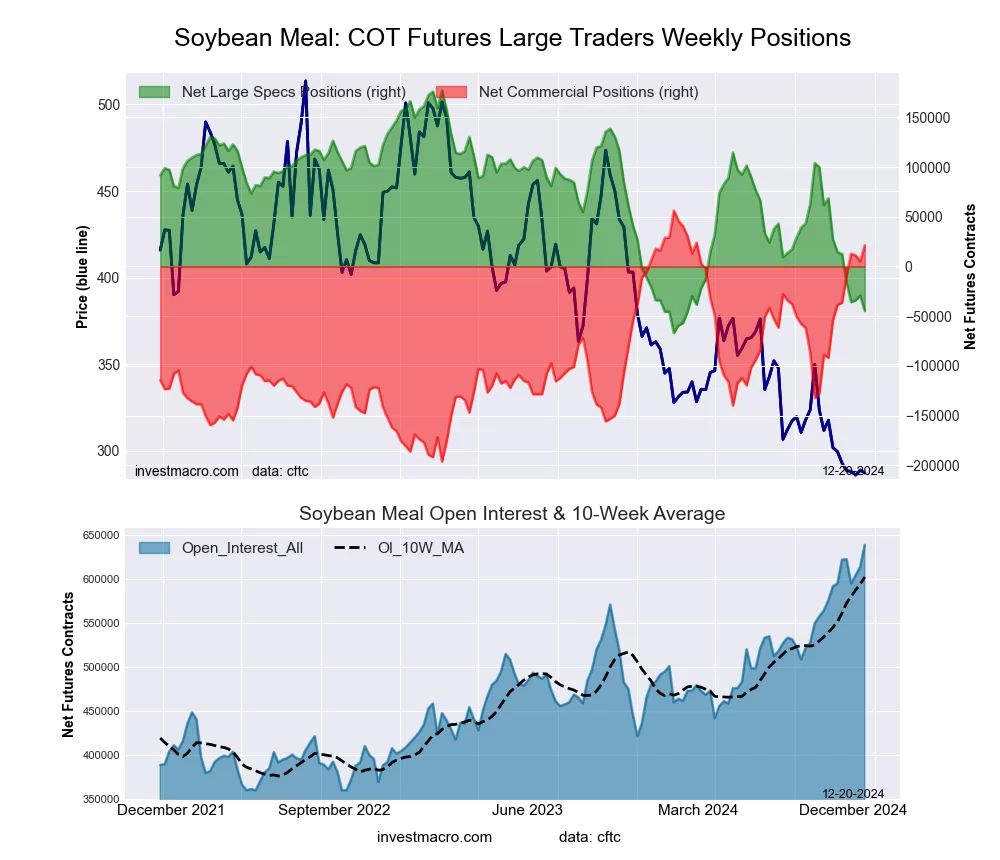 The SOYBEAN MEAL large speculator standing this week reached a net position of -44,844 contracts in the data reported through Tuesday. This was a weekly decrease of -15,616 contracts from the previous week which had a total of -29,228 net contracts.
This week’s current strength score (the trader positioning range over the past three years, measured from 0 to 100) shows the speculators are currently Bearish-Extreme with a score of 9.0 percent. The commercials are Bullish-Extreme with a score of 86.2 percent and the small traders (not shown in chart) are Bullish with a score of 60.8 percent.
Price Trend-Following Model: Downtrend
Our weekly trend-following model classifies the current market price position as: Downtrend.
| SOYBEAN MEAL Futures Statistics | SPECULATORS | COMMERCIALS | SMALL TRADERS |
| – Percent of Open Interest Longs: | 20.4 | 45.5 | 8.9 |
| – Percent of Open Interest Shorts: | 27.5 | 42.2 | 5.3 |
| – Net Position: | -44,844 | 21,478 | 23,366 |
| – Gross Longs: | 130,356 | 290,506 | 57,067 |
| – Gross Shorts: | 175,200 | 269,028 | 33,701 |
| – Long to Short Ratio: | 0.7 to 1 | 1.1 to 1 | 1.7 to 1 |
| NET POSITION TREND: | |||
| – Strength Index Score (3 Year Range Pct): | 9.0 | 86.2 | 60.8 |
| – Strength Index Reading (3 Year Range): | Bearish-Extreme | Bullish-Extreme | Bullish |
| NET POSITION MOVEMENT INDEX: | |||
| – 6-Week Change in Strength Index: | -24.3 | 23.8 | -4.1 |
LIVE CATTLE Futures:
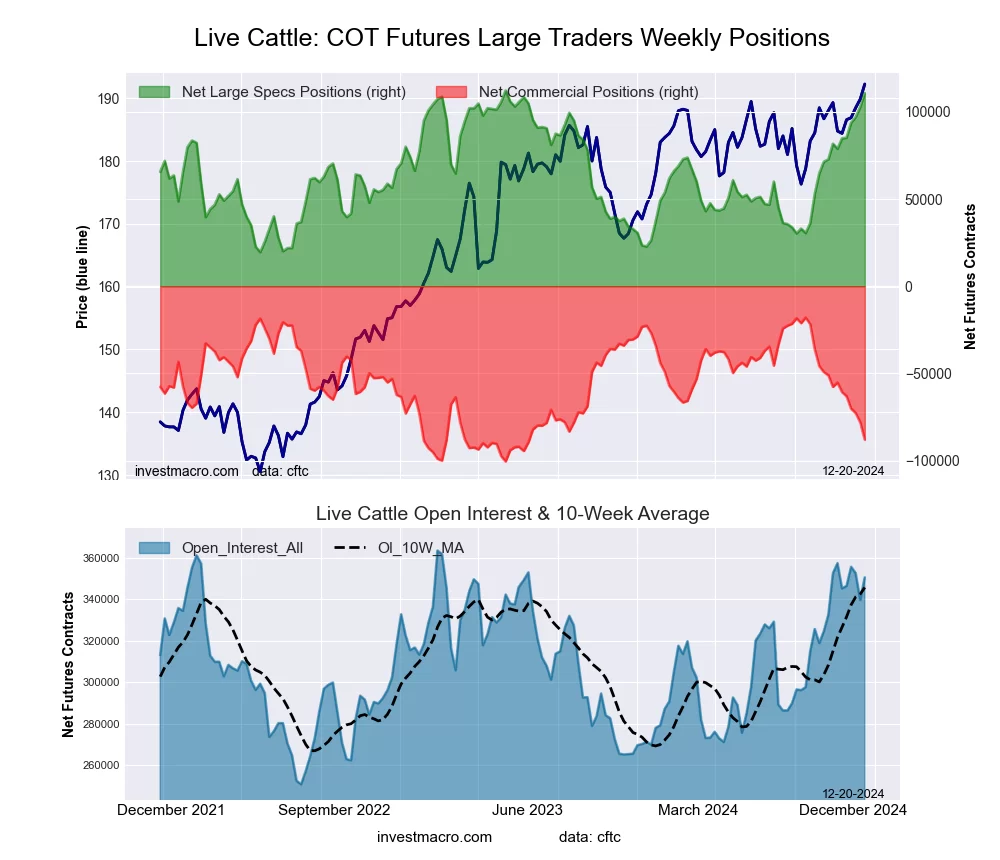 The LIVE CATTLE large speculator standing this week reached a net position of 110,778 contracts in the data reported through Tuesday. This was a weekly increase of 8,077 contracts from the previous week which had a total of 102,701 net contracts.
This week’s current strength score (the trader positioning range over the past three years, measured from 0 to 100) shows the speculators are currently Bullish-Extreme with a score of 98.4 percent. The commercials are Bearish-Extreme with a score of 15.2 percent and the small traders (not shown in chart) are Bearish-Extreme with a score of 7.3 percent.
Price Trend-Following Model: Strong Uptrend
Our weekly trend-following model classifies the current market price position as: Strong Uptrend.
| LIVE CATTLE Futures Statistics | SPECULATORS | COMMERCIALS | SMALL TRADERS |
| – Percent of Open Interest Longs: | 50.1 | 28.6 | 7.0 |
| – Percent of Open Interest Shorts: | 18.5 | 53.7 | 13.5 |
| – Net Position: | 110,778 | -87,943 | -22,835 |
| – Gross Longs: | 175,651 | 100,389 | 24,537 |
| – Gross Shorts: | 64,873 | 188,332 | 47,372 |
| – Long to Short Ratio: | 2.7 to 1 | 0.5 to 1 | 0.5 to 1 |
| NET POSITION TREND: | |||
| – Strength Index Score (3 Year Range Pct): | 98.4 | 15.2 | 7.3 |
| – Strength Index Reading (3 Year Range): | Bullish-Extreme | Bearish-Extreme | Bearish-Extreme |
| NET POSITION MOVEMENT INDEX: | |||
| – 6-Week Change in Strength Index: | 34.5 | -39.6 | 2.8 |
LEAN HOGS Futures:
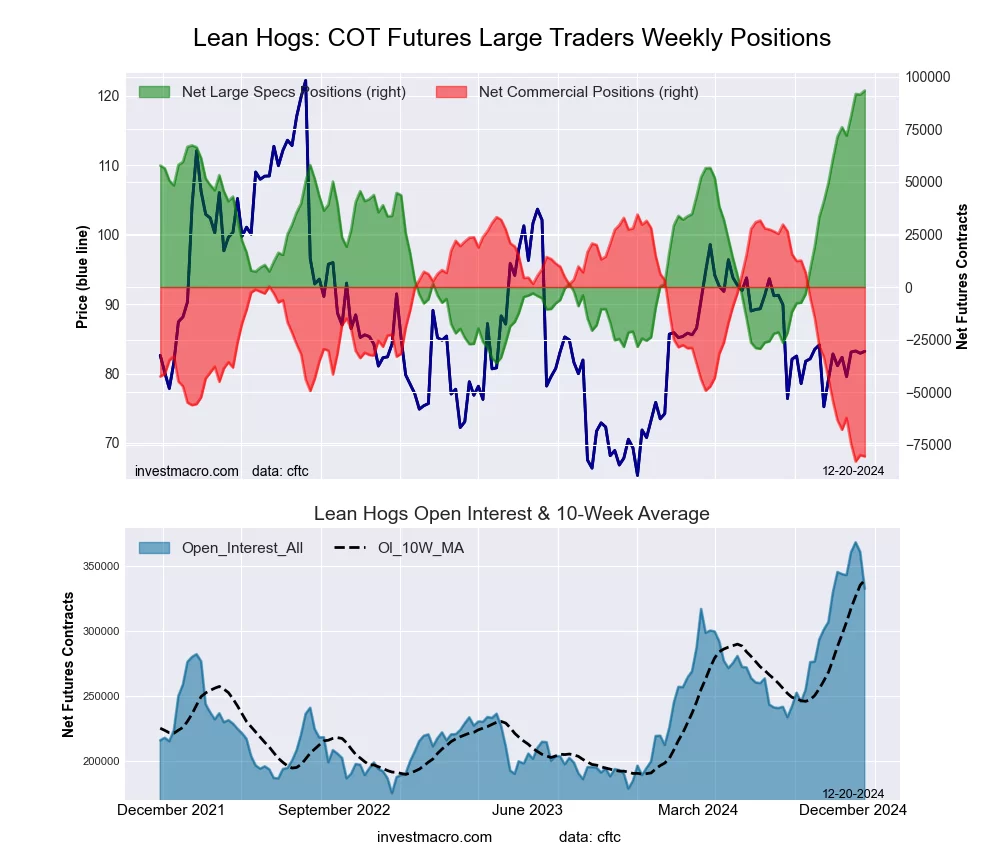 The LEAN HOGS large speculator standing this week reached a net position of 93,410 contracts in the data reported through Tuesday. This was a weekly increase of 1,888 contracts from the previous week which had a total of 91,522 net contracts.
This week’s current strength score (the trader positioning range over the past three years, measured from 0 to 100) shows the speculators are currently Bullish-Extreme with a score of 100.0 percent. The commercials are Bearish-Extreme with a score of 2.0 percent and the small traders (not shown in chart) are Bearish-Extreme with a score of 14.7 percent.
Price Trend-Following Model: Weak Downtrend
Our weekly trend-following model classifies the current market price position as: Weak Downtrend.
| LEAN HOGS Futures Statistics | SPECULATORS | COMMERCIALS | SMALL TRADERS |
| – Percent of Open Interest Longs: | 46.3 | 30.6 | 6.2 |
| – Percent of Open Interest Shorts: | 18.2 | 54.8 | 10.0 |
| – Net Position: | 93,410 | -80,545 | -12,865 |
| – Gross Longs: | 154,060 | 101,704 | 20,534 |
| – Gross Shorts: | 60,650 | 182,249 | 33,399 |
| – Long to Short Ratio: | 2.5 to 1 | 0.6 to 1 | 0.6 to 1 |
| NET POSITION TREND: | |||
| – Strength Index Score (3 Year Range Pct): | 100.0 | 2.0 | 14.7 |
| – Strength Index Reading (3 Year Range): | Bullish-Extreme | Bearish-Extreme | Bearish-Extreme |
| NET POSITION MOVEMENT INDEX: | |||
| – 6-Week Change in Strength Index: | 17.0 | -14.6 | -24.7 |
COTTON Futures:
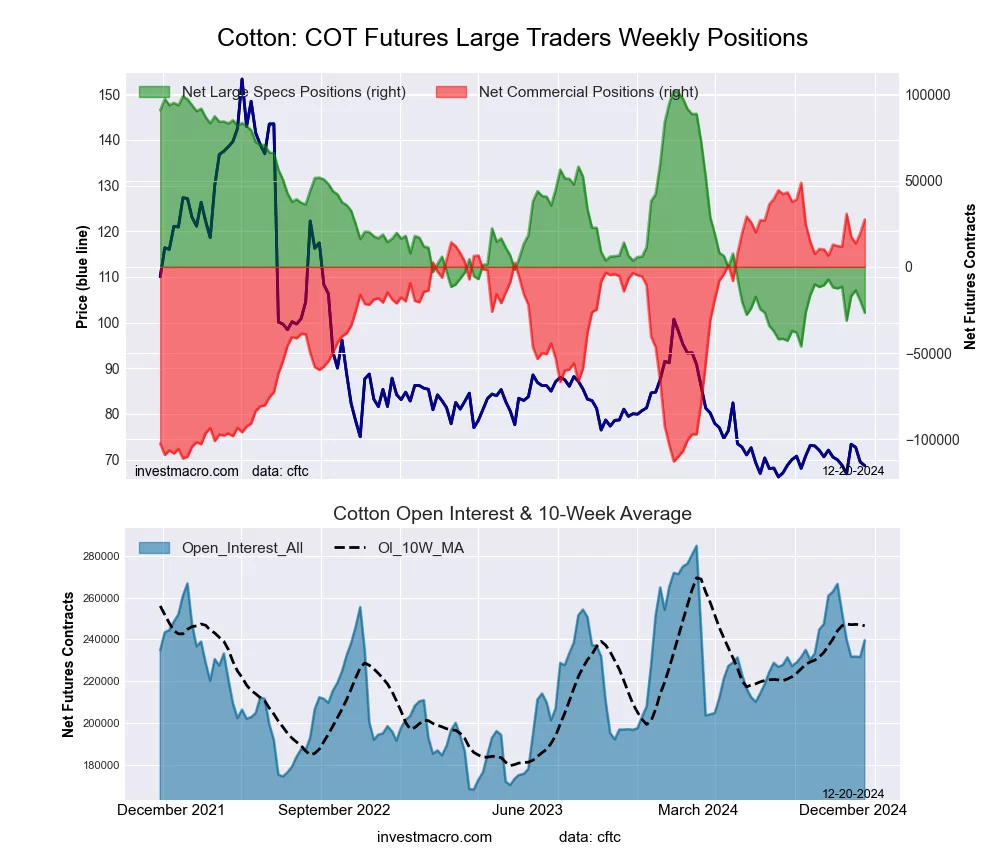 The COTTON large speculator standing this week reached a net position of -26,603 contracts in the data reported through Tuesday. This was a weekly lowering of -7,075 contracts from the previous week which had a total of -19,528 net contracts.
This week’s current strength score (the trader positioning range over the past three years, measured from 0 to 100) shows the speculators are currently Bearish-Extreme with a score of 13.1 percent. The commercials are Bullish-Extreme with a score of 86.8 percent and the small traders (not shown in chart) are Bearish-Extreme with a score of 10.8 percent.
Price Trend-Following Model: Weak Uptrend
Our weekly trend-following model classifies the current market price position as: Weak Uptrend.
| COTTON Futures Statistics | SPECULATORS | COMMERCIALS | SMALL TRADERS |
| – Percent of Open Interest Longs: | 24.9 | 47.5 | 5.4 |
| – Percent of Open Interest Shorts: | 36.0 | 36.0 | 5.8 |
| – Net Position: | -26,603 | 27,546 | -943 |
| – Gross Longs: | 59,565 | 113,854 | 12,851 |
| – Gross Shorts: | 86,168 | 86,308 | 13,794 |
| – Long to Short Ratio: | 0.7 to 1 | 1.3 to 1 | 0.9 to 1 |
| NET POSITION TREND: | |||
| – Strength Index Score (3 Year Range Pct): | 13.1 | 86.8 | 10.8 |
| – Strength Index Reading (3 Year Range): | Bearish-Extreme | Bullish-Extreme | Bearish-Extreme |
| NET POSITION MOVEMENT INDEX: | |||
| – 6-Week Change in Strength Index: | -9.5 | 9.5 | -7.8 |
COCOA Futures:
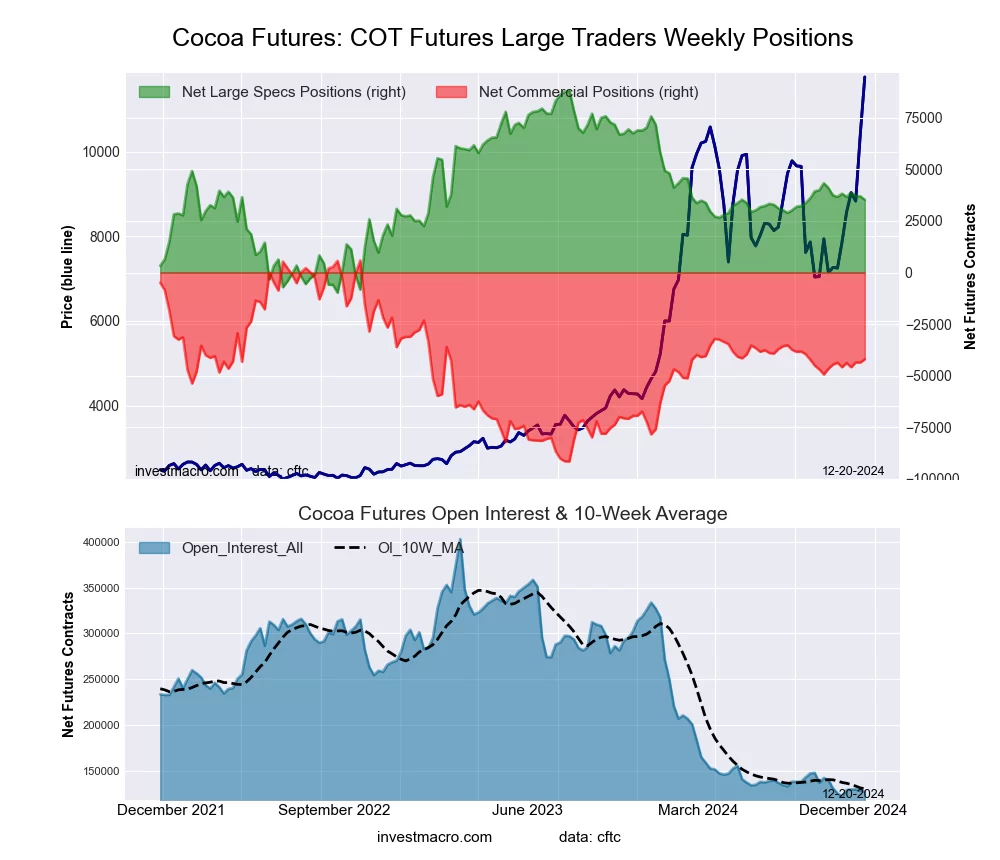 The COCOA large speculator standing this week reached a net position of 35,281 contracts in the data reported through Tuesday. This was a weekly reduction of -1,696 contracts from the previous week which had a total of 36,977 net contracts.
This week’s current strength score (the trader positioning range over the past three years, measured from 0 to 100) shows the speculators are currently Bearish with a score of 45.9 percent. The commercials are Bullish with a score of 50.9 percent and the small traders (not shown in chart) are Bullish with a score of 70.0 percent.
Price Trend-Following Model: Strong Uptrend
Our weekly trend-following model classifies the current market price position as: Strong Uptrend.
| COCOA Futures Statistics | SPECULATORS | COMMERCIALS | SMALL TRADERS |
| – Percent of Open Interest Longs: | 39.9 | 38.3 | 9.5 |
| – Percent of Open Interest Shorts: | 12.3 | 71.2 | 4.2 |
| – Net Position: | 35,281 | -42,067 | 6,786 |
| – Gross Longs: | 51,064 | 49,033 | 12,193 |
| – Gross Shorts: | 15,783 | 91,100 | 5,407 |
| – Long to Short Ratio: | 3.2 to 1 | 0.5 to 1 | 2.3 to 1 |
| NET POSITION TREND: | |||
| – Strength Index Score (3 Year Range Pct): | 45.9 | 50.9 | 70.0 |
| – Strength Index Reading (3 Year Range): | Bearish | Bullish | Bullish |
| NET POSITION MOVEMENT INDEX: | |||
| – 6-Week Change in Strength Index: | -1.4 | 1.7 | -2.2 |
WHEAT Futures:
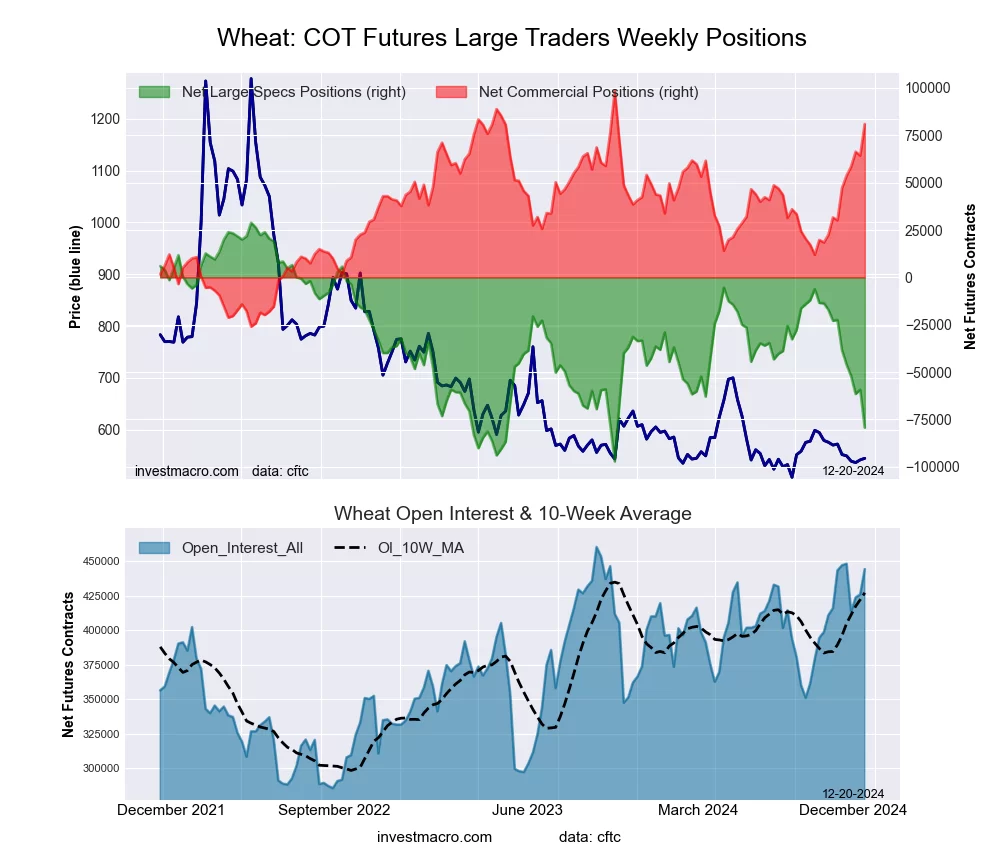 The WHEAT large speculator standing this week reached a net position of -79,340 contracts in the data reported through Tuesday. This was a weekly lowering of -20,050 contracts from the previous week which had a total of -59,290 net contracts.
This week’s current strength score (the trader positioning range over the past three years, measured from 0 to 100) shows the speculators are currently Bearish-Extreme with a score of 14.2 percent. The commercials are Bullish-Extreme with a score of 85.8 percent and the small traders (not shown in chart) are Bearish with a score of 49.0 percent.
Price Trend-Following Model: Weak Uptrend
Our weekly trend-following model classifies the current market price position as: Weak Uptrend.
| WHEAT Futures Statistics | SPECULATORS | COMMERCIALS | SMALL TRADERS |
| – Percent of Open Interest Longs: | 28.6 | 39.2 | 7.2 |
| – Percent of Open Interest Shorts: | 46.4 | 20.9 | 7.6 |
| – Net Position: | -79,340 | 80,945 | -1,605 |
| – Gross Longs: | 126,968 | 173,934 | 32,189 |
| – Gross Shorts: | 206,308 | 92,989 | 33,794 |
| – Long to Short Ratio: | 0.6 to 1 | 1.9 to 1 | 1.0 to 1 |
| NET POSITION TREND: | |||
| – Strength Index Score (3 Year Range Pct): | 14.2 | 85.8 | 49.0 |
| – Strength Index Reading (3 Year Range): | Bearish-Extreme | Bullish-Extreme | Bearish |
| NET POSITION MOVEMENT INDEX: | |||
| – 6-Week Change in Strength Index: | -45.1 | 40.8 | 32.3 |
Article By InvestMacro – Receive our weekly COT Newsletter
*COT Report: The COT data, released weekly to the public each Friday, is updated through the most recent Tuesday (data is 3 days old) and shows a quick view of how large speculators or non-commercials (for-profit traders) were positioned in the futures markets.
The CFTC categorizes trader positions according to commercial hedgers (traders who use futures contracts for hedging as part of the business), non-commercials (large traders who speculate to realize trading profits) and nonreportable traders (usually small traders/speculators) as well as their open interest (contracts open in the market at time of reporting). See CFTC criteria here.