By InvestMacro
Here are the latest charts and statistics for the Commitment of Traders (COT) data published by the Commodities Futures Trading Commission (CFTC).
The latest COT data is updated through Tuesday May 26th and shows a quick view of how large traders (for-profit speculators and commercial entities) were positioned in the futures markets.
Weekly Speculator Changes led by Gasoline & Bloomberg Index
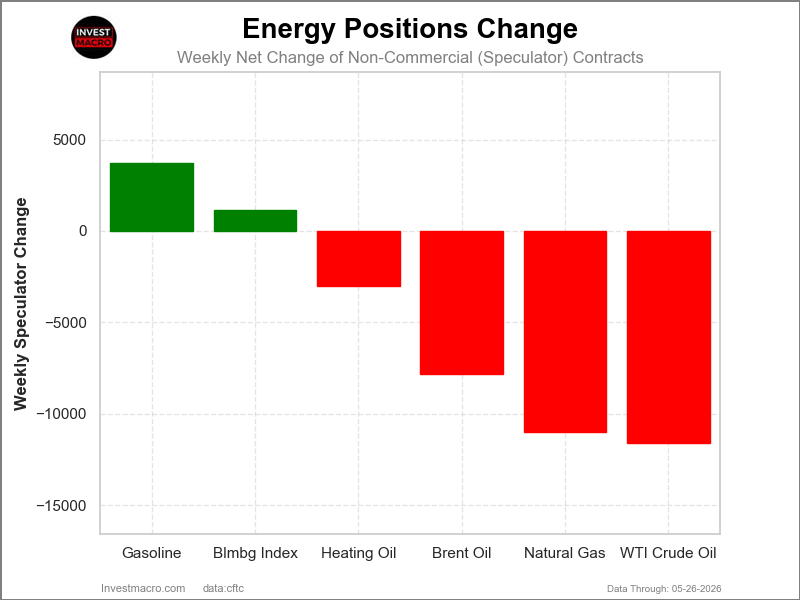
The COT energy market speculator bets were overall lower this week as two out of the six energy markets we cover had higher positioning while the other four markets had lower speculator contracts.
Leading the gains for the energy markets was Gasoline (3,698 contracts) with the Bloomberg Index (1,152 contracts) also seeing a positive week.
The markets with declines in speculator bets for the week were WTI Crude (-11,582 contracts), Natural Gas (-10,985 contracts), Brent Oil (-7,848 contracts) and with Heating Oil (-3,036 contracts) also seeing lower bets on the week.
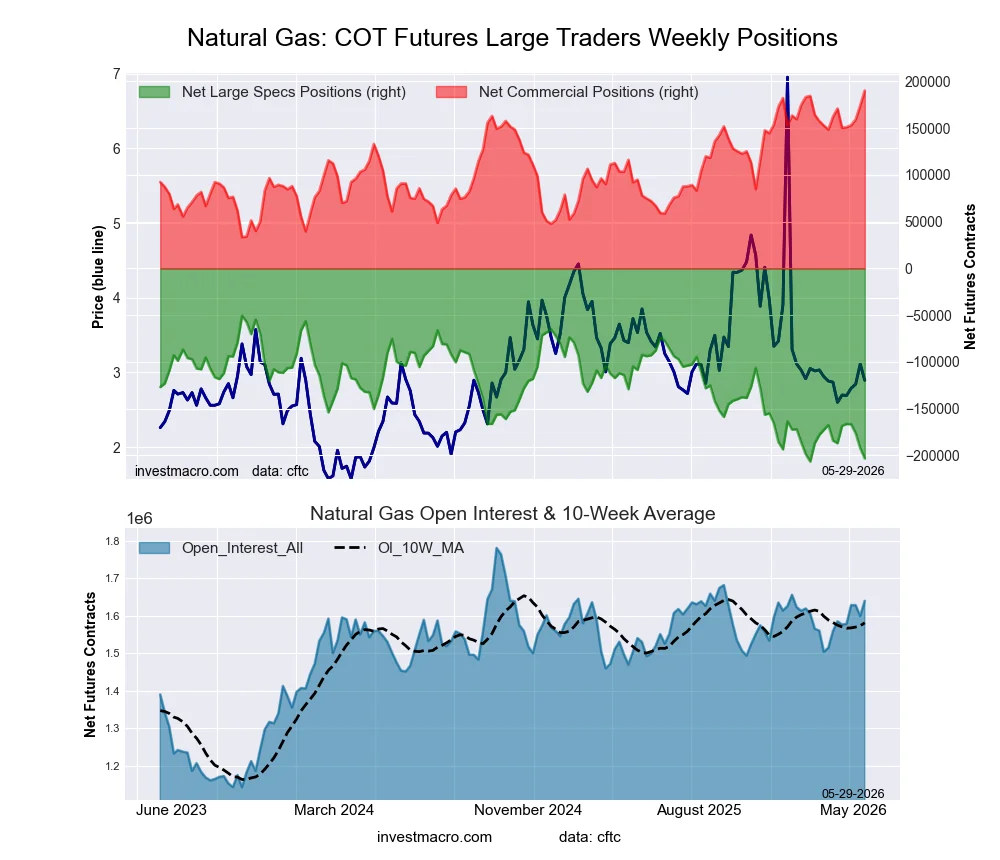
Natural Gas leads Energy market price performances
In the Energy markets this week, Natural Gas was the only market that saw a higher five-day percentage gain. Natural Gas jumped by over 14% with a 14.74% rise over the past week.
On the downside, the Bloomberg Commodity Index dipped by -2.93% on the week, followed by WTI Crude Oil, which slid by -3.42%. Heating Oil was down by -6.68%, while Gasoline saw a similar -6.74% decrease.
Finally, the biggest decliner on the week was Brent Crude Oil with a -10.93% shortfall on the week.
Energy Data:
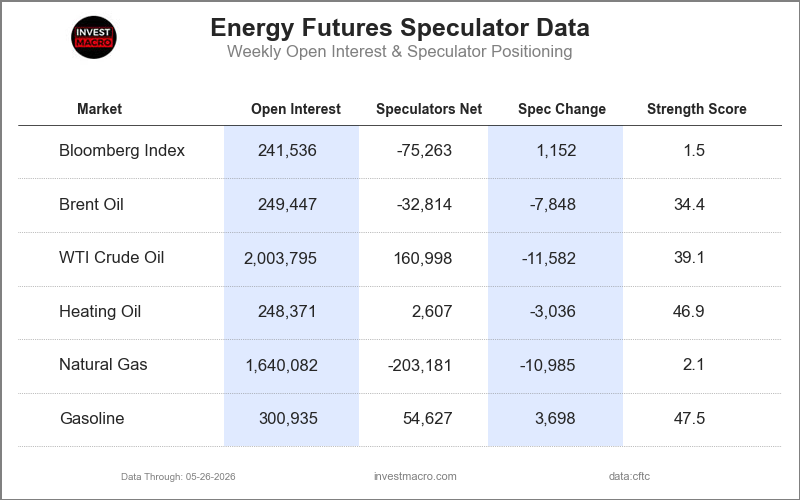
Legend: Weekly Speculators Change | Speculators Current Net Position | Speculators Strength Score compared to last 3-Years (0-100 range)
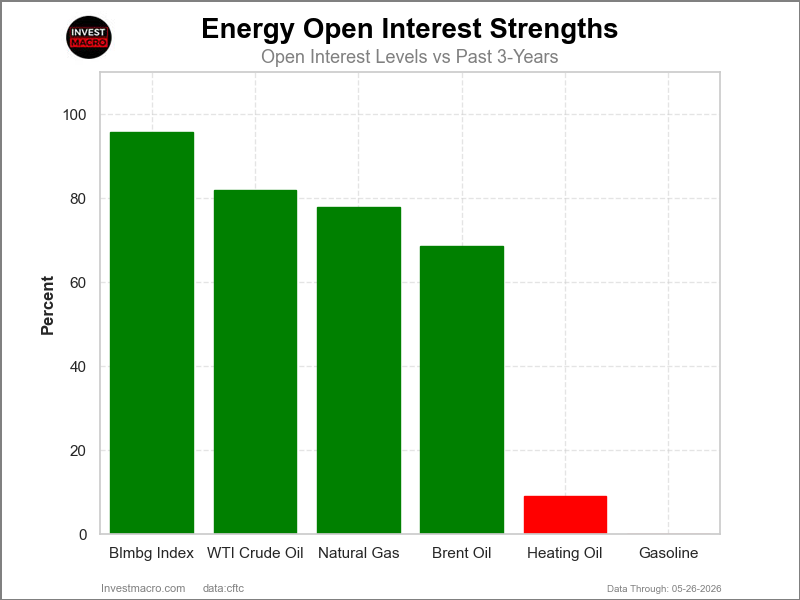
Strength Scores led by Gasoline & Heating Oil
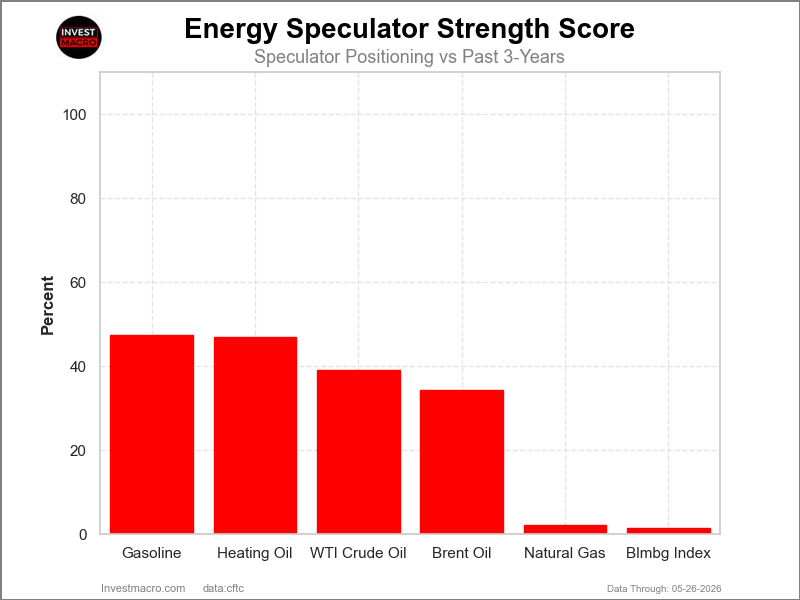
COT Strength Scores (a normalized measure of Speculator positions over a 3-Year range, from 0 to 100 where above 80 is Extreme-Bullish and below 20 is Extreme-Bearish) showed that Gasoline (47.5 percent) and Heating Oil (46.9 percent) lead the energy markets this week.
On the downside, the Bloomberg Index (1.5 percent) and Natural Gas (2.1 percent) comes in at the lowest strength level currently and is in Extreme-Bearish territory (below 20 percent). The next lowest strength score was Brent Oil (34.4 percent).
Strength Statistics:
WTI Crude Oil (39.1 percent) vs WTI Crude Oil previous week (42.8 percent)
Brent Crude Oil (34.4 percent) vs Brent Crude Oil previous week (45.6 percent)
Natural Gas (2.1 percent) vs Natural Gas previous week (9.1 percent)
Gasoline (47.5 percent) vs Gasoline previous week (43.4 percent)
Heating Oil (46.9 percent) vs Heating Oil previous week (50.9 percent)
Bloomberg Commodity Index (1.5 percent) vs Bloomberg Commodity Index previous week (0.3 percent)
Gasoline & Bloomberg Index top the 6-Week Strength Trends
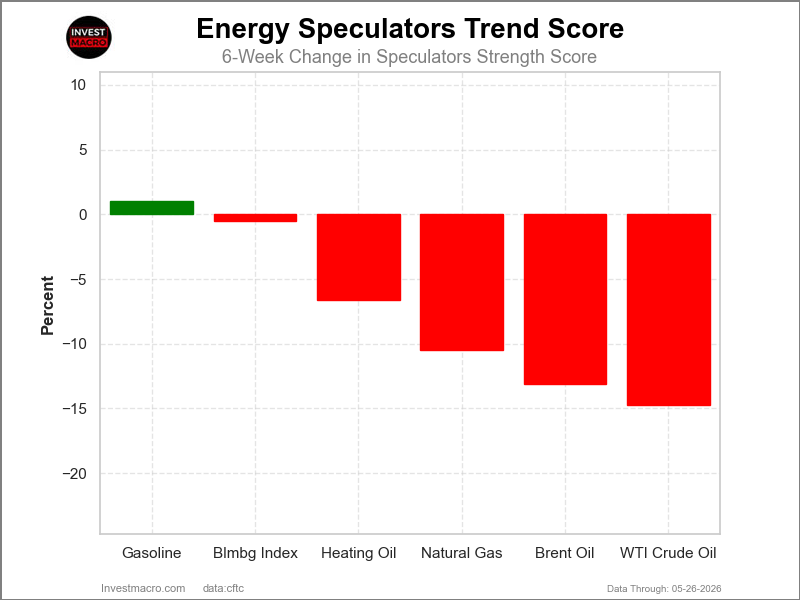
COT Strength Score Trends (or move index, calculates the 6-week changes in strength scores) showed that Gasoline (1.0 percent) leads the past six weeks trends for the energy markets and is the only positive mover at the moment.
WTI Crude (-14.7 percent) leads the downside trend scores currently with Brent Oil (-13.1 percent) as the next market with lower trend scores.
Move Statistics:
WTI Crude Oil (-14.7 percent) vs WTI Crude Oil previous week (-9.5 percent)
Brent Crude Oil (-13.1 percent) vs Brent Crude Oil previous week (8.8 percent)
Natural Gas (-10.5 percent) vs Natural Gas previous week (-5.3 percent)
Gasoline (1.0 percent) vs Gasoline previous week (-9.6 percent)
Heating Oil (-6.6 percent) vs Heating Oil previous week (-4.3 percent)
Bloomberg Commodity Index (-0.5 percent) vs Bloomberg Commodity Index previous week (-1.1 percent)
Individual COT Market Charts:
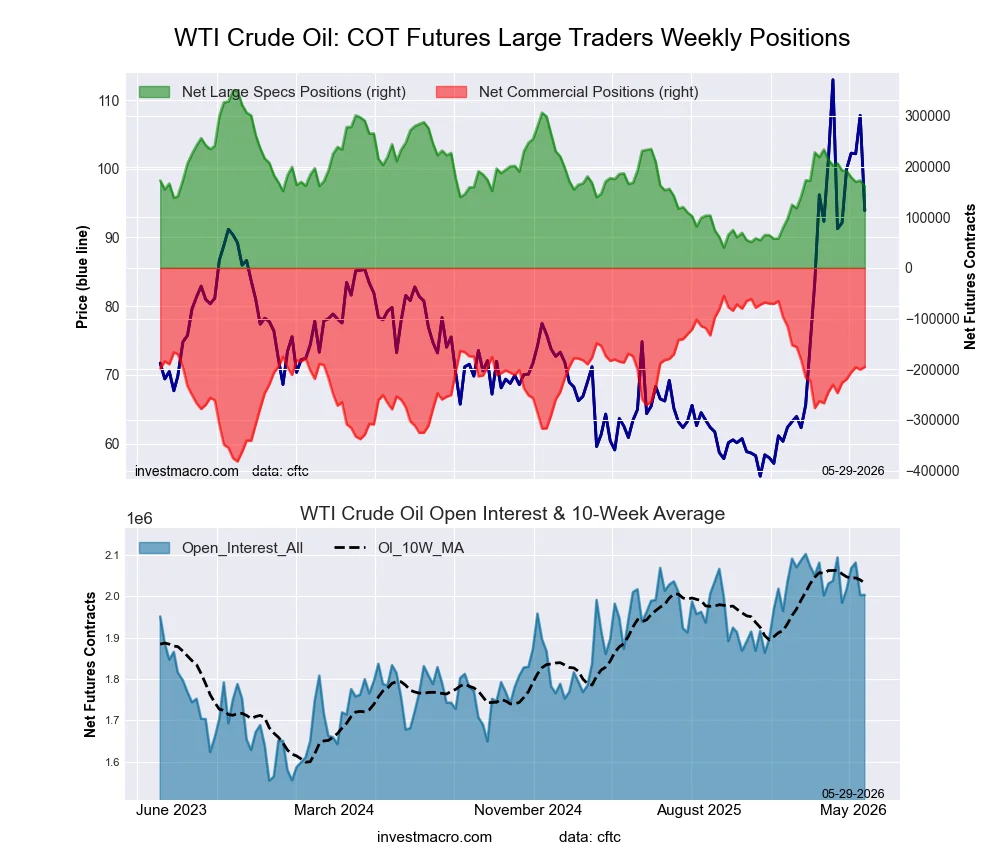
WTI Crude Oil Futures Futures:
 Positioning Notes:
- WTI Crude Oil Futures large speculator standing this week reached a net position of 160,998 contracts in the data reported through Tuesday.
- Weekly Speculator position decrease of -11,582 contracts from the previous week which had a total of 172,580 net contracts.
- This week’s current strength score (range over the past 3 years, measured from 0 to 100) shows the speculators are currently Bearish with a score of 39.1 percent.
- The Commercials are Bullish with a score of 57.0 percent.
- The Small Traders (not shown in chart) are Bullish with a score of 69.0 percent.
Price Trend-Following Model: Uptrend
Our weekly trend-following model classifies the current market price position as: Uptrend.
| WTI Crude Oil Futures Statistics | SPECULATORS | COMMERCIALS | SMALL TRADERS |
| – Percent of Open Interest Longs: | 18.9 | 45.0 | 4.1 |
| – Percent of Open Interest Shorts: | 10.8 | 54.7 | 2.4 |
| – Net Position: | 160,998 | -195,473 | 34,475 |
| – Gross Longs: | 378,088 | 900,997 | 82,778 |
| – Gross Shorts: | 217,090 | 1,096,470 | 48,303 |
| – Long to Short Ratio: | 1.7 to 1 | 0.8 to 1 | 1.7 to 1 |
| NET POSITION TREND: | |||
| – Strength Index Score (3 Year Range Pct): | 39.1 | 57.0 | 69.0 |
| – Strength Index Reading (3 Year Range): | Bearish | Bullish | Bullish |
| NET POSITION MOVEMENT INDEX: | |||
| – 6-Week Change in Strength Index: | -14.7 | 15.7 | -11.7 |
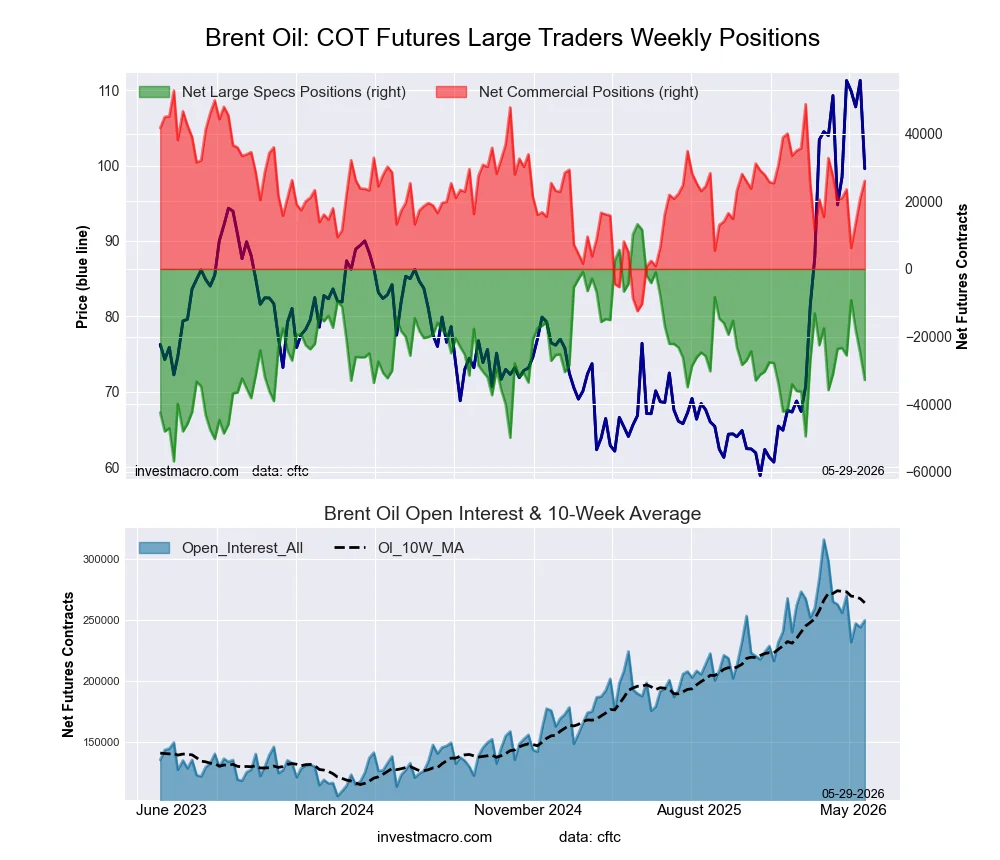
Brent Crude Oil Futures Futures:
 Positioning Notes:
- Brent Crude Oil Futures large speculator standing this week reached a net position of -32,814 contracts in the data reported through Tuesday.
- Weekly Speculator position fall of -7,848 contracts from the previous week which had a total of -24,966 net contracts.
- This week’s current strength score (range over the past 3 years, measured from 0 to 100) shows the speculators are currently Bearish with a score of 34.4 percent.
- The Commercials are Bullish with a score of 59.1 percent.
- The Small Traders (not shown in chart) are Bullish-Extreme with a score of 100.0 percent.
Price Trend-Following Model: Uptrend
Our weekly trend-following model classifies the current market price position as: Uptrend.
| Brent Crude Oil Futures Statistics | SPECULATORS | COMMERCIALS | SMALL TRADERS |
| – Percent of Open Interest Longs: | 23.3 | 35.1 | 5.1 |
| – Percent of Open Interest Shorts: | 36.5 | 24.7 | 2.4 |
| – Net Position: | -32,814 | 26,055 | 6,759 |
| – Gross Longs: | 58,110 | 87,603 | 12,803 |
| – Gross Shorts: | 90,924 | 61,548 | 6,044 |
| – Long to Short Ratio: | 0.6 to 1 | 1.4 to 1 | 2.1 to 1 |
| NET POSITION TREND: | |||
| – Strength Index Score (3 Year Range Pct): | 34.4 | 59.1 | 100.0 |
| – Strength Index Reading (3 Year Range): | Bearish | Bullish | Bullish-Extreme |
| NET POSITION MOVEMENT INDEX: | |||
| – 6-Week Change in Strength Index: | -13.1 | 8.6 | 36.6 |
Natural Gas Futures Futures:
 Positioning Notes:
- Natural Gas Futures large speculator standing this week reached a net position of -203,181 contracts in the data reported through Tuesday.
- Weekly Speculator position fall of -10,985 contracts from the previous week which had a total of -192,196 net contracts.
- This week’s current strength score (range over the past 3 years, measured from 0 to 100) shows the speculators are currently Bearish-Extreme with a score of 2.1 percent.
- The Commercials are Bullish-Extreme with a score of 100.0 percent.
- The Small Traders (not shown in chart) are Bearish with a score of 36.0 percent.
Price Trend-Following Model: Weak Downtrend
Our weekly trend-following model classifies the current market price position as: Weak Downtrend.
| Natural Gas Futures Statistics | SPECULATORS | COMMERCIALS | SMALL TRADERS |
| – Percent of Open Interest Longs: | 14.1 | 36.5 | 3.1 |
| – Percent of Open Interest Shorts: | 26.4 | 24.9 | 2.4 |
| – Net Position: | -203,181 | 190,178 | 13,003 |
| – Gross Longs: | 230,515 | 598,594 | 51,581 |
| – Gross Shorts: | 433,696 | 408,416 | 38,578 |
| – Long to Short Ratio: | 0.5 to 1 | 1.5 to 1 | 1.3 to 1 |
| NET POSITION TREND: | |||
| – Strength Index Score (3 Year Range Pct): | 2.1 | 100.0 | 36.0 |
| – Strength Index Reading (3 Year Range): | Bearish-Extreme | Bullish-Extreme | Bearish |
| NET POSITION MOVEMENT INDEX: | |||
| – 6-Week Change in Strength Index: | -10.5 | 12.3 | -7.5 |
Gasoline Blendstock Futures Futures:
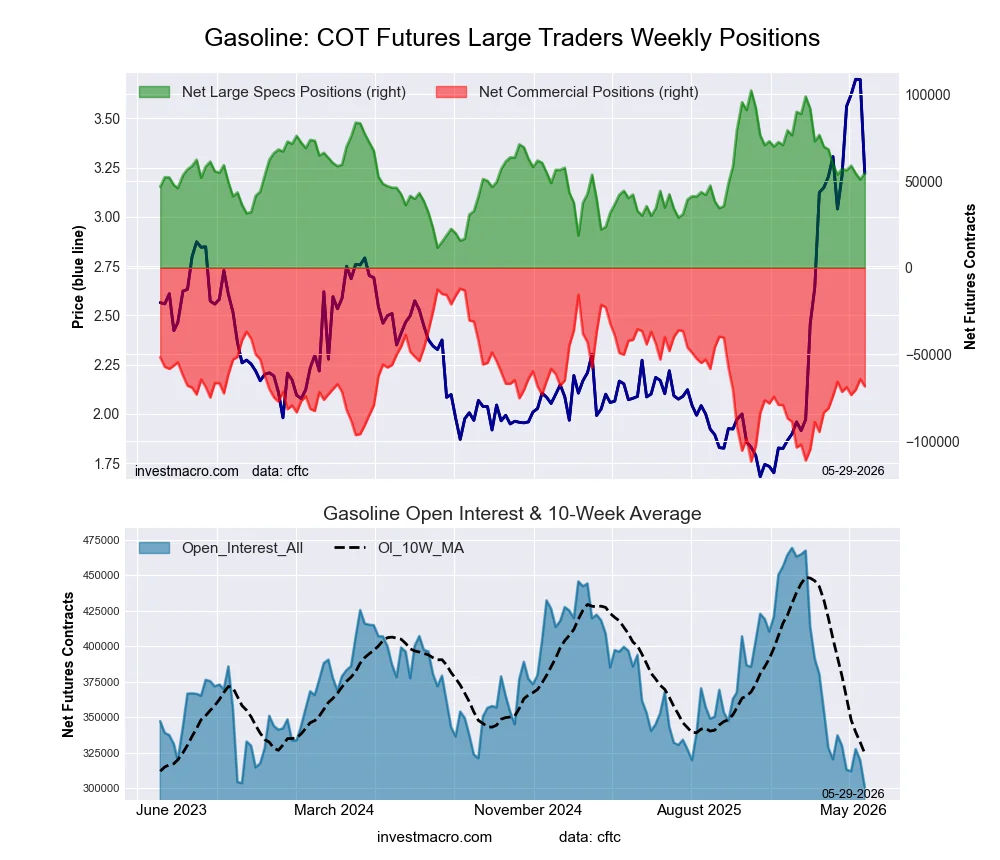 Positioning Notes:
- Gasoline Blendstock Futures large speculator standing this week reached a net position of 54,627 contracts in the data reported through Tuesday.
- Weekly Speculator position lift of 3,698 contracts from the previous week which had a total of 50,929 net contracts.
- This week’s current strength score (range over the past 3 years, measured from 0 to 100) shows the speculators are currently Bearish with a score of 47.5 percent.
- The Commercials are Bearish with a score of 43.5 percent.
- The Small Traders (not shown in chart) are Bullish-Extreme with a score of 80.4 percent.
Price Trend-Following Model: Uptrend
Our weekly trend-following model classifies the current market price position as: Uptrend.
| Nasdaq Mini Futures Statistics | SPECULATORS | COMMERCIALS | SMALL TRADERS |
| – Percent of Open Interest Longs: | 27.2 | 46.3 | 8.8 |
| – Percent of Open Interest Shorts: | 9.0 | 69.0 | 4.2 |
| – Net Position: | 54,627 | -68,417 | 13,790 |
| – Gross Longs: | 81,746 | 139,276 | 26,365 |
| – Gross Shorts: | 27,119 | 207,693 | 12,575 |
| – Long to Short Ratio: | 3.0 to 1 | 0.7 to 1 | 2.1 to 1 |
| NET POSITION TREND: | |||
| – Strength Index Score (3 Year Range Pct): | 47.5 | 43.5 | 80.4 |
| – Strength Index Reading (3 Year Range): | Bearish | Bearish | Bullish-Extreme |
| NET POSITION MOVEMENT INDEX: | |||
| – 6-Week Change in Strength Index: | 1.0 | -2.6 | 8.1 |
#2 Heating Oil NY-Harbor Futures Futures:
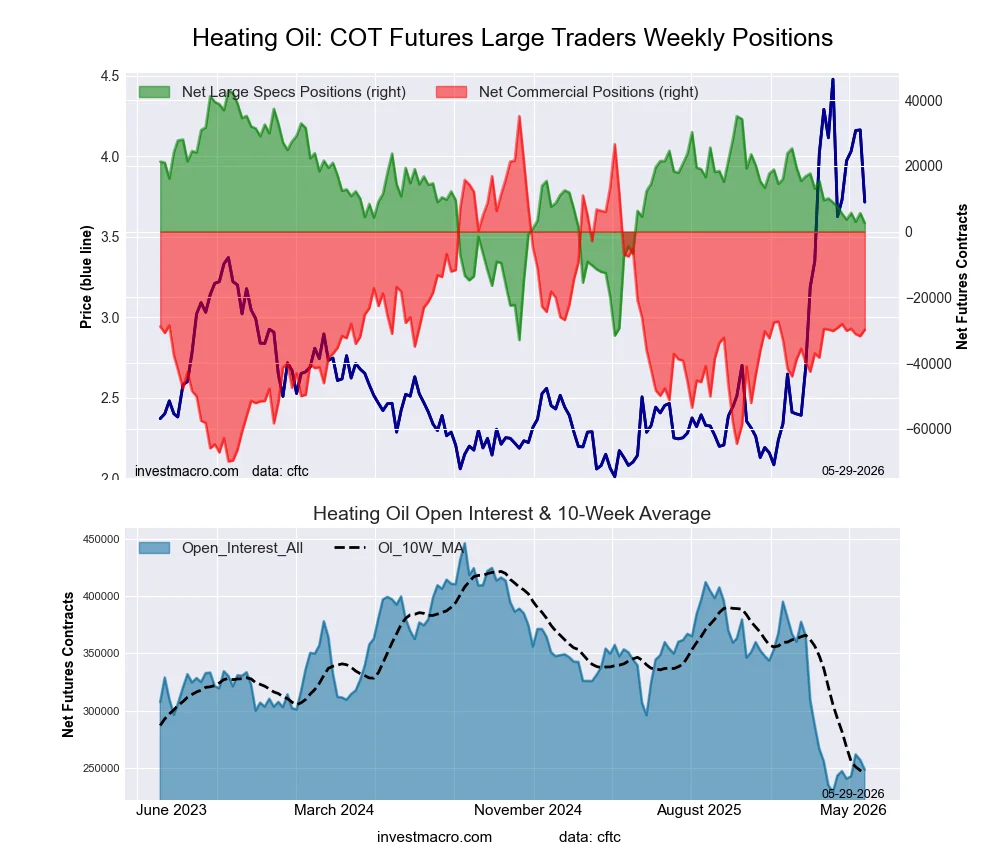 Positioning Notes:
- #2 Heating Oil NY-Harbor Futures large speculator standing this week reached a net position of 2,607 contracts in the data reported through Tuesday.
- Weekly Speculator position fall of -3,036 contracts from the previous week which had a total of 5,643 net contracts.
- This week’s current strength score (range over the past 3 years, measured from 0 to 100) shows the speculators are currently Bearish with a score of 46.9 percent.
- The Commercials are Bearish with a score of 38.1 percent.
- The Small Traders (not shown in chart) are Bullish-Extreme with a score of 92.6 percent.
Price Trend-Following Model: Uptrend
Our weekly trend-following model classifies the current market price position as: Uptrend.
| Heating Oil Futures Statistics | SPECULATORS | COMMERCIALS | SMALL TRADERS |
| – Percent of Open Interest Longs: | 15.5 | 44.1 | 21.3 |
| – Percent of Open Interest Shorts: | 14.5 | 56.2 | 10.3 |
| – Net Position: | 2,607 | -29,852 | 27,245 |
| – Gross Longs: | 38,565 | 109,639 | 52,929 |
| – Gross Shorts: | 35,958 | 139,491 | 25,684 |
| – Long to Short Ratio: | 1.1 to 1 | 0.8 to 1 | 2.1 to 1 |
| NET POSITION TREND: | |||
| – Strength Index Score (3 Year Range Pct): | 46.9 | 38.1 | 92.6 |
| – Strength Index Reading (3 Year Range): | Bearish | Bearish | Bullish-Extreme |
| NET POSITION MOVEMENT INDEX: | |||
| – 6-Week Change in Strength Index: | -6.6 | -0.5 | 15.2 |
Bloomberg Commodity Index Futures Futures:
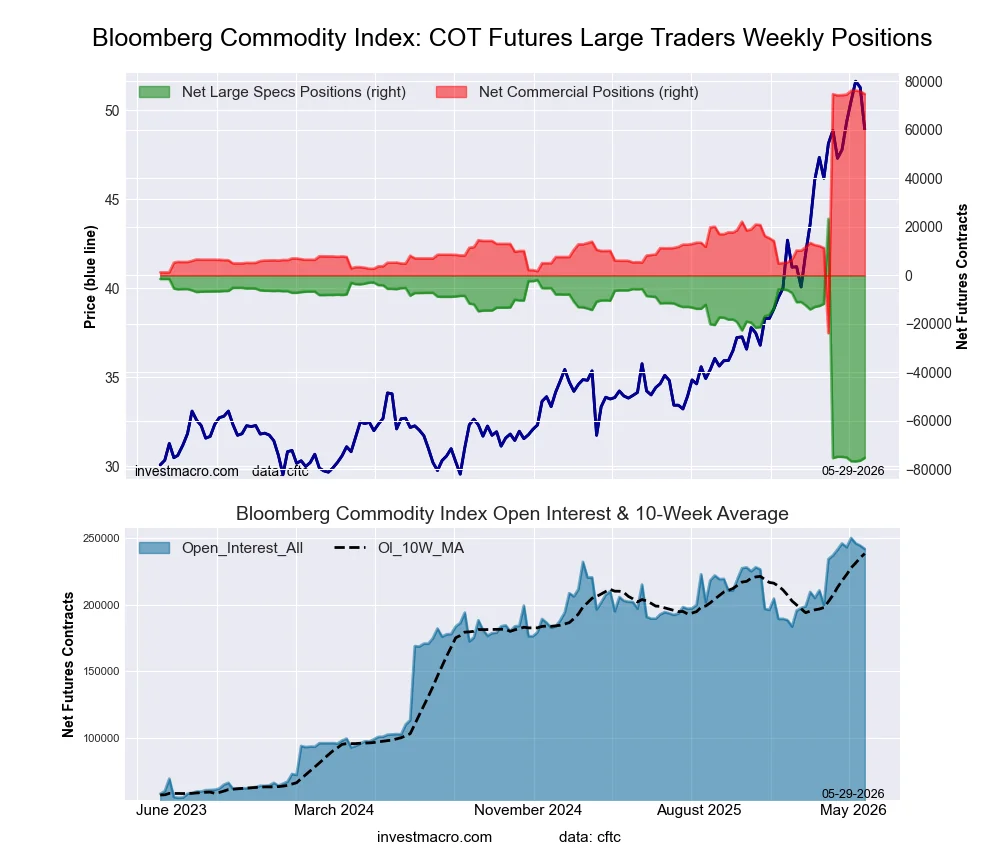 Positioning Notes:
- Bloomberg Commodity Index Futures large speculator standing this week reached a net position of -75,263 contracts in the data reported through Tuesday.
- Weekly Speculator position advance of 1,152 contracts from the previous week which had a total of -76,415 net contracts.
- This week’s current strength score (range over the past 3 years, measured from 0 to 100) shows the speculators are currently Bearish-Extreme with a score of 1.5 percent.
- The Commercials are Bullish-Extreme with a score of 98.6 percent.
- The Small Traders (not shown in chart) are Bullish with a score of 62.8 percent.
Price Trend-Following Model: Uptrend
Our weekly trend-following model classifies the current market price position as: Uptrend.
| Bloomberg Index Futures Statistics | SPECULATORS | COMMERCIALS | SMALL TRADERS |
| – Percent of Open Interest Longs: | 43.4 | 55.8 | 0.2 |
| – Percent of Open Interest Shorts: | 74.6 | 24.8 | 0.0 |
| – Net Position: | -75,263 | 74,793 | 470 |
| – Gross Longs: | 104,841 | 134,793 | 509 |
| – Gross Shorts: | 180,104 | 60,000 | 39 |
| – Long to Short Ratio: | 0.6 to 1 | 2.2 to 1 | 13.1 to 1 |
| NET POSITION TREND: | |||
| – Strength Index Score (3 Year Range Pct): | 1.5 | 98.6 | 62.8 |
| – Strength Index Reading (3 Year Range): | Bearish-Extreme | Bullish-Extreme | Bullish |
| NET POSITION MOVEMENT INDEX: | |||
| – 6-Week Change in Strength Index: | -0.5 | 0.6 | -7.5 |
Article By InvestMacro – Receive our weekly COT Reports by Email
*COT Report: The COT data, released weekly to the public each Friday, is updated through the most recent Tuesday (data is 3 days old) and shows a quick view of how large speculators or non-commercials (for-profit traders) were positioned in the futures markets.
The CFTC categorizes trader positions according to commercial hedgers (traders who use futures contracts for hedging as part of the business), non-commercials (large traders who speculate to realize trading profits) and nonreportable traders (usually small traders/speculators) as well as their open interest (contracts open in the market at time of reporting).See CFTC criteria here.
All information and opinions on this website and contained in this article are for general informational purposes only and do not constitute investment advice.