
By RoboForex Analytical Department
The EUR/USD pair is maintaining a neutral stance, trading around 1.0851 on Wednesday, as the market anticipates crucial updates, including the US inflation data for March and the outcome of the European Central Bank (ECB) meeting on Thursday. Given the significant events on the horizon, investors are exhibiting caution.
The US inflation rate for March is anticipated to show a 0.3% month-on-month increase, slightly below February’s 0.4% rise. The core Consumer Price Index (CPI) is also expected to grow by 0.3% month-on-month. The market consensus leans towards the US Federal Reserve reducing its interest rate by 75 basis points throughout 2024, indicating three separate 25-point cuts.
Despite the increase in yields on US government bonds since the start of the year, the US dollar’s reaction has been relatively subdued, with only a 2.5% appreciation against a 47-basis point widening in benchmark bond yields. This disparity suggests that the US dollar may play catch-up with Treasury yields, or bond yields might decrease to close the gap. This raises questions about the timing of this adjustment.
The ECB’s interest rate is expected to remain at 4.5% per annum, with the European regulator likely to wait for the Fed’s move towards easing monetary policy before making its adjustments. This approach is taken even though the eurozone has effectively managed high inflation ahead of other developed economies, theoretically positioning it to adapt its monetary policy sooner.
Technical analysis of EUR/USD
Free Reports:
 Get our Weekly Commitment of Traders Reports - See where the biggest traders (Hedge Funds and Commercial Hedgers) are positioned in the futures markets on a weekly basis.
 Download Our Metatrader 4 Indicators – Put Our Free MetaTrader 4 Custom Indicators on your charts when you join our Weekly Newsletter
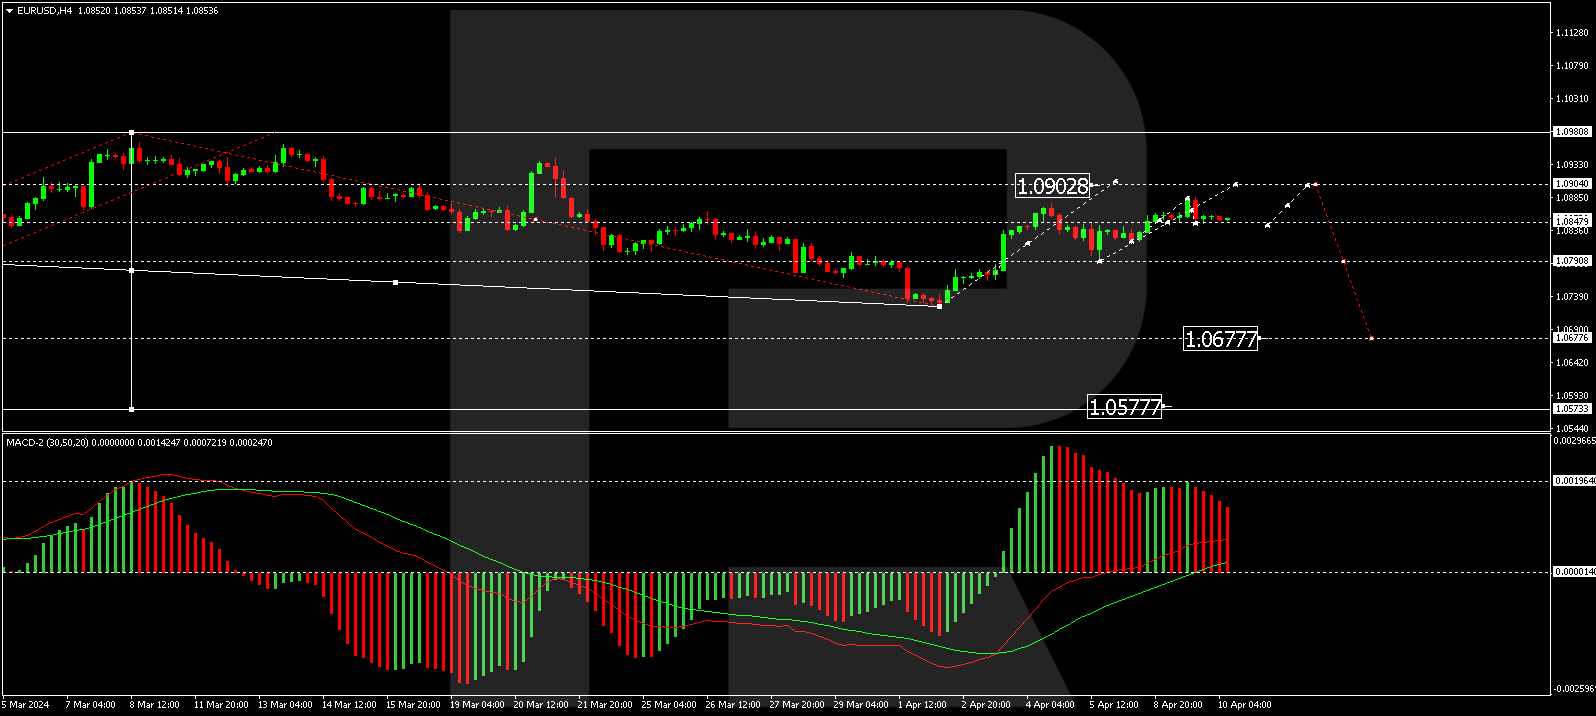
The H4 chart analysis of EUR/USD indicates a correction wave to 1.0883 followed by a decrease to 1.0844. A narrow consolidation range has formed above this level, potentially leading to a correction towards 1.0904 before a new decline towards 1.0790, with a continuation to 1.0700 as a possible target. The MACD indicator, with its signal line above zero and the histogram declining, suggests a potential sharp decrease.
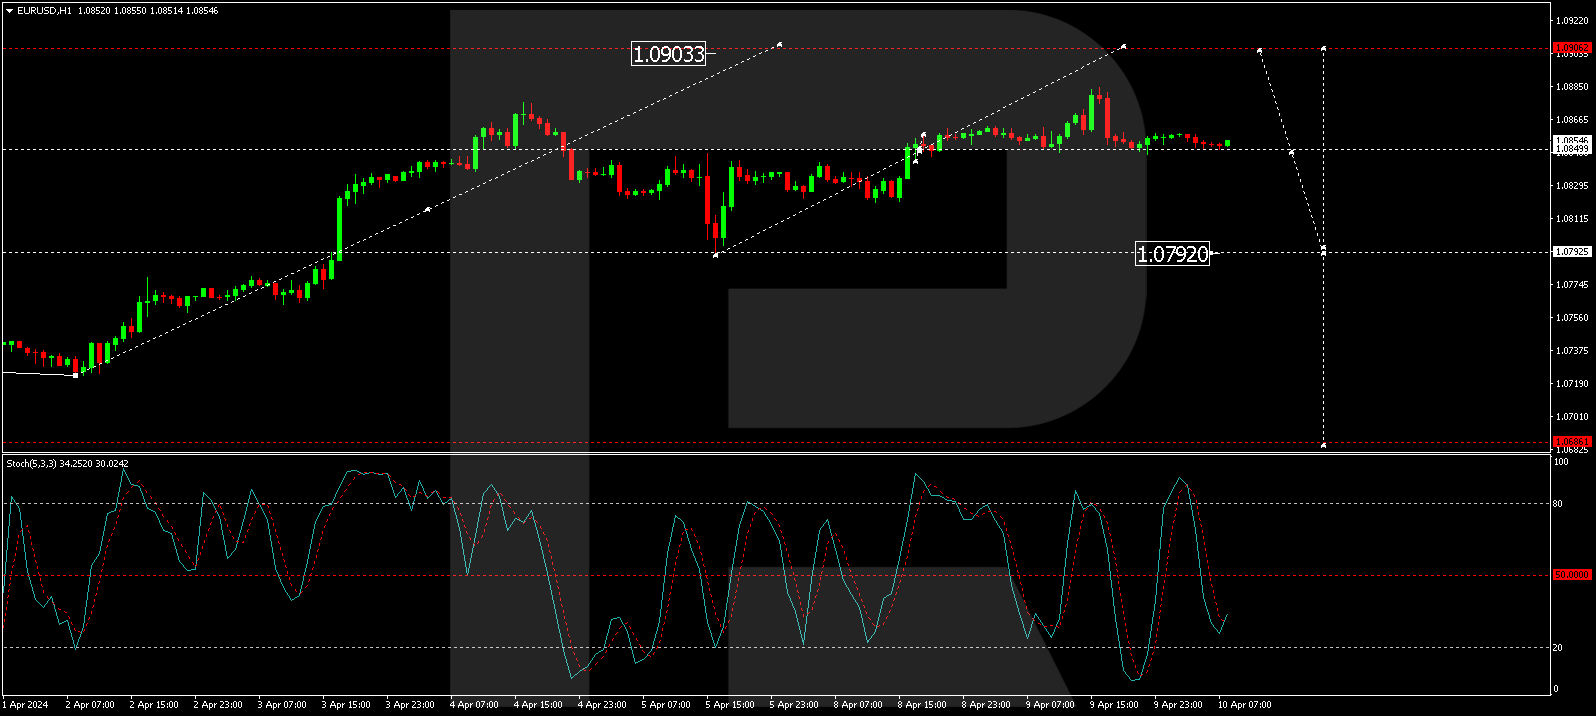
The H1 chart shows a consolidation range of around 1.0850, extending to 1.0884. The market has returned to 1.0843, with the possibility of another correction wave to 1.0904 before a downward movement to 1.0790. The Stochastic oscillator, currently below 50, indicates a continuation of the decline towards 20, supporting the bearish scenario.
Disclaimer
Any forecasts contained herein are based on the author’s particular opinion. This analysis may not be treated as trading advice. RoboForex bears no responsibility for trading results based on trading recommendations and reviews contained herein.

- EUR/USD: Busy Week Ahead Aug 3, 2026
- Positive sentiment in the AI sector supported stock indices. Oil prices remain volatile Aug 3, 2026
- The Tech‑heavy NASDAQ Index jumped by more than 3.3%. The offshore yuan is trading at its highest level since 2023 Jul 31, 2026
- USD/JPY After Volatility: Multiple Events in One Day Jul 31, 2026
- The US indices sell off amid renewed US-Iran clashes. Oil jumps by 7% Jul 30, 2026
- USD/JPY Temporary in Equilibrium: Multiple Factors in Focus Jul 30, 2026
- GBP/USD at Month’s Lows: The Outlook Remains Weak Jul 29, 2026
- Crude oil falls below $80 per barrel. Australia sees inflation slowdown Jul 29, 2026
- The US Tech sector hit by sell‑off. Oil prices decline on renewed negotiations Jul 28, 2026
- Gold Declines, Focus on Fed and Falling Oil Prices Jul 28, 2026
