By InvestMacro
Here are the latest charts and statistics for the Commitment of Traders (COT) reports data published by the Commodities Futures Trading Commission (CFTC).
The latest COT data is updated through Tuesday June 24th and shows a quick view of how large traders (for-profit speculators and commercial entities) were positioned in the futures markets.
Weekly Speculator Changes led by Wheat & Cotton

The COT soft commodities markets speculator bets were overall lower this week as just three out of the eleven softs markets we cover had higher positioning while the other eight markets had lower speculator contracts.
Leading the gains for the softs markets was Wheat (13,390 contracts) with Cotton (5,439 contracts) and Soybean Oil (157 contracts) also having positive weeks.
The markets with the declines in speculator bets this week were Soybeans (-29,353 contracts), Corn (-23,326 contracts), Soybean Meal (-16,876 contracts), Coffee (-4,750 contracts), Cocoa (-4,110 contracts), Live Cattle (-2,477 contracts), Lean Hogs (-1,312 contracts) and with Sugar (-79 contracts) also registering lower bets on the week.
Soft Commodities Data:

Legend: Weekly Speculators Change | Speculators Current Net Position | Speculators Strength Score compared to last 3-Years (0-100 range)
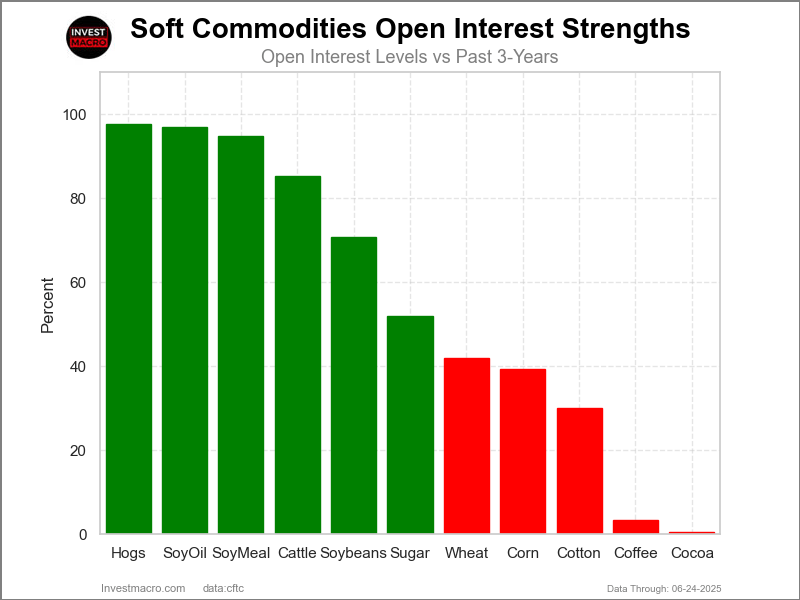
Strength Scores led by Lean Hogs & Live Cattle

COT Strength Scores (a normalized measure of Speculator positions over a 3-Year range, from 0 to 100 where above 80 is Extreme-Bullish and below 20 is Extreme-Bearish) showed that Lean Hogs (99 percent) and Live Cattle (83 percent) lead the softs markets this week. Soybean Oil (77 percent), Soybeans (65 percent) and Coffee (56 percent) come in as the next highest in the weekly strength scores.
On the downside, Soybean Meal (0 percent), Sugar (0 percent), Corn (18 percent) and the Cotton (19 percent) come in at the lowest strength levels currently and are in Extreme-Bearish territory (below 20 percent).
Strength Statistics:
Corn (18.4 percent) vs Corn previous week (21.6 percent)
Sugar (0.0 percent) vs Sugar previous week (0.0 percent)
Coffee (56.1 percent) vs Coffee previous week (60.7 percent)
Soybeans (64.8 percent) vs Soybeans previous week (72.3 percent)
Soybean Oil (76.9 percent) vs Soybean Oil previous week (76.8 percent)
Soybean Meal (0.0 percent) vs Soybean Meal previous week (6.7 percent)
Live Cattle (83.1 percent) vs Live Cattle previous week (85.5 percent)
Lean Hogs (99.0 percent) vs Lean Hogs previous week (100.0 percent)
Cotton (18.9 percent) vs Cotton previous week (15.6 percent)
Cocoa (23.1 percent) vs Cocoa previous week (27.3 percent)
Wheat (37.1 percent) vs Wheat previous week (26.5 percent)
Wheat & Lean Hogs top the 6-Week Strength Trends

COT Strength Score Trends (or move index, calculates the 6-week changes in strength scores) showed that Wheat (37 percent) and Lean Hogs (36 percent) lead the past six weeks trends for soft commodities.
Sugar (-23 percent) leads the downside trend scores currently with Corn (-20 percent), Coffee (-14 percent) and Soybean Meal (-10 percent) following next with lower trend scores.
Strength Trend Statistics:
Corn (-20.2 percent) vs Corn previous week (-30.4 percent)
Sugar (-23.3 percent) vs Sugar previous week (-21.3 percent)
Coffee (-14.4 percent) vs Coffee previous week (-13.0 percent)
Soybeans (-2.4 percent) vs Soybeans previous week (9.2 percent)
Soybean Oil (-5.9 percent) vs Soybean Oil previous week (-2.0 percent)
Soybean Meal (-9.9 percent) vs Soybean Meal previous week (-2.1 percent)
Live Cattle (-4.3 percent) vs Live Cattle previous week (0.0 percent)
Lean Hogs (36.4 percent) vs Lean Hogs previous week (44.4 percent)
Cotton (-8.2 percent) vs Cotton previous week (-16.1 percent)
Cocoa (-8.1 percent) vs Cocoa previous week (0.1 percent)
Wheat (37.1 percent) vs Wheat previous week (18.1 percent)
Individual Soft Commodities Markets:
CORN Futures:
 The CORN large speculator standing this week totaled a net position of -130,570 contracts in the data reported through Tuesday. This was a weekly lowering of -23,326 contracts from the previous week which had a total of -107,244 net contracts.
This week’s current strength score (the trader positioning range over the past three years, measured from 0 to 100) shows the speculators are currently Bearish-Extreme with a score of 18.4 percent. The commercials are Bullish with a score of 78.9 percent and the small traders (not shown in chart) are Bullish-Extreme with a score of 91.5 percent.
Price Trend-Following Model: Strong Downtrend
Our weekly trend-following model classifies the current market price position as: Strong Downtrend.
| CORN Futures Statistics | SPECULATORS | COMMERCIALS | SMALL TRADERS |
| – Percent of Open Interest Longs: | 18.8 | 46.3 | 10.3 |
| – Percent of Open Interest Shorts: | 27.4 | 36.9 | 11.2 |
| – Net Position: | -130,570 | 143,528 | -12,958 |
| – Gross Longs: | 289,305 | 710,288 | 158,516 |
| – Gross Shorts: | 419,875 | 566,760 | 171,474 |
| – Long to Short Ratio: | 0.7 to 1 | 1.3 to 1 | 0.9 to 1 |
| NET POSITION TREND: | | | |
| – Strength Index Score (3 Year Range Pct): | 18.4 | 78.9 | 91.5 |
| – Strength Index Reading (3 Year Range): | Bearish-Extreme | Bullish | Bullish-Extreme |
| NET POSITION MOVEMENT INDEX: | | | |
| – 6-Week Change in Strength Index: | -20.2 | 19.8 | 21.3 |
SUGAR Futures:
 The SUGAR large speculator standing this week totaled a net position of -47,220 contracts in the data reported through Tuesday. This was a weekly decrease of -79 contracts from the previous week which had a total of -47,141 net contracts.
This week’s current strength score (the trader positioning range over the past three years, measured from 0 to 100) shows the speculators are currently Bearish-Extreme with a score of 0.0 percent. The commercials are Bullish-Extreme with a score of 100.0 percent and the small traders (not shown in chart) are Bearish-Extreme with a score of 15.0 percent.
Price Trend-Following Model: Downtrend
Our weekly trend-following model classifies the current market price position as: Downtrend.
| SUGAR Futures Statistics | SPECULATORS | COMMERCIALS | SMALL TRADERS |
| – Percent of Open Interest Longs: | 23.4 | 53.3 | 8.5 |
| – Percent of Open Interest Shorts: | 28.9 | 47.3 | 9.0 |
| – Net Position: | -47,220 | 51,407 | -4,187 |
| – Gross Longs: | 201,571 | 458,220 | 72,992 |
| – Gross Shorts: | 248,791 | 406,813 | 77,179 |
| – Long to Short Ratio: | 0.8 to 1 | 1.1 to 1 | 0.9 to 1 |
| NET POSITION TREND: | | | |
| – Strength Index Score (3 Year Range Pct): | 0.0 | 100.0 | 15.0 |
| – Strength Index Reading (3 Year Range): | Bearish-Extreme | Bullish-Extreme | Bearish-Extreme |
| NET POSITION MOVEMENT INDEX: | | | |
| – 6-Week Change in Strength Index: | -23.3 | 21.4 | -9.0 |
COFFEE Futures:
 The COFFEE large speculator standing this week totaled a net position of 31,154 contracts in the data reported through Tuesday. This was a weekly decrease of -4,750 contracts from the previous week which had a total of 35,904 net contracts.
This week’s current strength score (the trader positioning range over the past three years, measured from 0 to 100) shows the speculators are currently Bullish with a score of 56.1 percent. The commercials are Bearish with a score of 45.7 percent and the small traders (not shown in chart) are Bearish with a score of 45.3 percent.
Price Trend-Following Model: Strong Downtrend
Our weekly trend-following model classifies the current market price position as: Strong Downtrend.
| COFFEE Futures Statistics | SPECULATORS | COMMERCIALS | SMALL TRADERS |
| – Percent of Open Interest Longs: | 30.8 | 42.5 | 5.4 |
| – Percent of Open Interest Shorts: | 9.7 | 64.7 | 4.3 |
| – Net Position: | 31,154 | -32,779 | 1,625 |
| – Gross Longs: | 45,467 | 62,584 | 7,984 |
| – Gross Shorts: | 14,313 | 95,363 | 6,359 |
| – Long to Short Ratio: | 3.2 to 1 | 0.7 to 1 | 1.3 to 1 |
| NET POSITION TREND: | | | |
| – Strength Index Score (3 Year Range Pct): | 56.1 | 45.7 | 45.3 |
| – Strength Index Reading (3 Year Range): | Bullish | Bearish | Bearish |
| NET POSITION MOVEMENT INDEX: | | | |
| – 6-Week Change in Strength Index: | -14.4 | 14.9 | -11.8 |
SOYBEANS Futures:
 The SOYBEANS large speculator standing this week totaled a net position of 55,870 contracts in the data reported through Tuesday. This was a weekly fall of -29,353 contracts from the previous week which had a total of 85,223 net contracts.
This week’s current strength score (the trader positioning range over the past three years, measured from 0 to 100) shows the speculators are currently Bullish with a score of 64.8 percent. The commercials are Bearish with a score of 32.6 percent and the small traders (not shown in chart) are Bullish with a score of 77.7 percent.
Price Trend-Following Model: Weak Uptrend
Our weekly trend-following model classifies the current market price position as: Weak Uptrend.
| SOYBEANS Futures Statistics | SPECULATORS | COMMERCIALS | SMALL TRADERS |
| – Percent of Open Interest Longs: | 22.7 | 49.8 | 5.8 |
| – Percent of Open Interest Shorts: | 16.0 | 54.9 | 7.4 |
| – Net Position: | 55,870 | -42,557 | -13,313 |
| – Gross Longs: | 190,265 | 417,621 | 48,705 |
| – Gross Shorts: | 134,395 | 460,178 | 62,018 |
| – Long to Short Ratio: | 1.4 to 1 | 0.9 to 1 | 0.8 to 1 |
| NET POSITION TREND: | | | |
| – Strength Index Score (3 Year Range Pct): | 64.8 | 32.6 | 77.7 |
| – Strength Index Reading (3 Year Range): | Bullish | Bearish | Bullish |
| NET POSITION MOVEMENT INDEX: | | | |
| – 6-Week Change in Strength Index: | -2.4 | 2.5 | -0.3 |
SOYBEAN OIL Futures:
 The SOYBEAN OIL large speculator standing this week totaled a net position of 63,489 contracts in the data reported through Tuesday. This was a weekly advance of 157 contracts from the previous week which had a total of 63,332 net contracts.
This week’s current strength score (the trader positioning range over the past three years, measured from 0 to 100) shows the speculators are currently Bullish with a score of 76.9 percent. The commercials are Bearish with a score of 24.1 percent and the small traders (not shown in chart) are Bullish with a score of 71.4 percent.
Price Trend-Following Model: Strong Uptrend
Our weekly trend-following model classifies the current market price position as: Strong Uptrend.
| SOYBEAN OIL Futures Statistics | SPECULATORS | COMMERCIALS | SMALL TRADERS |
| – Percent of Open Interest Longs: | 22.6 | 47.3 | 6.3 |
| – Percent of Open Interest Shorts: | 11.9 | 59.7 | 4.7 |
| – Net Position: | 63,489 | -73,522 | 10,033 |
| – Gross Longs: | 134,185 | 281,052 | 37,716 |
| – Gross Shorts: | 70,696 | 354,574 | 27,683 |
| – Long to Short Ratio: | 1.9 to 1 | 0.8 to 1 | 1.4 to 1 |
| NET POSITION TREND: | | | |
| – Strength Index Score (3 Year Range Pct): | 76.9 | 24.1 | 71.4 |
| – Strength Index Reading (3 Year Range): | Bullish | Bearish | Bullish |
| NET POSITION MOVEMENT INDEX: | | | |
| – 6-Week Change in Strength Index: | -5.9 | 5.3 | 2.2 |
SOYBEAN MEAL Futures:
 The SOYBEAN MEAL large speculator standing this week totaled a net position of -76,064 contracts in the data reported through Tuesday. This was a weekly decline of -16,876 contracts from the previous week which had a total of -59,188 net contracts.
This week’s current strength score (the trader positioning range over the past three years, measured from 0 to 100) shows the speculators are currently Bearish-Extreme with a score of 0.0 percent. The commercials are Bullish-Extreme with a score of 98.3 percent and the small traders (not shown in chart) are Bullish with a score of 78.8 percent.
Price Trend-Following Model: Downtrend
Our weekly trend-following model classifies the current market price position as: Downtrend.
| SOYBEAN MEAL Futures Statistics | SPECULATORS | COMMERCIALS | SMALL TRADERS |
| – Percent of Open Interest Longs: | 17.2 | 51.2 | 9.5 |
| – Percent of Open Interest Shorts: | 29.2 | 43.0 | 5.7 |
| – Net Position: | -76,064 | 51,927 | 24,137 |
| – Gross Longs: | 109,147 | 324,325 | 60,487 |
| – Gross Shorts: | 185,211 | 272,398 | 36,350 |
| – Long to Short Ratio: | 0.6 to 1 | 1.2 to 1 | 1.7 to 1 |
| NET POSITION TREND: | | | |
| – Strength Index Score (3 Year Range Pct): | 0.0 | 98.3 | 78.8 |
| – Strength Index Reading (3 Year Range): | Bearish-Extreme | Bullish-Extreme | Bullish |
| NET POSITION MOVEMENT INDEX: | | | |
| – 6-Week Change in Strength Index: | -9.9 | 7.6 | 32.7 |
LIVE CATTLE Futures:
 The LIVE CATTLE large speculator standing this week totaled a net position of 106,183 contracts in the data reported through Tuesday. This was a weekly decline of -2,477 contracts from the previous week which had a total of 108,660 net contracts.
This week’s current strength score (the trader positioning range over the past three years, measured from 0 to 100) shows the speculators are currently Bullish-Extreme with a score of 83.1 percent. The commercials are Bearish-Extreme with a score of 16.4 percent and the small traders (not shown in chart) are Bearish with a score of 29.2 percent.
Price Trend-Following Model: Uptrend
Our weekly trend-following model classifies the current market price position as: Uptrend.
| LIVE CATTLE Futures Statistics | SPECULATORS | COMMERCIALS | SMALL TRADERS |
| – Percent of Open Interest Longs: | 49.3 | 28.4 | 8.2 |
| – Percent of Open Interest Shorts: | 21.9 | 50.9 | 13.2 |
| – Net Position: | 106,183 | -86,980 | -19,203 |
| – Gross Longs: | 190,895 | 110,015 | 31,781 |
| – Gross Shorts: | 84,712 | 196,995 | 50,984 |
| – Long to Short Ratio: | 2.3 to 1 | 0.6 to 1 | 0.6 to 1 |
| NET POSITION TREND: | | | |
| – Strength Index Score (3 Year Range Pct): | 83.1 | 16.4 | 29.2 |
| – Strength Index Reading (3 Year Range): | Bullish-Extreme | Bearish-Extreme | Bearish |
| NET POSITION MOVEMENT INDEX: | | | |
| – 6-Week Change in Strength Index: | -4.3 | 1.0 | 12.2 |
LEAN HOGS Futures:
 The LEAN HOGS large speculator standing this week totaled a net position of 94,956 contracts in the data reported through Tuesday. This was a weekly decline of -1,312 contracts from the previous week which had a total of 96,268 net contracts.
This week’s current strength score (the trader positioning range over the past three years, measured from 0 to 100) shows the speculators are currently Bullish-Extreme with a score of 99.0 percent. The commercials are Bearish-Extreme with a score of 1.4 percent and the small traders (not shown in chart) are Bearish with a score of 33.0 percent.
Price Trend-Following Model: Strong Uptrend
Our weekly trend-following model classifies the current market price position as: Strong Uptrend.
| LEAN HOGS Futures Statistics | SPECULATORS | COMMERCIALS | SMALL TRADERS |
| – Percent of Open Interest Longs: | 45.4 | 26.0 | 6.4 |
| – Percent of Open Interest Shorts: | 20.1 | 49.3 | 8.4 |
| – Net Position: | 94,956 | -87,562 | -7,394 |
| – Gross Longs: | 170,370 | 97,654 | 24,195 |
| – Gross Shorts: | 75,414 | 185,216 | 31,589 |
| – Long to Short Ratio: | 2.3 to 1 | 0.5 to 1 | 0.8 to 1 |
| NET POSITION TREND: | | | |
| – Strength Index Score (3 Year Range Pct): | 99.0 | 1.4 | 33.0 |
| – Strength Index Reading (3 Year Range): | Bullish-Extreme | Bearish-Extreme | Bearish |
| NET POSITION MOVEMENT INDEX: | | | |
| – 6-Week Change in Strength Index: | 36.4 | -35.1 | -28.7 |
COTTON Futures:
 The COTTON large speculator standing this week totaled a net position of -31,047 contracts in the data reported through Tuesday. This was a weekly lift of 5,439 contracts from the previous week which had a total of -36,486 net contracts.
This week’s current strength score (the trader positioning range over the past three years, measured from 0 to 100) shows the speculators are currently Bearish-Extreme with a score of 18.9 percent. The commercials are Bullish-Extreme with a score of 83.1 percent and the small traders (not shown in chart) are Bearish-Extreme with a score of 15.0 percent.
Price Trend-Following Model: Weak Downtrend
Our weekly trend-following model classifies the current market price position as: Weak Downtrend.
| COTTON Futures Statistics | SPECULATORS | COMMERCIALS | SMALL TRADERS |
| – Percent of Open Interest Longs: | 32.8 | 46.5 | 5.6 |
| – Percent of Open Interest Shorts: | 48.0 | 30.8 | 6.1 |
| – Net Position: | -31,047 | 32,063 | -1,016 |
| – Gross Longs: | 67,277 | 95,211 | 11,433 |
| – Gross Shorts: | 98,324 | 63,148 | 12,449 |
| – Long to Short Ratio: | 0.7 to 1 | 1.5 to 1 | 0.9 to 1 |
| NET POSITION TREND: | | | |
| – Strength Index Score (3 Year Range Pct): | 18.9 | 83.1 | 15.0 |
| – Strength Index Reading (3 Year Range): | Bearish-Extreme | Bullish-Extreme | Bearish-Extreme |
| NET POSITION MOVEMENT INDEX: | | | |
| – 6-Week Change in Strength Index: | -8.2 | 7.1 | 8.6 |
COCOA Futures:
 The COCOA large speculator standing this week totaled a net position of 12,905 contracts in the data reported through Tuesday. This was a weekly decline of -4,110 contracts from the previous week which had a total of 17,015 net contracts.
This week’s current strength score (the trader positioning range over the past three years, measured from 0 to 100) shows the speculators are currently Bearish with a score of 23.1 percent. The commercials are Bullish with a score of 76.2 percent and the small traders (not shown in chart) are Bullish with a score of 64.6 percent.
Price Trend-Following Model: Weak Downtrend
Our weekly trend-following model classifies the current market price position as: Weak Downtrend.
| COCOA Futures Statistics | SPECULATORS | COMMERCIALS | SMALL TRADERS |
| – Percent of Open Interest Longs: | 31.2 | 38.3 | 12.0 |
| – Percent of Open Interest Shorts: | 16.6 | 58.0 | 7.0 |
| – Net Position: | 12,905 | -17,330 | 4,425 |
| – Gross Longs: | 27,510 | 33,815 | 10,574 |
| – Gross Shorts: | 14,605 | 51,145 | 6,149 |
| – Long to Short Ratio: | 1.9 to 1 | 0.7 to 1 | 1.7 to 1 |
| NET POSITION TREND: | | | |
| – Strength Index Score (3 Year Range Pct): | 23.1 | 76.2 | 64.6 |
| – Strength Index Reading (3 Year Range): | Bearish | Bullish | Bullish |
| NET POSITION MOVEMENT INDEX: | | | |
| – 6-Week Change in Strength Index: | -8.1 | 9.9 | -19.0 |
WHEAT Futures:
 The WHEAT large speculator standing this week totaled a net position of -71,192 contracts in the data reported through Tuesday. This was a weekly rise of 13,390 contracts from the previous week which had a total of -84,582 net contracts.
This week’s current strength score (the trader positioning range over the past three years, measured from 0 to 100) shows the speculators are currently Bearish with a score of 37.1 percent. The commercials are Bullish with a score of 67.2 percent and the small traders (not shown in chart) are Bearish with a score of 30.7 percent.
Price Trend-Following Model: Downtrend
Our weekly trend-following model classifies the current market price position as: Downtrend.
| WHEAT Futures Statistics | SPECULATORS | COMMERCIALS | SMALL TRADERS |
| – Percent of Open Interest Longs: | 26.0 | 40.6 | 8.2 |
| – Percent of Open Interest Shorts: | 45.0 | 20.2 | 9.4 |
| – Net Position: | -71,192 | 75,830 | -4,638 |
| – Gross Longs: | 96,882 | 151,403 | 30,543 |
| – Gross Shorts: | 168,074 | 75,573 | 35,181 |
| – Long to Short Ratio: | 0.6 to 1 | 2.0 to 1 | 0.9 to 1 |
| NET POSITION TREND: | | | |
| – Strength Index Score (3 Year Range Pct): | 37.1 | 67.2 | 30.7 |
| – Strength Index Reading (3 Year Range): | Bearish | Bullish | Bearish |
| NET POSITION MOVEMENT INDEX: | | | |
| – 6-Week Change in Strength Index: | 37.1 | -32.8 | -57.1 |
Article By InvestMacro – Receive our weekly COT Newsletter
*COT Report: The COT data, released weekly to the public each Friday, is updated through the most recent Tuesday (data is 3 days old) and shows a quick view of how large speculators or non-commercials (for-profit traders) were positioned in the futures markets.
The CFTC categorizes trader positions according to commercial hedgers (traders who use futures contracts for hedging as part of the business), non-commercials (large traders who speculate to realize trading profits) and nonreportable traders (usually small traders/speculators) as well as their open interest (contracts open in the market at time of reporting). See CFTC criteria here.