Equiom is pleased to announce a major milestone for its trustee services (through Equiom Fiduciary Services (Middle East) Limited and Equiom (Isle of Man) Limited) that it provides on Middle East Workplace Savings plans, with Assets Under Administration (AuA) reaching USD 3 billion in June 2025, up from USD 2.3 billion the previous year.
This achievement reflects significant growth in Equiom’s employee retirement and reward services, underpinned by its strong local commitment to delivering high-quality, scalable solutions tailored to the needs of global employers. Over the past 12 months alone, Equiom has overseen USD 627 million in annual contributions, and is currently implementing six new workplace savings plans for major international clients operating in the Middle East region.
Chris Cain, Client Services Director – Middle East, commented:
“This is a proud moment for our team and an important milestone in the development of our business in the Middle East region and globally. It reflects the trust that our clients place in us to deliver robust, compliant, and efficient workplace savings solutions. We remain committed to delivering exceptional service at a local level to both employers and their employees, while continuing to enhance and evolve our offering to meet the needs of an increasingly global and mobile workforce.”
Nina Johnston, Managing Director of Equiom (Isle of Man) also added:
“This marks a significant milestone for our team. Reaching USD 3 billion in AuA is not just a reflection of recent growth, it’s a testament to the reputation we’ve earned through over two decades of dedicated trustee services to our international pension plan clients in the Middle East. Our globally connected teams remain deeply committed to delivering solutions that stand the test of time and we’re proud to be a trusted partner to so many leading global organisations.”
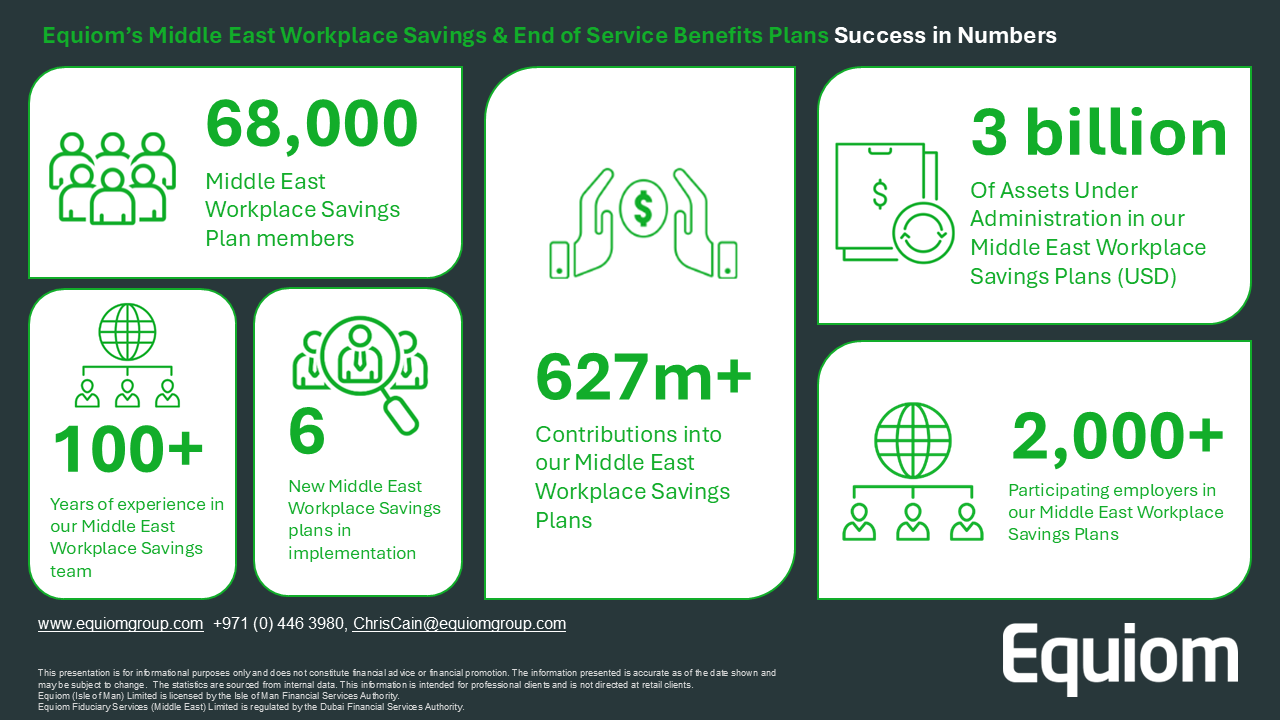
Equiom’s Middle East Workplace Savings and End of Service Benefits Plans Success in Numbers
Equiom supports a diverse international client base, providing services across a range of employee structures including:
- International Pension Plans
- End of Service Benefit Plans / Employee Money Purchase schemes
- Employee Incentives, Equity Plans and Employee Benefit Trusts
- Carried Interest and Co-Investment Structures
With a growing global team of subject matter experts operating from key jurisdictions including the United Arab Emirates, Isle of Man, Jersey, Guernsey, Hong Kong, and beyond, Equiom combines local insight with international reach to support clients wherever they operate.
This milestone follows the recent senior appointments of Mark Lindsay as Head of Employee Retirement & Reward Services and Natalie McGinness as Director at Equiom in Jersey. These developments highlight Equiom’s strategic commitment to strengthening this service line and the Group’s ambition to lead in the delivery of innovative employee reward and retirement solutions.
Whether you are looking to implement a new international pension or equity plan, or enhance your existing end-of-service benefits, Equiom’s specialist teams provide trusted, tailored scalable solutions that help global organisations attract, retain, and reward key talent.
For more information on Equiom’s Employee Retirement & Reward Services, visit: www.equiomgroup.com/employee-
About Equiom
For more than 45 years Equiom has offered fiduciary services to private wealth, institutional and corporate sectors, providing sophisticated clients with professional expertise in delivering international investment, asset protection solutions and corporate services.
With offices in the leading international finance centres, Equiom operate as a truly global entity and take pride in using their global knowledge and insight to create innovative and tailored solutions that drive corporate and private clients towards their objectives.
For media enquiries, please contact:
Dana Al Aawar
Marketing Manager
Equiom Fiduciary Services (Middle East) Limited is regulated by the DFSA. Any information contained herein is intended only for Professional Clients or Market Counterparties as defined by the DFSA, and no other Person should act upon it. Equiom Fiduciary Services (Middle East) Limited only deals with Professional and Market Counterparty Clients and does not hold a Retail endorsement. However, all employers and employees participating in the DEWS plan will be treated as Retail Clients under the DFSA requirements. Any underlying investment options made available within an EOS arrangement could potentially carry investment and market risk, whereby the value of the underlying investments can go down as well as up. The underlying assets within some investment options may be illiquid and or subject to restrictions on their resale. Participants in any solution should undertake their own due diligence and where necessary seek independent professional advice on the available investment options.
Equiom (Isle of Man) Limited is regulated by the Isle of Man Financial Services Authority. For further information on the regulatory status of our companies, please visit www.equiomgroup.com/regulatory