By ForexTime
- Risk-off sentiment hits global equities
- Nvidia earnings & delayed September NFP = volatility
- Traders see less than 45% chance of Fed cut in December
- Bitcoin falls below $90,000 for the first time since April
- Gold hit by cooling Fed cut bets and stabilizing USD
We could be in for a wild week as federal data flows back into markets after the end of the longest US government shutdown in history.
This may add more volatility to a week already packed with high-risk events, Fed speeches, and earnings from Nvidia – the most valuable company in the world.
In the equity space, a risk-off mood swept across the board amid unease about interest rates and tech earnings ahead of Nvidia’s report on Wednesday. Asian equities closed in the red; European shares are flashing red, while US futures point to a negative open.
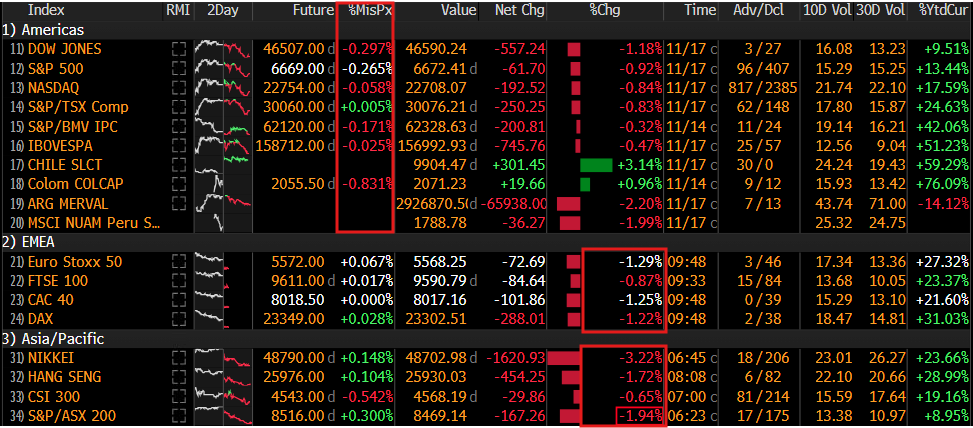
(Source Bloomberg)
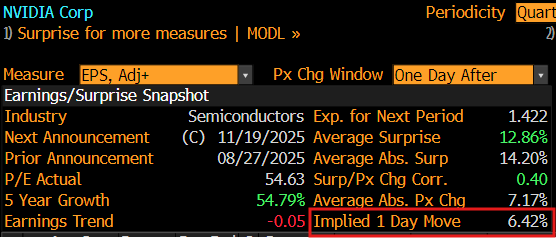
Nvidia earnings – Wednesday, 19th November.
For a company that remains at the heart of the A.I. hype, investors will be looking for another round of solid earnings that would justify its nearly 120% rebound from 2025 lows.
Any fresh updates on Blackwell deliveries, exposure to China, and guidance for Q4 will be in sharp focus. Given the growing chatter around an AI bubble amid circular business deals, Nvidia’s earnings may set the tone in the AI space for the rest of 2025.
September NFP report – Thursday, 20th November
On Thursday, the delayed September NFP report is set to be published. This data, originally scheduled for early October, could trigger sharp movements as it provides critical insights into U.S. labor market strength.
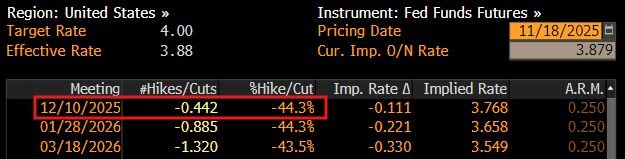
Additionally, a bunch of Fed officials are scheduled to speak this week, which may influence monetary policy expectations. Traders are currently pricing in a 43% chance of a Fed cut by December as of writing. Any major shifts to these expectations may rock equities, FX, commodities and cryptocurrency.
Bitcoin bears back in town?
Speaking of cryptos, Bitcoin has tumbled below $90,000 for the first time in seven months – extending a month-long slide that has erased 2025 gains.
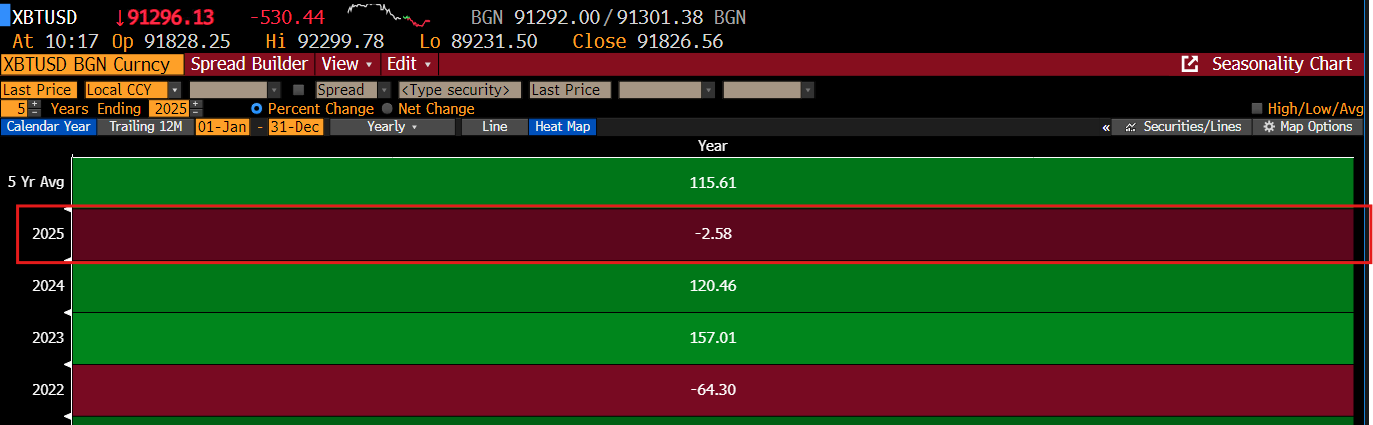
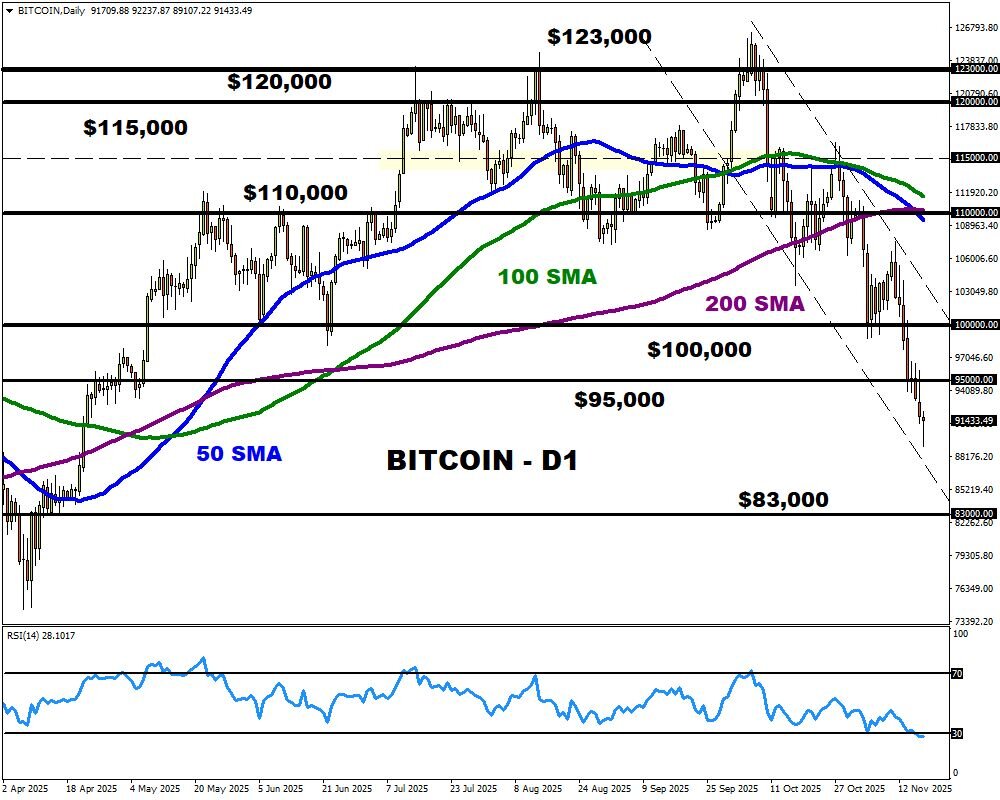
The “OG” crypto is down roughly 17% this month – dragging 2025 gains into negative territory. Renewed concerns about interest rates, ETF outflows, and overall risk aversion have haunted the attraction toward Bitcoin. With prices securing a solid daily close below $95,000, this could signal further downside with the next key level of interest around the 100-week SMA at $83,000.
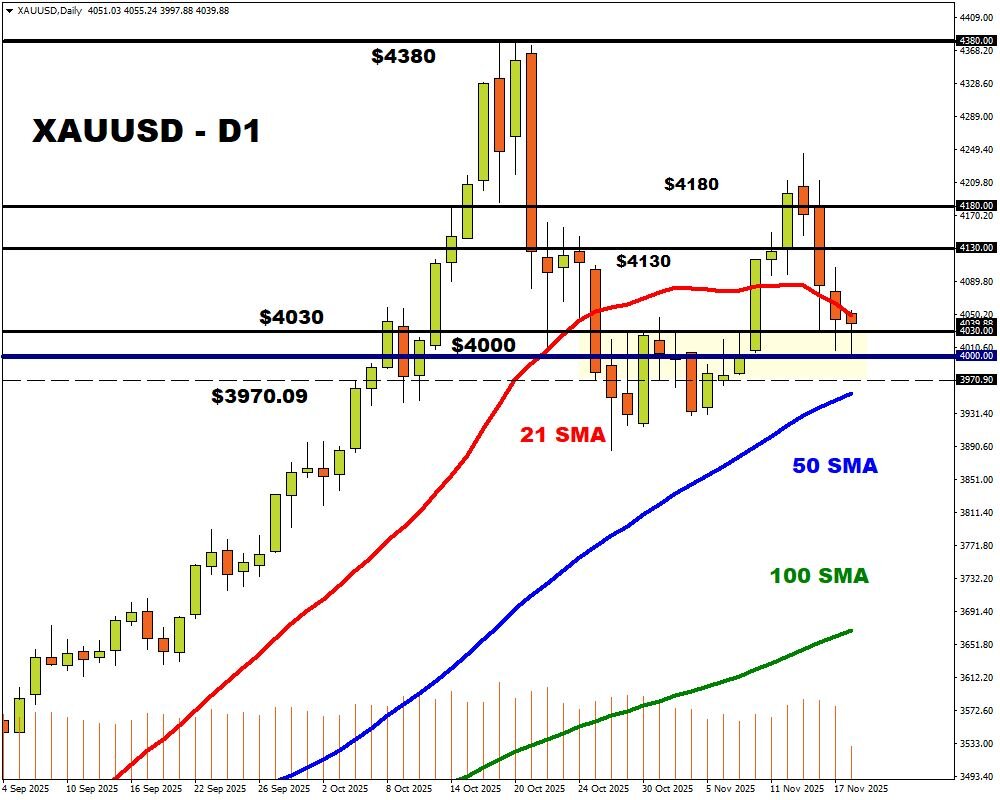
Gold prices to extend losses?
In the commodity space, gold is also taking a hit despite the risk-off mood. The precious metal remains pressured by a stabilizing dollar and cooling expectations around a Fed cut in December. Should incoming US data and Fed officials prompt traders to further slash bets around lower rates, this could spell more pain for gold.
- A solid breakdown below $4000 may open a path toward the 50-day SMA at $3955.
- Should $4030 prove reliable support, prices may rebound toward $4100.
![]() Article by ForexTime
Article by ForexTime
ForexTime Ltd (FXTM) is an award winning international online forex broker regulated by CySEC 185/12 www.forextime.com