By RoboForex Analytical Department
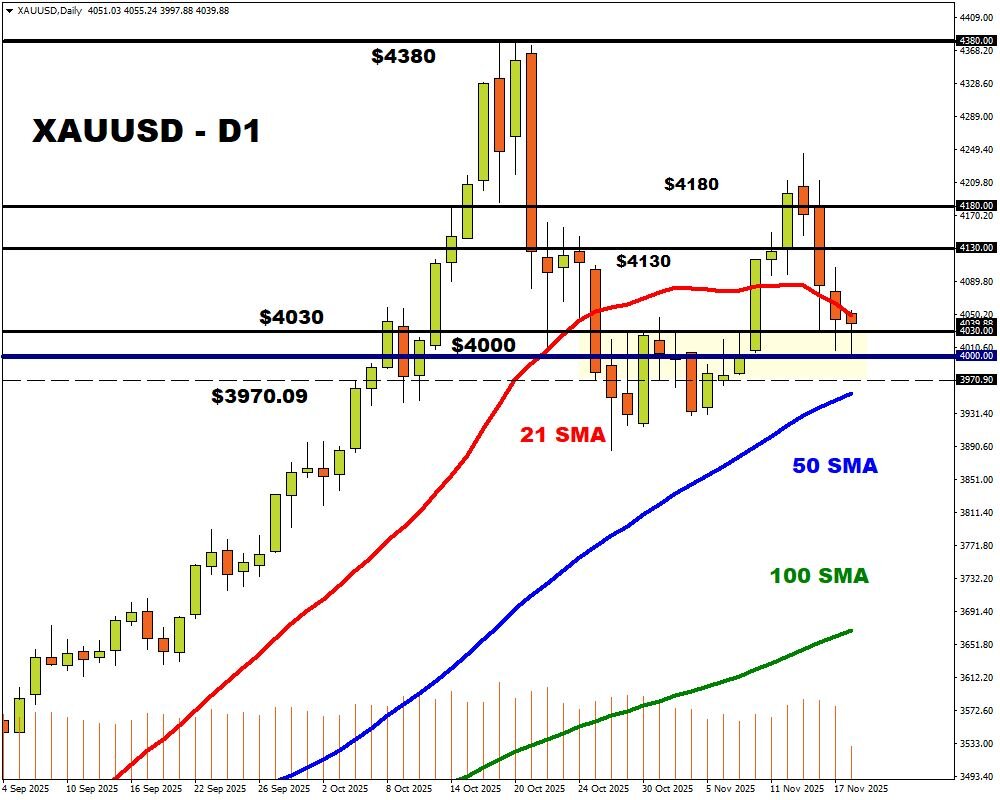
Gold edged lower to 4,060 USD per ounce on Friday, positioning the metal for a modest weekly decline. The shift in sentiment follows a stronger-than-anticipated delayed US employment report, which has tempered expectations for a Federal Reserve rate cut in December.
The Labour Department’s data, delayed by the recent government shutdown, significantly exceeded forecasts: September non-farm payrolls rose by 119,000, well above the expected 50,000. Markets interpreted the report as confirming the Fed’s October assessment—that the labour market is cooling gradually but remains fundamentally stable. However, the unemployment rate climbed to 4.4%, its highest level since 2021, while wage growth came in slightly above expectations at 3.8%.
Notably, the October employment report will not be published separately; the Bureau of Labor Statistics will combine the data with November’s release.
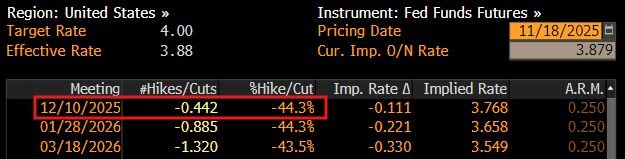
Amid these mixed labour market signals and cautious commentary from Fed officials, markets now price the probability of a December rate cut at just 40%, maintaining downward pressure on gold.
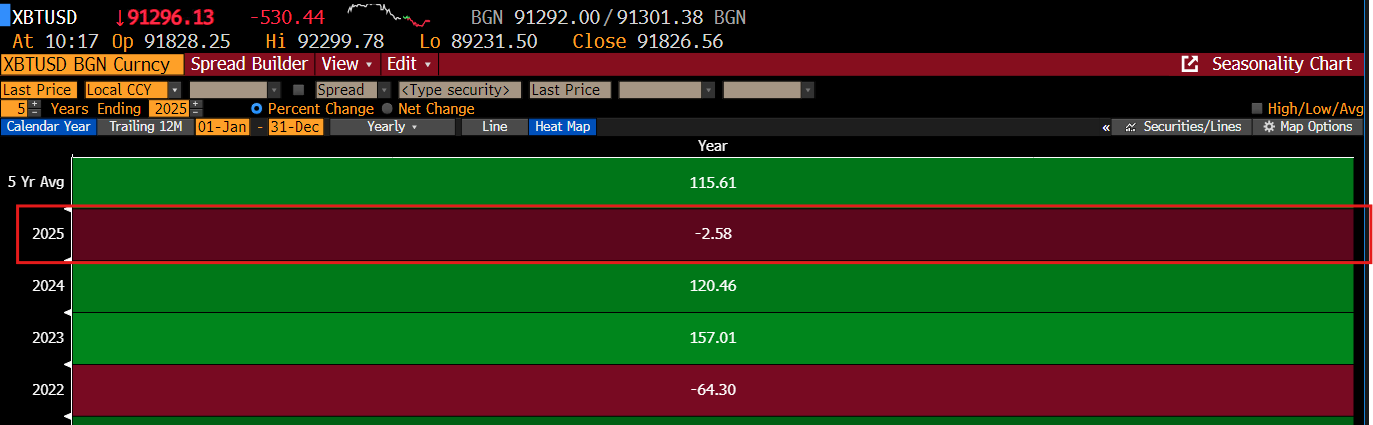
Interestingly, despite a broad shift away from risk assets across global capital markets, gold has yet to see significant safe-haven inflows.
Technical Analysis: XAU/USD
H4 Chart:

On the H4 chart, XAU/USD is forming a consolidation range around 4,076 USD. The pair may first extend this range downward toward 4,019 USD before resuming an upward move to 4,141 USD. A decisive break above this level would open the path for a fifth wave of growth targeting 4,285 USD. The MACD indicator supports this view, with its signal line below zero, suggesting the current correction has further to run before the next leg higher.
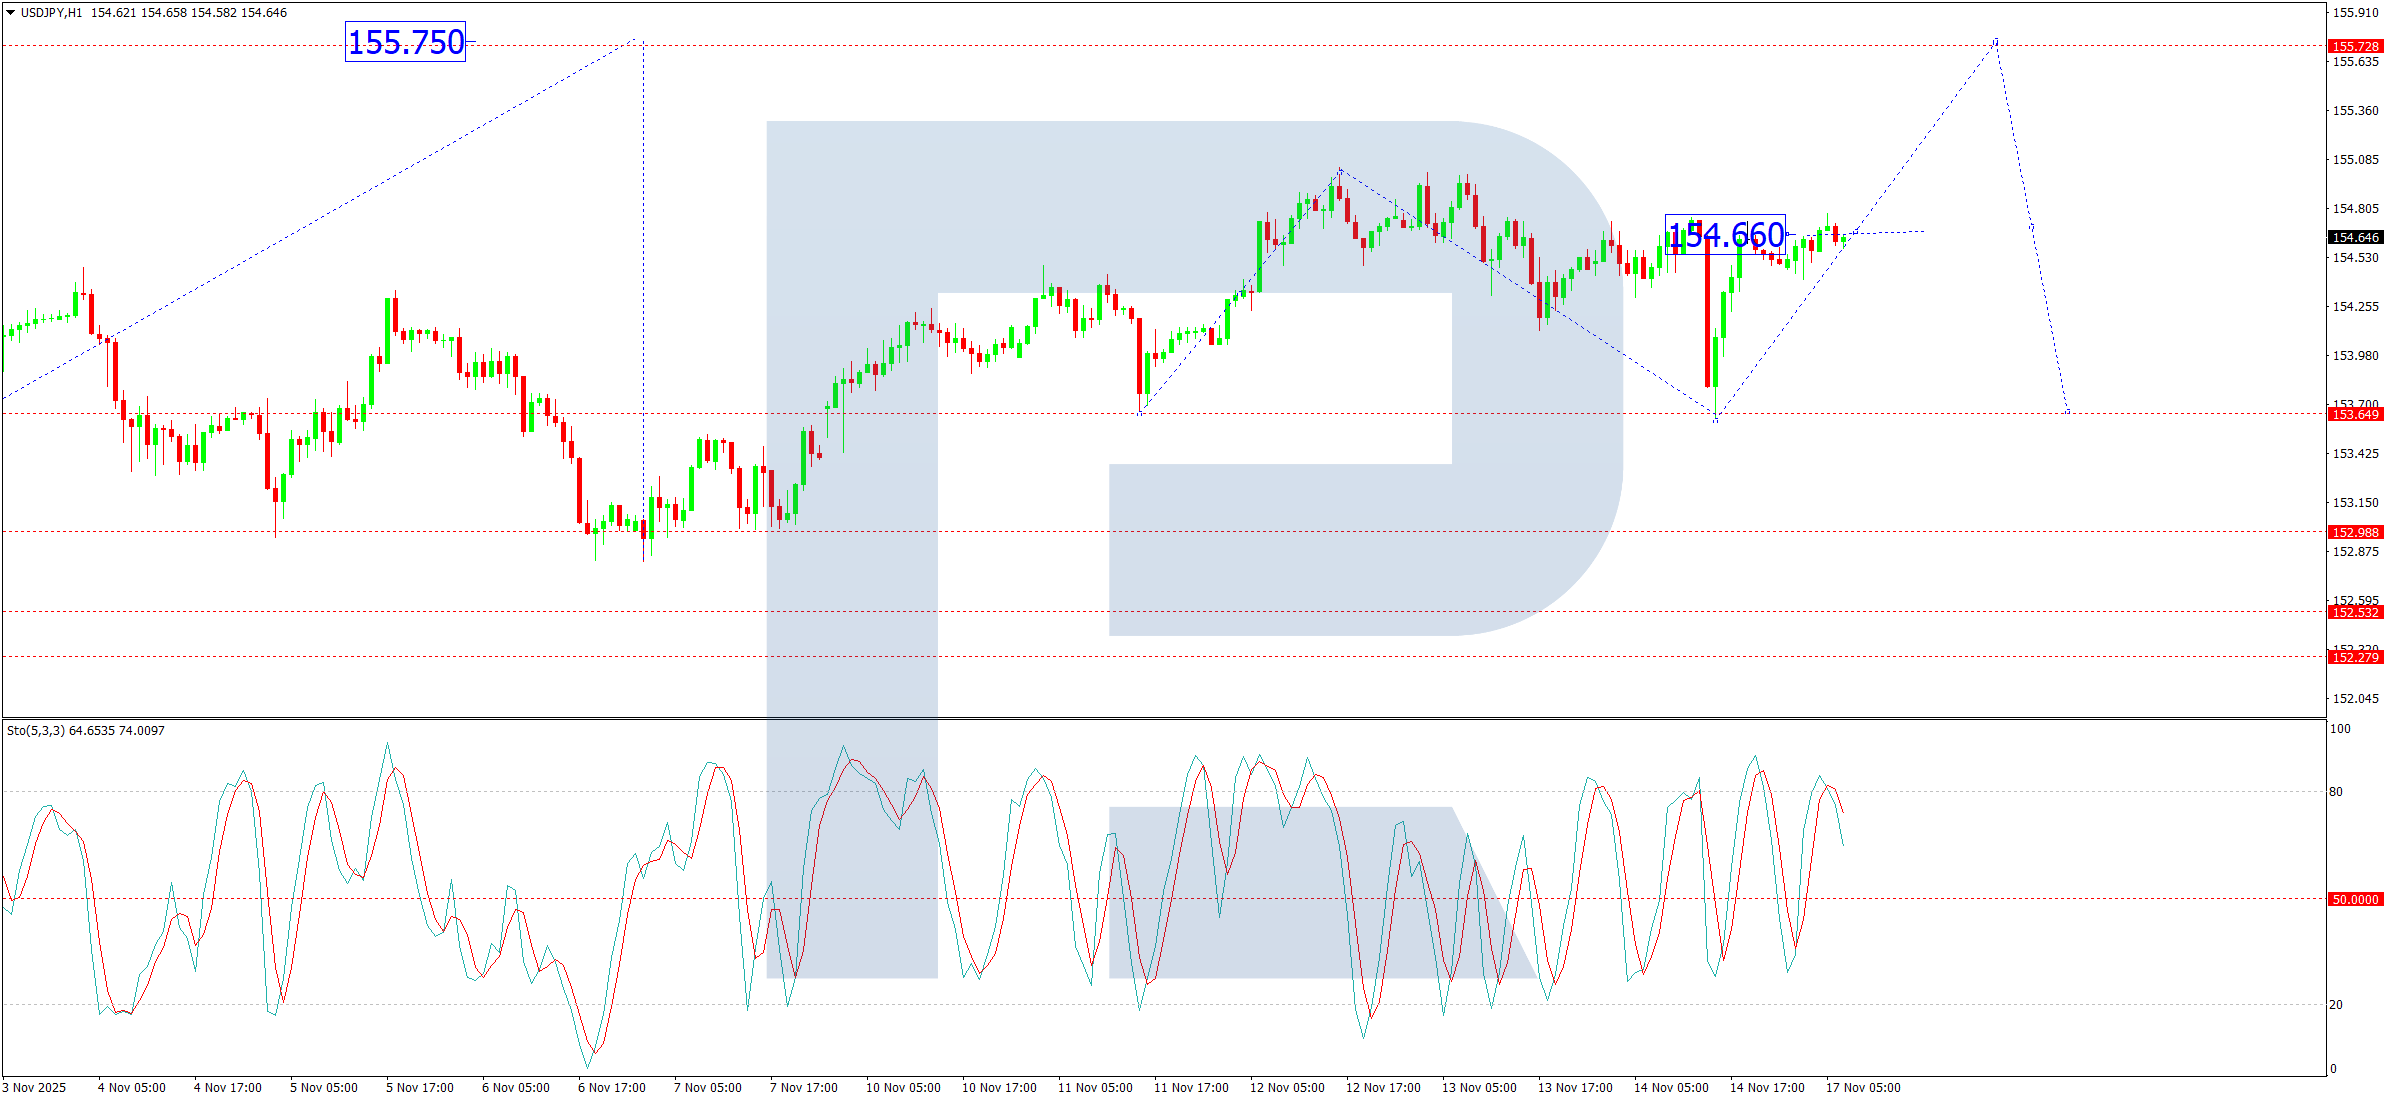
H1 Chart:

On the H1 chart, the market has established a consolidation range around 4,075 USD. A downward wave is expected to develop toward at least 4,020 USD, which would complete the first phase of a larger pattern. This would be followed by a growth wave toward 4,131 USD, a correction back toward 4,020 USD, and then a final advance targeting 4,263 USD. The Stochastic oscillator aligns with this outlook, with its signal line at 20 and beginning to turn upward, suggesting potential for a near-term bounce.
Conclusion
Gold remains range-bound as conflicting labour market data and diminished rate cut expectations counterbalance its traditional safe-haven appeal. The technical picture suggests further consolidation is likely, with a potential dip toward 4,019–4,020 USD offering a buying opportunity for a subsequent move toward 4,141 USD and beyond. The metal’s inability to attract significant safe-haven flows despite equity market weakness remains a concern for bulls, leaving the near-term trajectory heavily dependent on upcoming US economic data and Fed communications.
Disclaimer:
Any forecasts contained herein are based on the author’s particular opinion. This analysis may not be treated as trading advice. RoboForex bears no responsibility for trading results based on trading recommendations and reviews contained herein.