Archive for Financial News – Page 317

Many important economic events will take place this week and volatility in the markets will be high

By JustForex

In the US, weekly jobless claims hit a five-month high, while existing home sales declined for the fifth straight month. These are signs of problems in the labor and housing markets. According to some analysts, the US Federal Reserve may officially announce the beginning of the recession in the United States this week. The US economy is already down 1.6% in the first quarter, and the second quarter is also negative, so, technically, this recession is possible.

At the close of the stock market on Friday, the Dow Jones index (US30) decreased by 0.43% (+1.34% for the week) and the S&P 500 Index (US500) fell by 0.93% (+2.00% for the week). The NASDAQ Technology Index (US100) lost 1.87% on Friday (+2.36% for the week).

It will be a significant week for US stock indices. Besides the important US Federal Reserve meeting on Wednesday and US GDP data on Thursday, technology giants like Amazon (AMZN), Apple (AAPL), Alphabet (GOOG), Meta (META), and Microsoft (MSFT) will report this week as well.

Stock markets in Europe were mostly up on Friday. German DAX (DE30) gained 0.05% (+2.46% for the week), French CAC 40 (FR 40) added 0.25% (+2.42% for the week), Spanish IBEX 35 (ES35) increased by 0.49% (+0.56% for the week), British FTSE 100 (UK100) gained 0.08% (+1.64% for the week).

Last week, the European Central Bank joined many other central banks in raising interest rates as its focus was on fighting inflation rather than a potential economic slowdown. On Friday, ECB chief Christine Lagarde said that the ECB would raise rates as much as needed to bring inflation back to target levels. By narrowing the interest rate differential, the euro has temporarily strengthened. But it should be noted that the US Federal Reserve will raise interest rates by 0.75-1% this week, which will widen the spread again.

US benchmark WTI crude has fallen nearly 3% in the past week, extending its losses over the past three weeks by almost 13%. However, Brent crude jumped by 2.2%, breaking a five-day losing streak of 17%. The situation in the oil market remains very unstable. On the one hand, the White House is trying to lower the price of oil. On the other hand, sanctions against Russia and supply shortage with high demand — these factors do not allow the price to fall.

Last week, precious metal prices rose. “Gold is starting to act as a haven as weakening economic growth will force many central banks to abandon their aggressive tightening plans,” said Ed Moya, head of research US analytical company.

Russia’s war with Ukraine continues. Last week, Russia, Ukraine, Turkey, and UN officials signed an agreement to allow Ukraine to ship grain from a port in Odesa. Despite this, Russian missiles struck the port on Saturday. Russia proved once again that it is a terrorist state. President Vladimir Zelensky, as well as many European officials, condemned Saturday’s attack as “barbarism,” which showed that Moscow could not be trusted under any circumstances.

Asian markets traded lower last week. Japan’s Nikkei 225 (JP225) gained 4.41%, Hong Kong’s Hang Seng (HK50) added 0.63%, and Australia’s S&P/ASX 200 (AU200) increased by 2.81%. At the opening on Monday, the Asian indices are showing a decline. Investors should also pay attention to Inflation Data in Singapore. Analysts forecast consumer price growth to 6.2% (current 5.6%) on an annualized basis. If the data is worse than expected, it may boost the Singapore dollar but at the same time have a negative impact on Asian indices.

In the commodities market, natural gas futures (+18.37%), palladium (+11.05%), platinum (+4.00%), coffee (+2.98%), cotton (+2.75%), copper (+2.74%) and Brent oil (+2.42%) showed the biggest gains over the week. Lumber futures (-10.06%), soybeans (-9.57%), sugar (-7.17%), corn (-6.95%) and wheat (-2.74%) showed the biggest drops.

S&P 500 (F) (US500) 3,961.63 −37.32 (−0.93%)

Dow Jones (US30) 31,899.29 −137.61 (−0.43%)

DAX (DE40) 13,253.68 +7.04 (+0.053%)

FTSE 100 (UK100) 7,276.37 +5.86 (+0.081%)

USD Index 106.55 −0.37 (−0.34%)

Important events for today:
  • – Singapore Consumer Price Index (m/m) at 08:00 (GMT+3);
  • – Eurozone German Ifo Business Climate (m/m) at 11:00 (GMT+3).

By JustForex


This article reflects a personal opinion and should not be interpreted as an investment advice, and/or offer, and/or a persistent request for carrying out financial transactions, and/or a guarantee, and/or a forecast of future events.

Sri Lanka’s crisis: Can the South Asian economy break from the past and find a route to stability?

By Vidhura S Tennekoon, Indiana University 

Sri Lanka has a new president and prime minister – but a change in who leads the crisis-hit South Asian nation alone will not solve the country’s severe economic problems.

Ranil Wickremesinghe – who on July 20, 2022, was voted in by lawmakers to replace fleeing former president Gotabaya Rajapaksa – and his appointed premier Dinesh Gunawardena inherit an economy grappling with record inflation as high as 59%, a currency that has lost almost half its value since March 2022 and severe shortages of daily necessities such as food and fuel. Nearly all economic activity in the country has ground to a halt.

The government’s deficit is so large it can’t afford to pay public workers, and the central bank has almost no foreign currency – needed to finance imports and pay back foreign debt.

In short, Sri Lanka is facing an unprecedented economic crisis, placing tremendous pressure on the new leaders to act fast to fix things.

As an economist and former official at the Central Bank of Sri Lanka, I believe the path forward will be difficult. The country will need to break with past policies and practices that put it in a financial hole while putting in place reforms to get the economy back on track. In particular, there are four key economic challenges the new government will have to address, though they’re all interconnected.

Addressing Sri Lankans’ immediate needs

To avoid the fate of his now exiled predecessor Gotabaya Rajapaksa, President Wickremesinghe will have to address the immediate needs of his people.

After being sworn in, Wickremesinghe said his priority was to ensure that people are able to eat three meals a day.

While food inflation has reached 76%, prices of many basic food items have increased by a higher margin – rice by 160%, wheat flour by 200% and sugar by 164%. To put that in context, a preschool teacher earning minimum wage would need more than a day’s wages to purchase a kilogram (2.2 pounds) of sugar and a kilogram of wheat flour or rice. A cylinder of cooking gas, if they were lucky to find one, would cost more than a half-month’s salary.

Cost of living ranks alongside other pressing issues. Reopening the shuttered schools and universities is another priority. The other urgent need is restoring transportation services. With no fuel to purchase, private bus services are in limbo and public transportation has become an adventure ride, with passengers dangling from the door and windows and even sitting inside the luggage box.

Restoring transportation and electricity services requires foreign currency to import fuel, but support from the International Monetary Fund, which provides financial help to struggling economies through loan packages, is months away. Unless the new president can persuade its regional powerhouses – India and China – to provide more help, economic hardships will continue and life in Sri Lanka will not be normal.

In the past, Sri Lanka has been able to rely on tourism to help bring revenue to the island nation. But this will be impossible while social unrest continues and shortages of essentials limit the country’s ability to serve visitors. Meanwhile, remittances from overseas Sri Lankans have also suffered because of a lack of confidence in the national currency, known as the rupee.

As Wickremesinghe has noted, things will get worse before they get better.

Balancing the budget

The next item on the president’s to-do list will likely be finding a way to bring the budget deficit down. Last year, expenses were 240% of revenue, and 91% more was needed to repay debt. Money printing covered a large portion of this gap but only exacerbated inflation.

The primary reason for Sri Lanka’s current crisis is decades of fiscal mismanagement, with too much spending and too little revenue.

Fixing this problem will require a combination of higher taxes and significant budget cuts. But the budget gap is too wide to eliminate completely the need for money printing. The best that can be hoped for is an aggressive reduction.

Restructuring Sri Lanka’s huge debt

Such budgetary reforms will likely be necessary to solve another challenge Sri Lanka faces: overseas debt.

Sri Lanka has amassed about US$51 billion in foreign debt over the past decades but has virtually no foreign currency with which to pay it back. The government suspended payments on foreign debt in April, sending it into default.

At the end of 2021, about 45% of the debt was owed to private investors, while the rest belonged to countries and multinational institutions. The Asian Development Bank owned the biggest share, at 16%, while Japan, China and the World Bank held 10% apiece.

For Sri Lanka to emerge from its crisis, it will need significant help from the IMF. But the IMF requires assurances that Sri Lanka’s debt sustainability be restored before lending it money.

And other international organizations, such as the World Bank, will not be willing to lend Sri Lanka more until the country signs an agreement with the IMF. And U.S. lawmakers have recently suggested IMF support will be contingent on Sri Lanka’s increasing the independence of its central bank, fighting corruption and doing more to promote the rule of law.

While G-7 countries, the group of leading economies, including Japan, appear willing to help Sri Lanka in its effort to restructure its debt, some bondholders – such as Caribbean-based Hamilton Reserve Bank, which holds just $250 million worthhave already taken legal action to claim their dues.

In May, Sri Lanka took a first step toward restructuring its debt, but it may take several months before the country is able to successfully negotiate with its creditors to ensure debt sustainability.

Garnering public support for reforms

Wickremesinghe’s biggest and most unenviable challenge, however, is less about the economy and more about the politics of fixing it.

He won’t be able to do much about Sri Lanka’s economy until he’s able to bring about political stability. And right now, Sri Lanka remains in turmoil.

Wickremesinghe, who previously served as prime minister appointed by his toppled predecessor, will need a wide mandate and support from opposition politicians if he is to drastically change Sri Lanka’s policies. Upon election, he immediately urged his rivals to join him and “work together to bring the country out of the crisis,” adding, “Our divisions are now over.”

He will also need to address protesters’ demands over reducing executive powers while bringing in strong anti-corruption measures and strengthening democratic institutions.

Yet many doubt Wickremesinghe’s ability to unite Sri Lanka and question his mandate to serve out the remaining term of the presidency. He has been a target of protesters since being appointed president. And a confrontation between armed forces and protesters soon after Wickremesinghe took power doesn’t bode well.

Turning around an economy so deep in crisis will take time. Inflation in Sri Lanka is not believed to have peaked yet, and people will continue to face economic hardships for some time.

But political stability will be needed before Sri Lanka can get out of its economic mess. The fiscal reforms expected by the IMF will be painful and will be viable only with public support, and that of all major political parties in Sri Lanka’s Parliament.The Conversation

About the Author:

Vidhura S Tennekoon, Assistant Professor of Economics, Indiana University

This article is republished from The Conversation under a Creative Commons license. Read the original article.


Europe On Sale: Get It While U Can

By Elliott Wave International

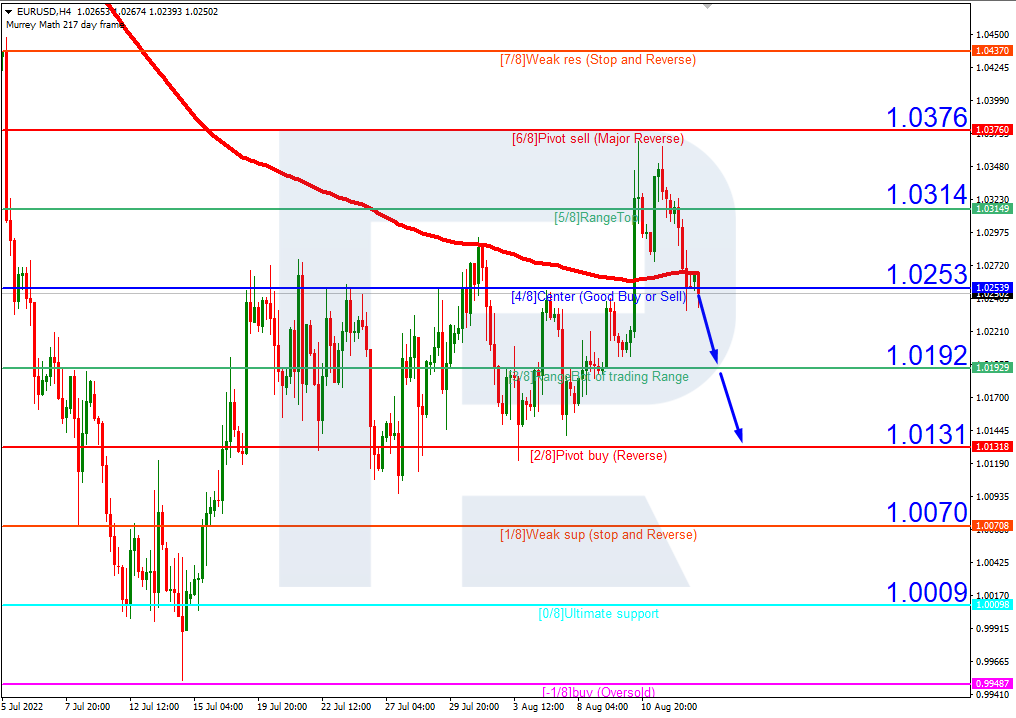
On July 13 and 14, the euro and the U.S. dollar briefly traded at parity — for the first time in 20 years.

Just 19 months ago, EURUSD was at $1.2350. It’s quietly dropped 20%+ since.

Quietly? Yeah, because of all the other fireworks in the market drowned out the news.

What would you have done with this knowledge a year and a half ago?

For one thing, you’d have put off that European vacation until now!

Who could have known? EWI subscribers. Check out this forecast from EWI back on January 8, 2021:

It appears that currencies are delivering the early New Year trend reversal that often occurs. The [Euro]’s high at 1.2350 on Wednesday, January 6, completes the five-wave rally from at least November 4, 2020 (1.1604) and likely from March 23, 2020 (1.0635)…Greater bearish potential exists…

Every student of Elliott knows that when five waves finish, you should anticipate a reversal of equal degree.

Here’s what happened since:

Mmmm, I love a good chart.

And a great tweet. Tip of the hat to Mr_Cuddlez!

So, are you ready to catch the next big euro move?

EWI’s Chief Market Analyst Steven Hochberg guides our Financial Forecast Service subscribers 3X/week through the twist and turns in the euro (and dollar) — plus, U.S. stock indexes, bonds, gold and silver — inside his Short Term Update.

Right now, read our forecasts for all of the markets listed above (and more) inside our Financial Forecast Service Test Drivejust $17 for a full week’s access.

Join the Financial Forecast Service Test Drive now.

Hurry: Your one-time Test Drive opportunity ends Thursday, July 28th.

This article was syndicated by Elliott Wave International and was originally published under the headline Europe On Sale: Get It While U Can. EWI is the world’s largest market forecasting firm. Its staff of full-time analysts led by Chartered Market Technician Robert Prechter provides 24-hour-a-day market analysis to institutional and private investors around the world.

COT Week 29 Charts: Bonds Speculators bets mixed led by Eurodollar, 5-Year & Long Treasury Bond

By InvestMacro | COT | Data Tables | COT Leaders | Downloads | COT Newsletter
Here are the latest charts and statistics for the Commitment of Traders (COT) data published by the Commodities Futures Trading Commission (CFTC).

The latest COT data is updated through Tuesday July 19th and shows a quick view of how large traders (for-profit speculators and commercial entities) were positioned in the futures markets.

Weekly Speculator Changes

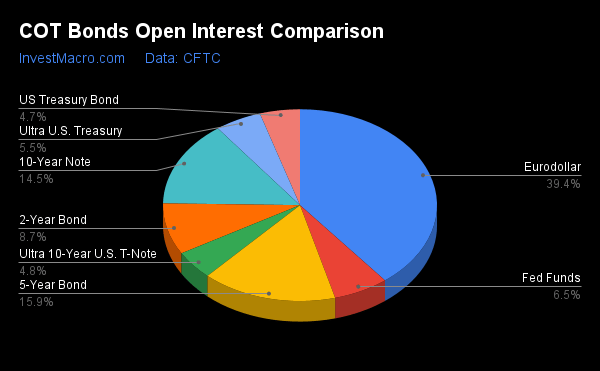
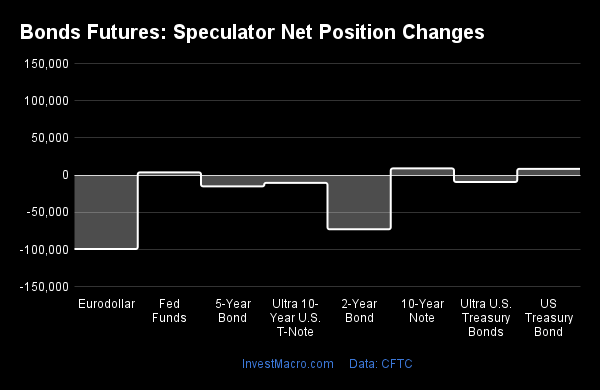
COT bond market speculator bets were mixed evenly this week as four out of the eight bond markets we cover had higher positioning this week while the other four markets had lower speculator contracts.

Leading the weekly gains for the bond markets was the Eurodollar (80,661 contracts) with the 5-Year Bond (33,108 contracts), the Fed Funds Futures (32,523 contracts) and the 2-Year Bond (1,516 contracts) also showing positive changes for the week.

The bond markets leading the declines in speculator bets this week were the Long US Bond (-18,884 contracts) with the Ultra US Bond (-17,487 contracts) coming in a close second while the Ultra 10-Year (-8,368 contracts) and the 10-Year Bond (-333 contracts) also saw lower speculator bets on the week.


Data Snapshot of Bond Market Traders | Columns Legend
Jul-19-2022OIOI-IndexSpec-NetSpec-IndexCom-NetCOM-IndexSmalls-NetSmalls-Index
Eurodollar9,390,82511-2,643,90542,937,91294-294,00740
FedFunds1,769,13959113,57854-105,03247-8,54638
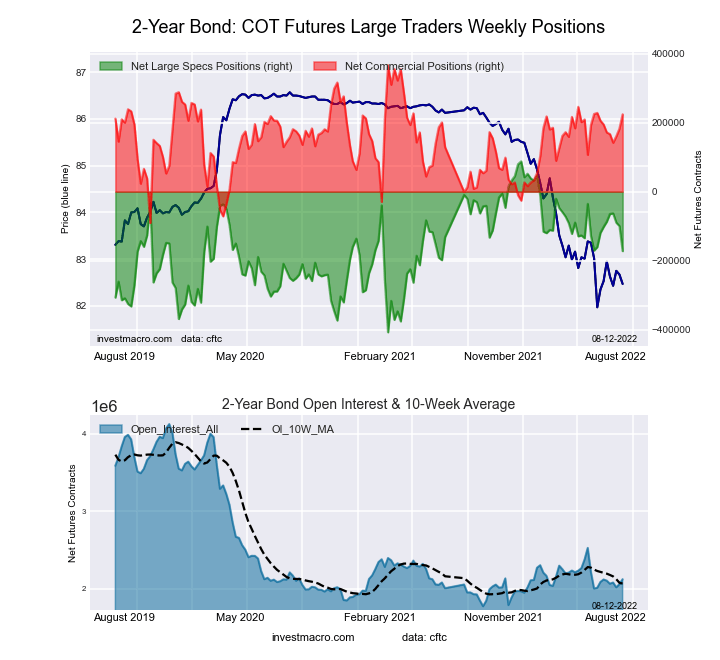
2-Year2,079,26513-63,05370141,84951-78,79616
Long T-Bond1,182,31244-42,1027123,0041919,09868
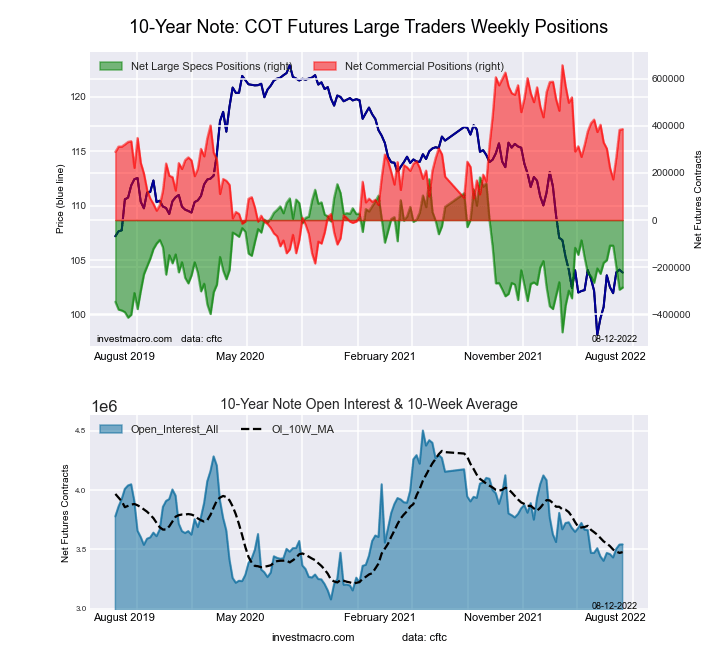
10-Year3,431,24625-108,70456172,61242-63,90864
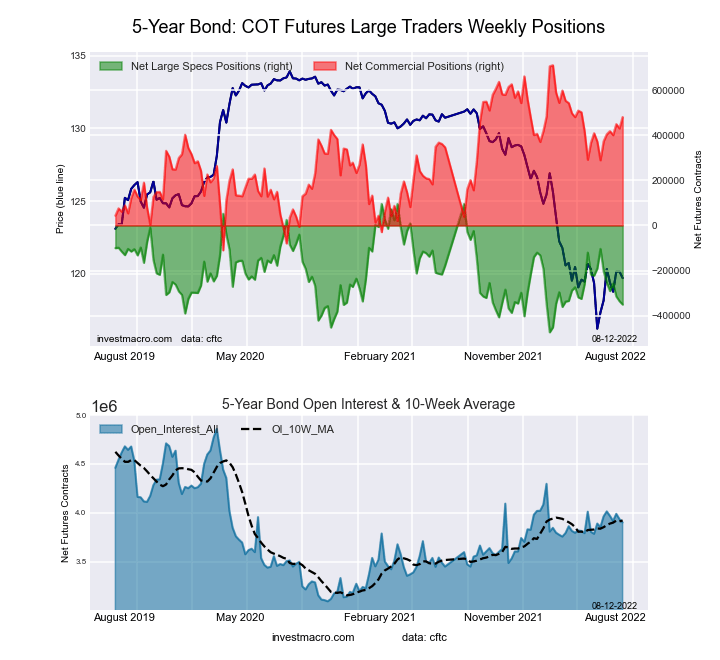
5-Year3,916,09747-258,01538400,93062-142,91542


Strength Scores

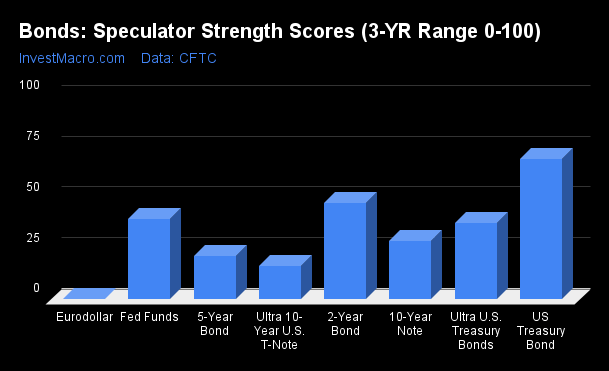
Strength Scores (a normalized measure of Speculator positions over a 3-Year range, from 0 to 100 where above 80 is extreme bullish and below 20 is extreme bearish) show that the US Treasury Bond (70.9 percent) continues to lead the bonds category in sentiment. The 2-Year Bond (69.5 percent) comes in as the next highest bonds market in strength scores followed by the 10-Year Bond (55.9 percent) and the Fed Funds (53.6 percent). On the downside, the Eurodollar (4.3 percent) and the Ultra 10-Year Bond (19.5 percent) come in at the lowest strength levels currently and are both in bearish extreme standings this week (below 20 percent). The next lowest strength scores are seen in the 5-Year Bond (37.9 percent) and the Ultra US Treasury Bond (44.1 percent).

Strength Statistics:
Fed Funds (53.6 percent) vs Fed Funds previous week (49.6 percent)
2-Year Bond (69.5 percent) vs 2-Year Bond previous week (69.2 percent)
5-Year Bond (37.9 percent) vs 5-Year Bond previous week (32.1 percent)
10-Year Bond (55.9 percent) vs 10-Year Bond previous week (56.0 percent)
Ultra 10-Year Bond (19.5 percent) vs Ultra 10-Year Bond previous week (21.7 percent)
US Treasury Bond (70.9 percent) vs US Treasury Bond previous week (77.0 percent)
Ultra US Treasury Bond (44.1 percent) vs Ultra US Treasury Bond previous week (51.3 percent)
Eurodollar (4.3 percent) vs Eurodollar previous week (2.8 percent)

Strength Trends

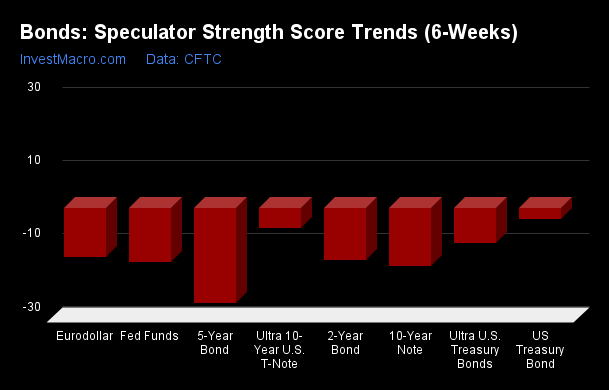
Strength Score Trends (or move index, calculates the 6-week changes in strength scores) show that the 10-Year Bond (23.9 percent) leads the past six weeks trends for bonds currently. The 2-Year Bond (21.7 percent), the Ultra 10-Year Bond (10.4 percent) and the Fed Funds (7.3 percent) fill out the rest of the positive movers in the latest trends data. The US Treasury Bond (-15.3 percent) leads the downside trend scores currently while the next markets with negative trend scores were the Ultra US Treasury Bond (-12.6 percent) and the 5-Year Bond (-6.2 percent).

Strength Trend Statistics:
Fed Funds (7.3 percent) vs Fed Funds previous week (6.9 percent)
2-Year Bond (21.7 percent) vs 2-Year Bond previous week (12.8 percent)
5-Year Bond (-6.2 percent) vs 5-Year Bond previous week (-12.9 percent)
10-Year Bond (23.9 percent) vs 10-Year Bond previous week (19.8 percent)
Ultra 10-Year Bond (10.4 percent) vs Ultra 10-Year Bond previous week (20.3 percent)
US Treasury Bond (-15.3 percent) vs US Treasury Bond previous week (-14.0 percent)
Ultra US Treasury Bond (-12.6 percent) vs Ultra US Treasury Bond previous week (-7.8 percent)
Eurodollar (0.0 percent) vs Eurodollar (2.4 percent)


3-Month Eurodollars Futures:

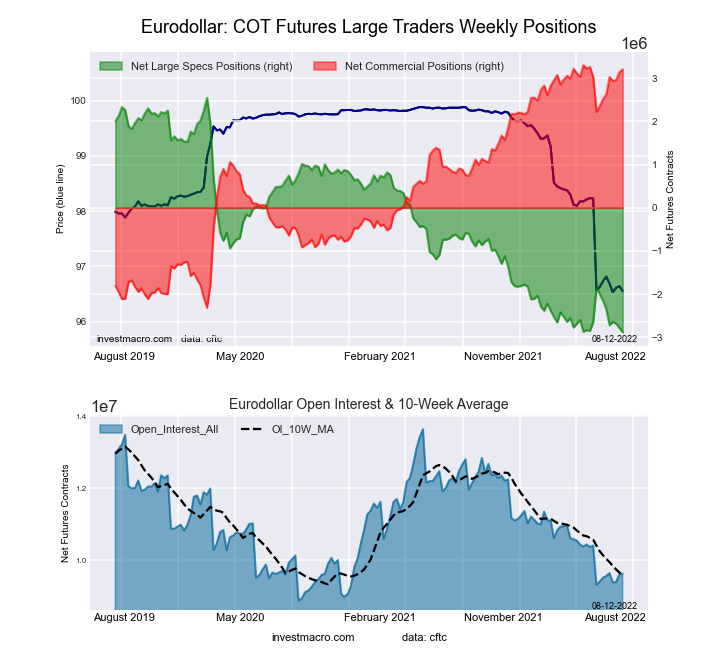
Eurodollar Bonds Futures COT ChartThe 3-Month Eurodollars large speculator standing this week resulted in a net position of -2,643,905 contracts in the data reported through Tuesday. This was a weekly lift of 80,661 contracts from the previous week which had a total of -2,724,566 net contracts.

This week’s current strength score (the trader positioning range over the past three years, measured from 0 to 100) shows the speculators are currently Bearish-Extreme with a score of 4.3 percent. The commercials are Bullish-Extreme with a score of 93.5 percent and the small traders (not shown in chart) are Bearish with a score of 39.7 percent.

3-Month Eurodollars StatisticsSPECULATORSCOMMERCIALSSMALL TRADERS
– Percent of Open Interest Longs:4.971.74.4
– Percent of Open Interest Shorts:33.040.47.5
– Net Position:-2,643,9052,937,912-294,007
– Gross Longs:455,5676,735,605413,100
– Gross Shorts:3,099,4723,797,693707,107
– Long to Short Ratio:0.1 to 11.8 to 10.6 to 1
NET POSITION TREND:
– Strength Index Score (3 Year Range Pct):4.393.539.7
– Strength Index Reading (3 Year Range):Bearish-ExtremeBullish-ExtremeBearish
NET POSITION MOVEMENT INDEX:
– 6-Week Change in Strength Index:0.0-1.518.3


Individual Markets:

30-Day Federal Funds Futures:

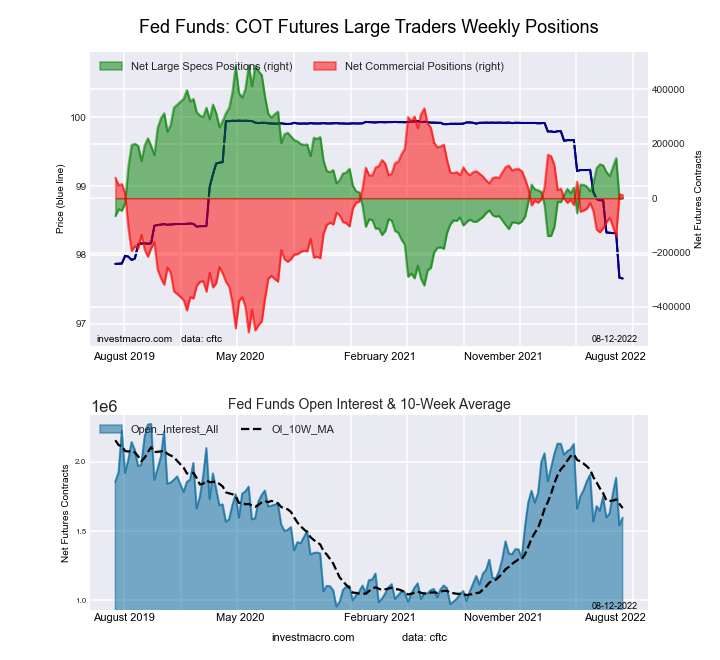
Federal Funds 30-Day Bonds Futures COT ChartThe 30-Day Federal Funds large speculator standing this week resulted in a net position of 113,578 contracts in the data reported through Tuesday. This was a weekly lift of 32,523 contracts from the previous week which had a total of 81,055 net contracts.

This week’s current strength score (the trader positioning range over the past three years, measured from 0 to 100) shows the speculators are currently Bullish with a score of 53.6 percent. The commercials are Bearish with a score of 47.1 percent and the small traders (not shown in chart) are Bearish with a score of 38.0 percent.

30-Day Federal Funds StatisticsSPECULATORSCOMMERCIALSSMALL TRADERS
– Percent of Open Interest Longs:14.072.91.8
– Percent of Open Interest Shorts:7.678.92.3
– Net Position:113,578-105,032-8,546
– Gross Longs:248,0721,290,34431,928
– Gross Shorts:134,4941,395,37640,474
– Long to Short Ratio:1.8 to 10.9 to 10.8 to 1
NET POSITION TREND:
– Strength Index Score (3 Year Range Pct):53.647.138.0
– Strength Index Reading (3 Year Range):BullishBearishBearish
NET POSITION MOVEMENT INDEX:
– 6-Week Change in Strength Index:7.3-6.9-5.7


2-Year Treasury Note Futures:

The 2-Year Treasury Note large speculator standing this week resulted in a net position of -63,053 contracts in the data reported through Tuesday. This was a weekly increase of 1,516 contracts from the previous week which had a total of -64,569 net contracts.

This week’s current strength score (the trader positioning range over the past three years, measured from 0 to 100) shows the speculators are currently Bullish with a score of 69.5 percent. The commercials are Bullish with a score of 50.9 percent and the small traders (not shown in chart) are Bearish-Extreme with a score of 15.7 percent.

2-Year Treasury Note StatisticsSPECULATORSCOMMERCIALSSMALL TRADERS
– Percent of Open Interest Longs:13.478.16.6
– Percent of Open Interest Shorts:16.571.310.4
– Net Position:-63,053141,849-78,796
– Gross Longs:279,4801,623,897137,606
– Gross Shorts:342,5331,482,048216,402
– Long to Short Ratio:0.8 to 11.1 to 10.6 to 1
NET POSITION TREND:
– Strength Index Score (3 Year Range Pct):69.550.915.7
– Strength Index Reading (3 Year Range):BullishBullishBearish-Extreme
NET POSITION MOVEMENT INDEX:
– 6-Week Change in Strength Index:21.7-18.2-10.1


5-Year Treasury Note Futures:

The 5-Year Treasury Note large speculator standing this week resulted in a net position of -258,015 contracts in the data reported through Tuesday. This was a weekly increase of 33,108 contracts from the previous week which had a total of -291,123 net contracts.

This week’s current strength score (the trader positioning range over the past three years, measured from 0 to 100) shows the speculators are currently Bearish with a score of 37.9 percent. The commercials are Bullish with a score of 62.2 percent and the small traders (not shown in chart) are Bearish with a score of 41.7 percent.

5-Year Treasury Note StatisticsSPECULATORSCOMMERCIALSSMALL TRADERS
– Percent of Open Interest Longs:7.384.37.4
– Percent of Open Interest Shorts:13.974.111.0
– Net Position:-258,015400,930-142,915
– Gross Longs:284,4163,302,273289,136
– Gross Shorts:542,4312,901,343432,051
– Long to Short Ratio:0.5 to 11.1 to 10.7 to 1
NET POSITION TREND:
– Strength Index Score (3 Year Range Pct):37.962.241.7
– Strength Index Reading (3 Year Range):BearishBullishBearish
NET POSITION MOVEMENT INDEX:
– 6-Week Change in Strength Index:-6.2-1.012.0


10-Year Treasury Note Futures:

10-Year Treasury Notes Bonds Futures COT ChartThe 10-Year Treasury Note large speculator standing this week resulted in a net position of -108,704 contracts in the data reported through Tuesday. This was a weekly lowering of -333 contracts from the previous week which had a total of -108,371 net contracts.

This week’s current strength score (the trader positioning range over the past three years, measured from 0 to 100) shows the speculators are currently Bullish with a score of 55.9 percent. The commercials are Bearish with a score of 42.4 percent and the small traders (not shown in chart) are Bullish with a score of 64.3 percent.

10-Year Treasury Note StatisticsSPECULATORSCOMMERCIALSSMALL TRADERS
– Percent of Open Interest Longs:10.277.49.8
– Percent of Open Interest Shorts:13.472.411.6
– Net Position:-108,704172,612-63,908
– Gross Longs:351,6792,655,676335,131
– Gross Shorts:460,3832,483,064399,039
– Long to Short Ratio:0.8 to 11.1 to 10.8 to 1
NET POSITION TREND:
– Strength Index Score (3 Year Range Pct):55.942.464.3
– Strength Index Reading (3 Year Range):BullishBearishBullish
NET POSITION MOVEMENT INDEX:
– 6-Week Change in Strength Index:23.9-30.222.6


Ultra 10-Year Notes Futures:

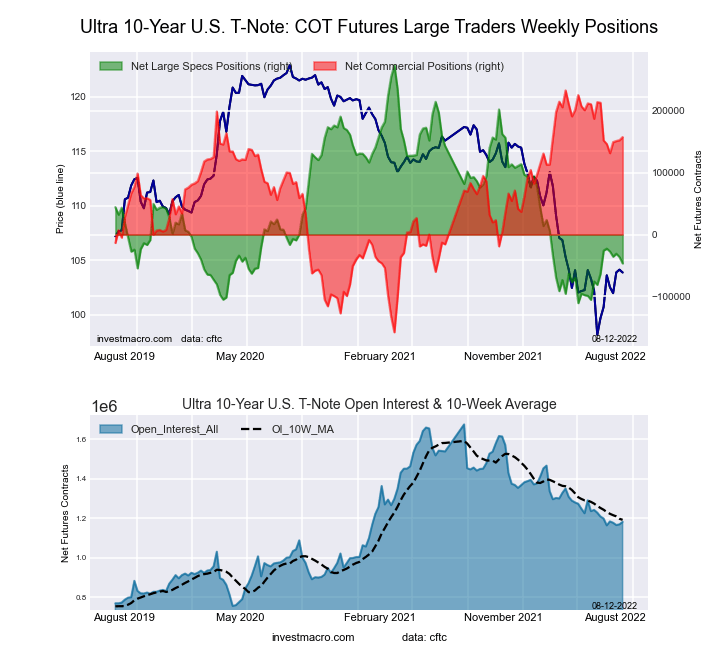
Ultra 10-Year Treasury Notes Bonds Futures COT ChartThe Ultra 10-Year Notes large speculator standing this week resulted in a net position of -35,707 contracts in the data reported through Tuesday. This was a weekly fall of -8,368 contracts from the previous week which had a total of -27,339 net contracts.

This week’s current strength score (the trader positioning range over the past three years, measured from 0 to 100) shows the speculators are currently Bearish-Extreme with a score of 19.5 percent. The commercials are Bullish with a score of 78.6 percent and the small traders (not shown in chart) are Bullish with a score of 51.1 percent.

Ultra 10-Year Notes StatisticsSPECULATORSCOMMERCIALSSMALL TRADERS
– Percent of Open Interest Longs:5.282.811.6
– Percent of Open Interest Shorts:8.270.121.2
– Net Position:-35,707149,258-113,551
– Gross Longs:61,232974,246136,055
– Gross Shorts:96,939824,988249,606
– Long to Short Ratio:0.6 to 11.2 to 10.5 to 1
NET POSITION TREND:
– Strength Index Score (3 Year Range Pct):19.578.651.1
– Strength Index Reading (3 Year Range):Bearish-ExtremeBullishBullish
NET POSITION MOVEMENT INDEX:
– 6-Week Change in Strength Index:10.4-9.7-1.5


US Treasury Bonds Futures:

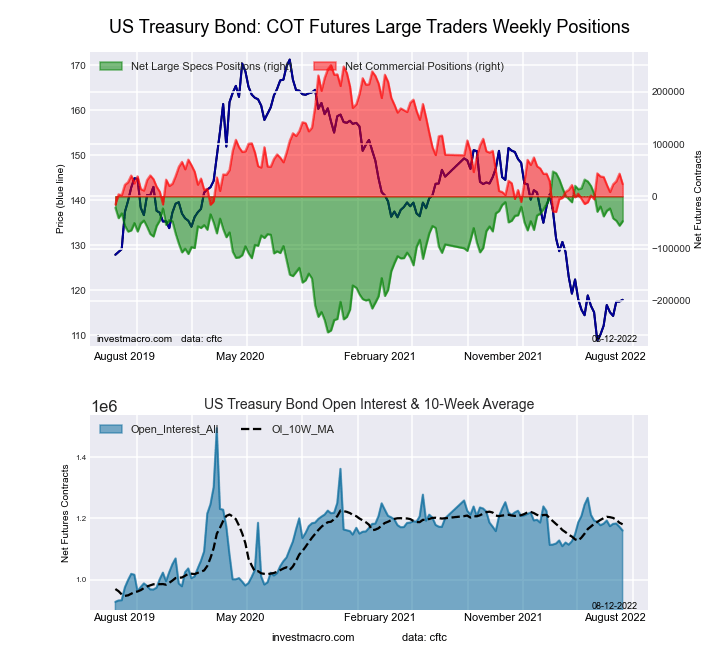
US Year Treasury Notes Long Bonds Futures COT ChartThe US Treasury Bonds large speculator standing this week resulted in a net position of -42,102 contracts in the data reported through Tuesday. This was a weekly decline of -18,884 contracts from the previous week which had a total of -23,218 net contracts.

This week’s current strength score (the trader positioning range over the past three years, measured from 0 to 100) shows the speculators are currently Bullish with a score of 70.9 percent. The commercials are Bearish-Extreme with a score of 18.8 percent and the small traders (not shown in chart) are Bullish with a score of 67.7 percent.

US Treasury Bonds StatisticsSPECULATORSCOMMERCIALSSMALL TRADERS
– Percent of Open Interest Longs:7.677.913.9
– Percent of Open Interest Shorts:11.275.912.3
– Net Position:-42,10223,00419,098
– Gross Longs:90,183920,782164,348
– Gross Shorts:132,285897,778145,250
– Long to Short Ratio:0.7 to 11.0 to 11.1 to 1
NET POSITION TREND:
– Strength Index Score (3 Year Range Pct):70.918.867.7
– Strength Index Reading (3 Year Range):BullishBearish-ExtremeBullish
NET POSITION MOVEMENT INDEX:
– 6-Week Change in Strength Index:-15.310.214.6


Ultra US Treasury Bonds Futures:

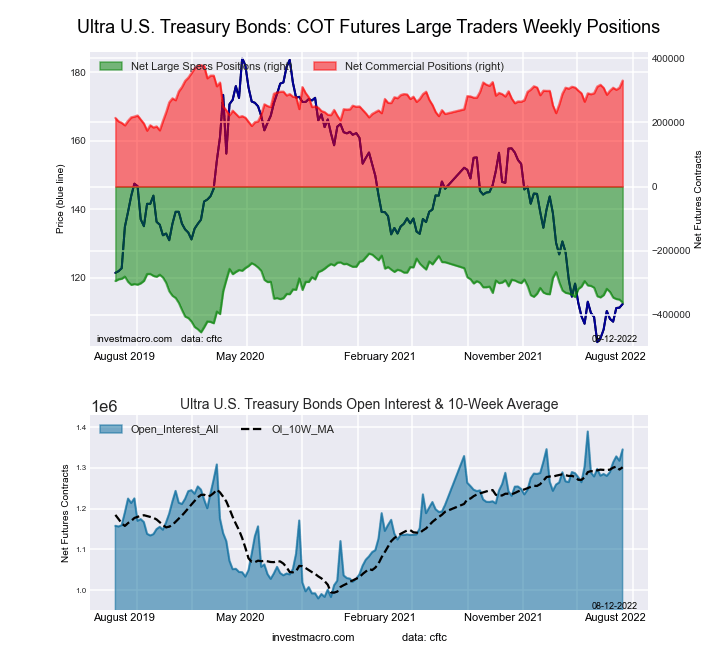
Ultra US Year Treasury Notes Long Bonds Futures COT ChartThe Ultra US Treasury Bonds large speculator standing this week resulted in a net position of -345,782 contracts in the data reported through Tuesday. This was a weekly fall of -17,487 contracts from the previous week which had a total of -328,295 net contracts.

This week’s current strength score (the trader positioning range over the past three years, measured from 0 to 100) shows the speculators are currently Bearish with a score of 44.1 percent. The commercials are Bullish with a score of 65.5 percent and the small traders (not shown in chart) are Bullish with a score of 55.6 percent.

Ultra US Treasury Bonds StatisticsSPECULATORSCOMMERCIALSSMALL TRADERS
– Percent of Open Interest Longs:3.884.811.3
– Percent of Open Interest Shorts:30.161.48.4
– Net Position:-345,782307,67938,103
– Gross Longs:49,3871,113,613147,987
– Gross Shorts:395,169805,934109,884
– Long to Short Ratio:0.1 to 11.4 to 11.3 to 1
NET POSITION TREND:
– Strength Index Score (3 Year Range Pct):44.165.555.6
– Strength Index Reading (3 Year Range):BearishBullishBullish
NET POSITION MOVEMENT INDEX:
– 6-Week Change in Strength Index:-12.68.310.0


Article By InvestMacroReceive our weekly COT Reports by Email

*COT Report: The COT data, released weekly to the public each Friday, is updated through the most recent Tuesday (data is 3 days old) and shows a quick view of how large speculators or non-commercials (for-profit traders) were positioned in the futures markets.

The CFTC categorizes trader positions according to commercial hedgers (traders who use futures contracts for hedging as part of the business), non-commercials (large traders who speculate to realize trading profits) and nonreportable traders (usually small traders/speculators) as well as their open interest (contracts open in the market at time of reporting).See CFTC criteria here.

COT Week 29 Charts: Soft Commodities Speculator bets slightly higher led by Sugar & Lean Hogs

By InvestMacro | COT | Data Tables | COT Leaders | Downloads | COT Newsletter

Here are the latest charts and statistics for the Commitment of Traders (COT) data published by the Commodities Futures Trading Commission (CFTC).

The latest COT data is updated through Tuesday July 19th and shows a quick view of how large traders (for-profit speculators and commercial entities) were positioned in the futures markets.

Weekly Speculator Changes

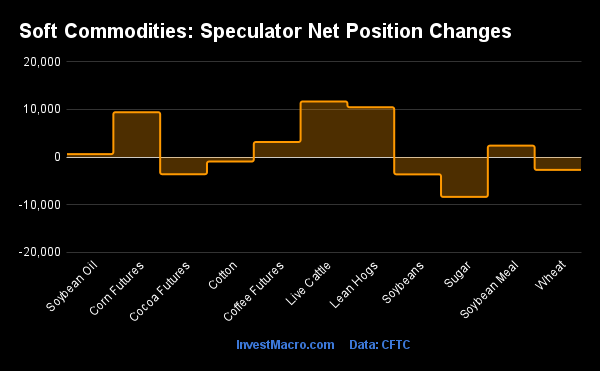
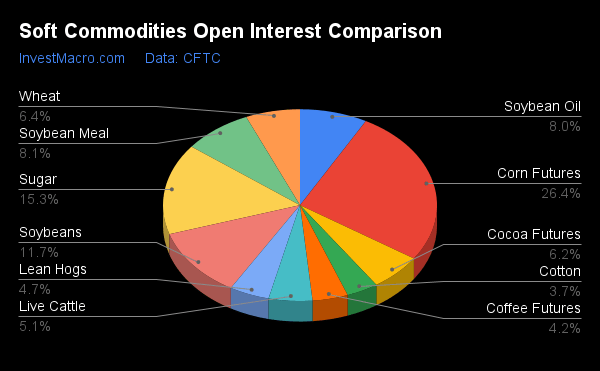
COT soft commodities speculator bets were mostly higher this week as six out of the eleven soft commodities markets we cover had higher positioning this week while the other five markets had lower contracts.

Leading the weekly gains for soft commodities markets was Sugar (21,293 contracts) with Lean Hogs (4,560 contracts), Cocoa (3,578 contracts), Wheat (1,883 contracts), Soybean Meal (277 contracts) and Live Cattle (57 contracts) also showing higher speculator bets on the week.

The softs markets leading the declines in speculator bets this week were Corn (-37,216 contracts) and Soybeans (-12,526 contracts) with Coffee (-6,329 contracts), Cotton (-4,934 contracts) and Soybean Oil (-2,463 contracts) also registering lower bets on the week.


Data Snapshot of Commodity Market Traders | Columns Legend
Jul-19-2022OIOI-IndexSpec-NetSpec-IndexCom-NetCOM-IndexSmalls-NetSmalls-Index
WTI Crude1,577,6160271,0911-293,68910022,59847
Gold524,7862194,9550-112,26210017,3070
Silver145,247121,3600-8,2131006,8532
Copper174,5928-23,8362523,745769126
Palladium6,9153-3,75124,30299-55112
Platinum75,06947-4,2822-273984,55526
Natural Gas953,3250-120,3234286,6995833,62460
Brent177,88922-41,3024240,8436145915
Heating Oil267,576229,24356-23,8004614,55749
Soybeans602,9870102,59345-74,42761-28,16623
Corn1,308,4580209,94057-165,61148-44,32918
Coffee196,041327,97963-28,02644470
Sugar703,6140127,16263-141,8424114,68026
Wheat292,70026,522283,17364-9,69560


Strength Scores

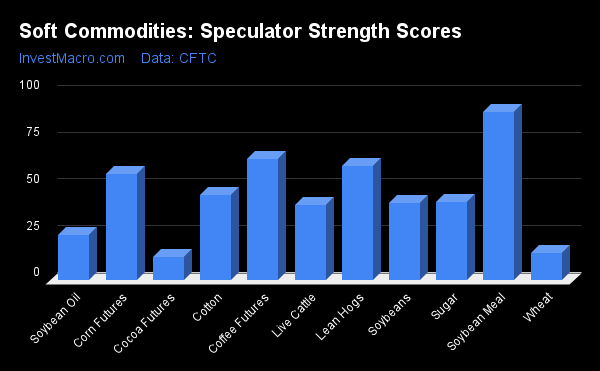
Strength Scores (a normalized measure of Speculator positions over a 3-Year range, from 0 to 100 where above 80 is extreme bullish and below 20 is extreme bearish) show that Soybean Meal (83.5 percent) leads the softs in scores and is currently in a bullish extreme state (above 80 percent). Coffee (63.0 percent) and Sugar (62.8 percent) round out the other soft commodity markets at the top of the strength list while Corn (56.8 percent) comes in next but has been falling steadily in the speculator sentiment for several weeks. On the downside, Live Cattle (6.9 percent) is the weakest in strength scores followed by Cocoa (17.0 percent) and both of these markets are in a bearish extreme level (below 20 percent). Soybean Oil (24.1 percent) and Wheat (27.5 percent) are the next two lowest in scoring.


Strength Statistics:
Corn (56.8 percent) vs Corn previous week (61.6 percent)
Sugar (62.8 percent) vs Sugar previous week (58.4 percent)
Coffee (63.0 percent) vs Coffee previous week (68.5 percent)
Soybeans (45.4 percent) vs Soybeans previous week (49.2 percent)
Soybean Oil (24.1 percent) vs Soybean Oil previous week (25.7 percent)
Soybean Meal (83.5 percent) vs Soybean Meal previous week (83.4 percent)
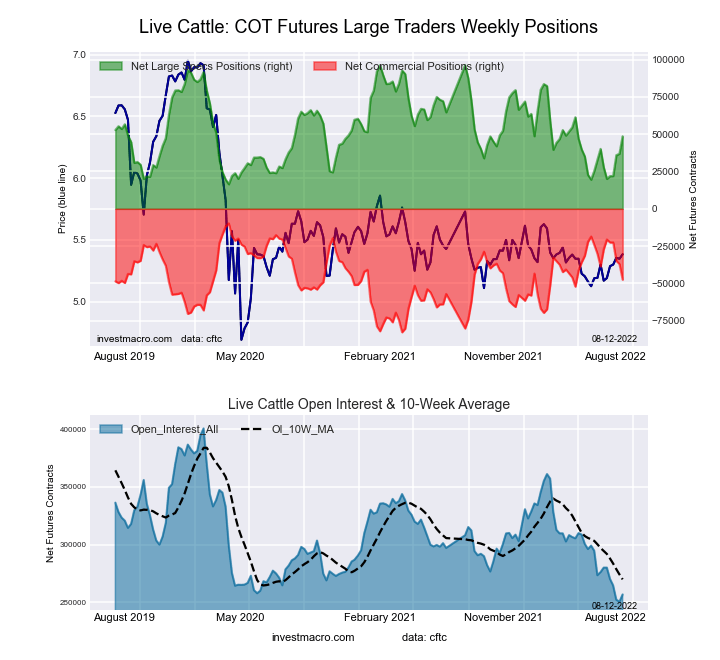
Live Cattle (6.9 percent) vs Live Cattle previous week (6.8 percent)
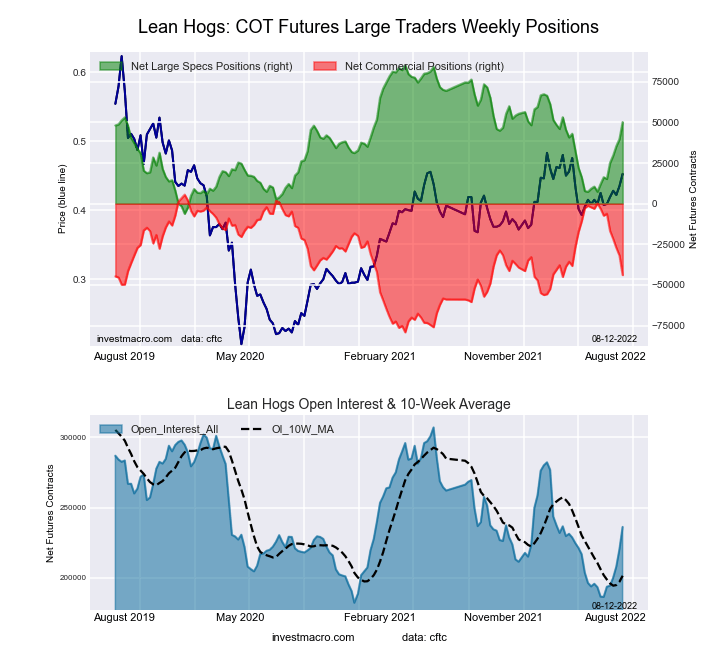
Lean Hogs (39.0 percent) vs Lean Hogs previous week (34.0 percent)
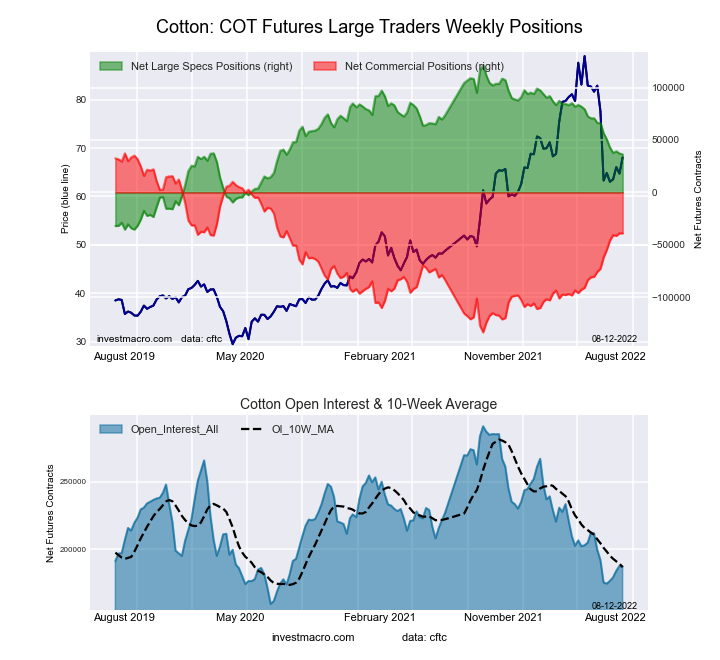
Cotton (46.7 percent) vs Cotton previous week (49.8 percent)
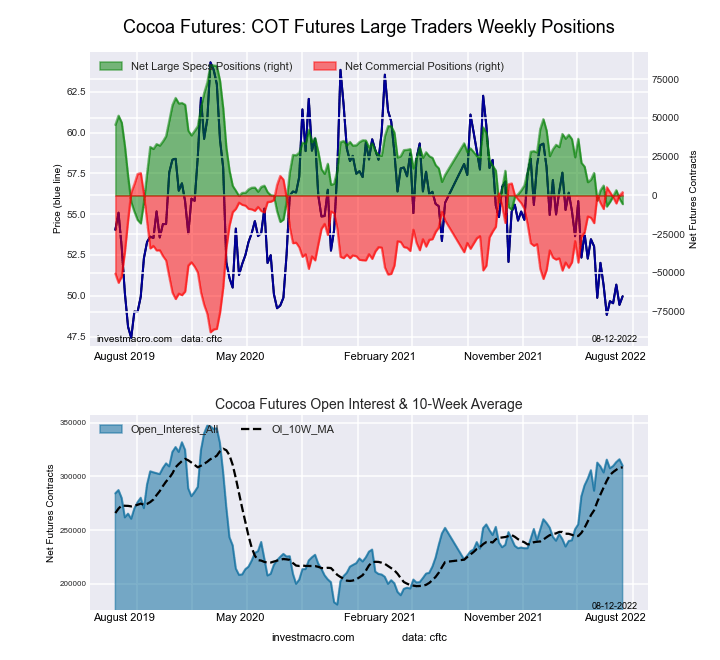
Cocoa (17.0 percent) vs Cocoa previous week (13.5 percent)
Wheat (27.5 percent) vs Wheat previous week (25.1 percent)

Strength Trends

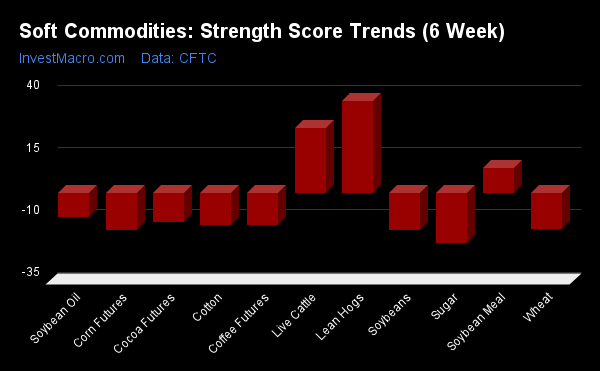
Strength Score Trends (or move index, calculates the 6-week changes in strength scores) show that Lean Hogs (20.8 percent) is the far and away leader in the past six weeks trends for soft commodity markets. Soybean Meal (6.1 percent) is the only other positive mover in the latest trends data and reiterates the weakness of the overall softs markets currently. On the downside, Soybean Oil (-34.2 percent) leads the negative trend scores while the next markets with lower trend scores were Corn (-23.2 percent), Soybeans (-22.5 percent), Wheat (-22.6 percent) and Cotton (-21.0 percent).


Strength Trend Statistics:
Corn (-23.2 percent) vs Corn previous week (-20.1 percent)
Sugar (-14.0 percent) vs Sugar previous week (-19.7 percent)
Coffee (-18.0 percent) vs Coffee previous week (-7.5 percent)
Soybeans (-22.5 percent) vs Soybeans previous week (-21.6 percent)
Soybean Oil (-34.2 percent) vs Soybean Oil previous week (-30.2 percent)
Soybean Meal (6.1 percent) vs Soybean Meal previous week (10.9 percent)
Live Cattle (-4.4 percent) vs Live Cattle previous week (3.0 percent)
Lean Hogs (20.8 percent) vs Lean Hogs previous week (17.3 percent)
Cotton (-21.0 percent) vs Cotton previous week (-17.9 percent)
Cocoa (-14.8 percent) vs Cocoa previous week (-14.0 percent)
Wheat (-22.6 percent) vs Wheat previous week (-23.0 percent)


Individual Markets:

CORN Futures:

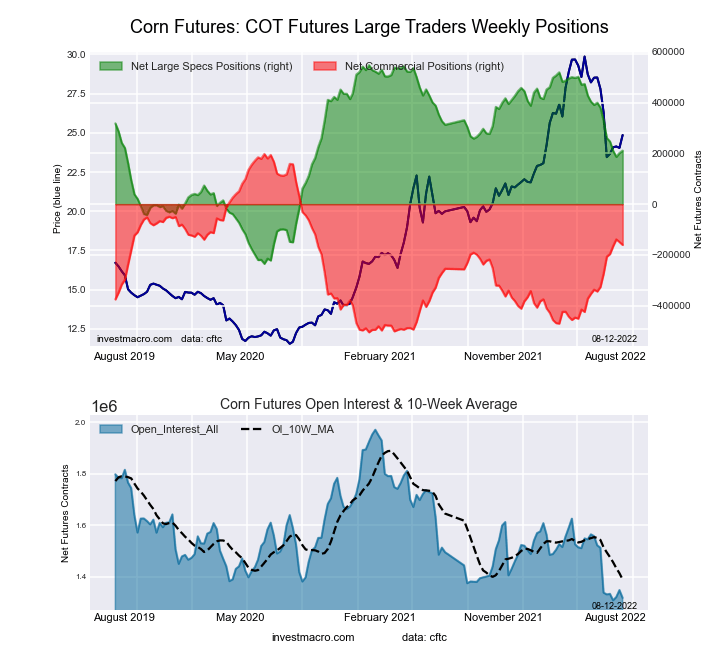
CORN Futures COT ChartThe CORN large speculator standing this week recorded a net position of 209,940 contracts in the data reported through Tuesday. This was a weekly decrease of -37,216 contracts from the previous week which had a total of 247,156 net contracts.

This week’s current strength score (the trader positioning range over the past three years, measured from 0 to 100) shows the speculators are currently Bullish with a score of 56.8 percent. The commercials are Bearish with a score of 48.3 percent and the small traders (not shown in chart) are Bearish-Extreme with a score of 17.5 percent.

CORN Futures StatisticsSPECULATORSCOMMERCIALSSMALL TRADERS
– Percent of Open Interest Longs:27.448.29.8
– Percent of Open Interest Shorts:11.460.913.2
– Net Position:209,940-165,611-44,329
– Gross Longs:358,478631,146127,850
– Gross Shorts:148,538796,757172,179
– Long to Short Ratio:2.4 to 10.8 to 10.7 to 1
NET POSITION TREND:
– Strength Index Score (3 Year Range Pct):56.848.317.5
– Strength Index Reading (3 Year Range):BullishBearishBearish-Extreme
NET POSITION MOVEMENT INDEX:
– 6-Week Change in Strength Index:-23.224.45.6


SUGAR Futures:

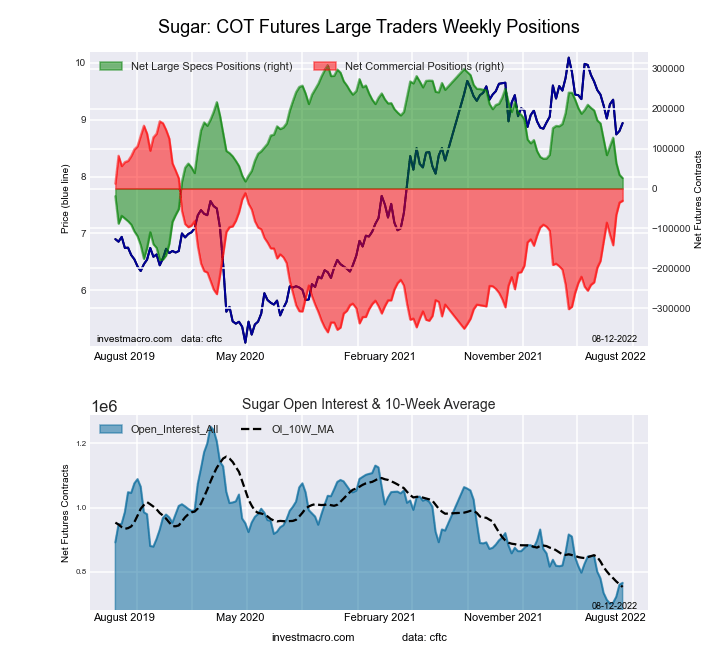
SUGAR Futures COT ChartThe SUGAR large speculator standing this week recorded a net position of 127,162 contracts in the data reported through Tuesday. This was a weekly gain of 21,293 contracts from the previous week which had a total of 105,869 net contracts.

This week’s current strength score (the trader positioning range over the past three years, measured from 0 to 100) shows the speculators are currently Bullish with a score of 62.8 percent. The commercials are Bearish with a score of 41.3 percent and the small traders (not shown in chart) are Bearish with a score of 26.0 percent.

SUGAR Futures StatisticsSPECULATORSCOMMERCIALSSMALL TRADERS
– Percent of Open Interest Longs:27.350.29.5
– Percent of Open Interest Shorts:9.270.47.4
– Net Position:127,162-141,84214,680
– Gross Longs:192,030353,38566,497
– Gross Shorts:64,868495,22751,817
– Long to Short Ratio:3.0 to 10.7 to 11.3 to 1
NET POSITION TREND:
– Strength Index Score (3 Year Range Pct):62.841.326.0
– Strength Index Reading (3 Year Range):BullishBearishBearish
NET POSITION MOVEMENT INDEX:
– 6-Week Change in Strength Index:-14.017.6-30.2


COFFEE Futures:

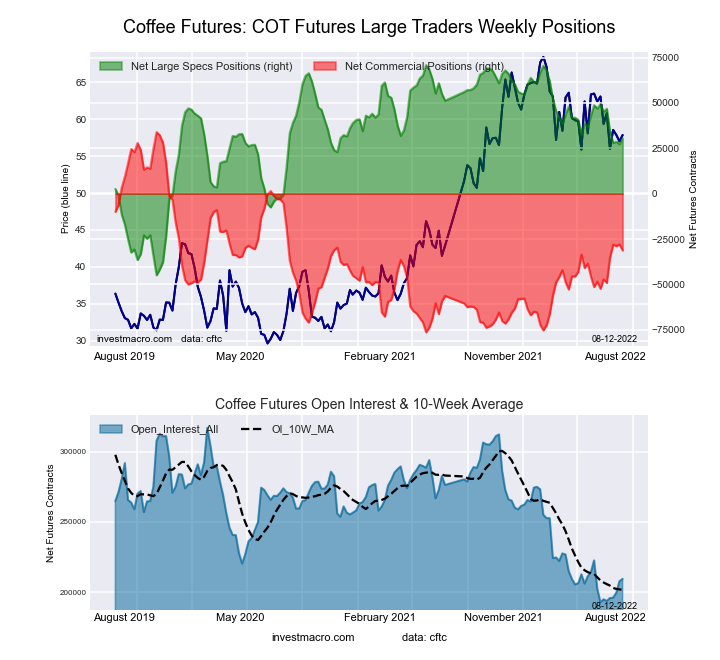
COFFEE Futures COT ChartThe COFFEE large speculator standing this week recorded a net position of 27,979 contracts in the data reported through Tuesday. This was a weekly decrease of -6,329 contracts from the previous week which had a total of 34,308 net contracts.

This week’s current strength score (the trader positioning range over the past three years, measured from 0 to 100) shows the speculators are currently Bullish with a score of 63.0 percent. The commercials are Bearish with a score of 43.8 percent and the small traders (not shown in chart) are Bearish-Extreme with a score of 0.0 percent.

COFFEE Futures StatisticsSPECULATORSCOMMERCIALSSMALL TRADERS
– Percent of Open Interest Longs:24.053.43.9
– Percent of Open Interest Shorts:9.767.73.8
– Net Position:27,979-28,02647
– Gross Longs:47,036104,6647,570
– Gross Shorts:19,057132,6907,523
– Long to Short Ratio:2.5 to 10.8 to 11.0 to 1
NET POSITION TREND:
– Strength Index Score (3 Year Range Pct):63.043.80.0
– Strength Index Reading (3 Year Range):BullishBearishBearish-Extreme
NET POSITION MOVEMENT INDEX:
– 6-Week Change in Strength Index:-18.021.2-23.3


SOYBEANS Futures:

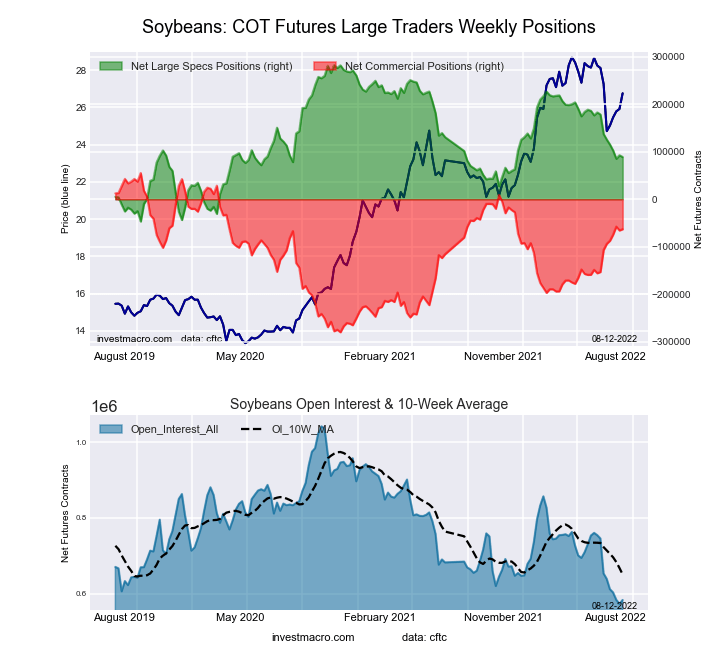
The SOYBEANS large speculator standing this week recorded a net position of 102,593 contracts in the data reported through Tuesday. This was a weekly decline of -12,526 contracts from the previous week which had a total of 115,119 net contracts.

This week’s current strength score (the trader positioning range over the past three years, measured from 0 to 100) shows the speculators are currently Bearish with a score of 45.4 percent. The commercials are Bullish with a score of 61.3 percent and the small traders (not shown in chart) are Bearish with a score of 23.4 percent.

SOYBEANS Futures StatisticsSPECULATORSCOMMERCIALSSMALL TRADERS
– Percent of Open Interest Longs:26.452.76.6
– Percent of Open Interest Shorts:9.465.011.2
– Net Position:102,593-74,427-28,166
– Gross Longs:159,262317,59739,543
– Gross Shorts:56,669392,02467,709
– Long to Short Ratio:2.8 to 10.8 to 10.6 to 1
NET POSITION TREND:
– Strength Index Score (3 Year Range Pct):45.461.323.4
– Strength Index Reading (3 Year Range):BearishBullishBearish
NET POSITION MOVEMENT INDEX:
– 6-Week Change in Strength Index:-22.522.10.1


SOYBEAN OIL Futures:

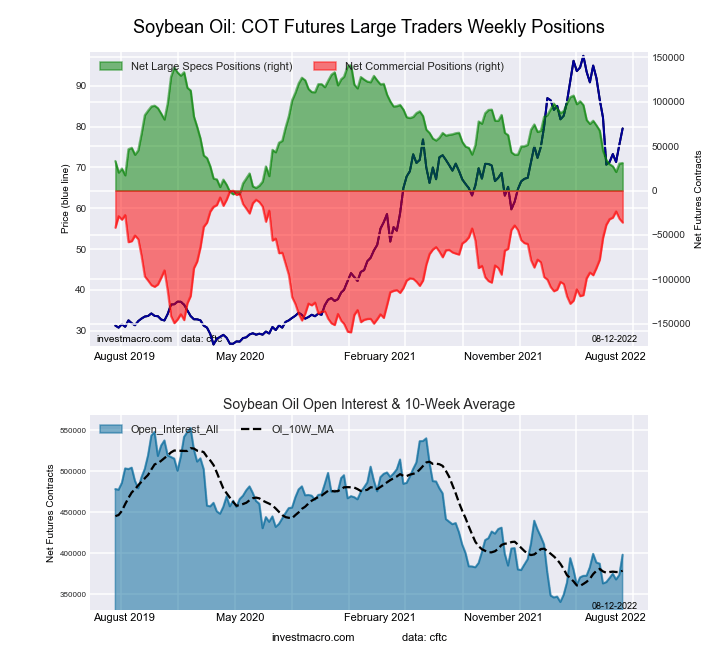
SOYBEAN OIL Futures COT ChartThe SOYBEAN OIL large speculator standing this week recorded a net position of 27,325 contracts in the data reported through Tuesday. This was a weekly fall of -2,463 contracts from the previous week which had a total of 29,788 net contracts.

This week’s current strength score (the trader positioning range over the past three years, measured from 0 to 100) shows the speculators are currently Bearish with a score of 24.1 percent. The commercials are Bullish with a score of 78.2 percent and the small traders (not shown in chart) are Bearish with a score of 25.1 percent.

SOYBEAN OIL Futures StatisticsSPECULATORSCOMMERCIALSSMALL TRADERS
– Percent of Open Interest Longs:17.760.17.1
– Percent of Open Interest Shorts:10.468.26.3
– Net Position:27,325-30,4493,124
– Gross Longs:66,220225,28326,605
– Gross Shorts:38,895255,73223,481
– Long to Short Ratio:1.7 to 10.9 to 11.1 to 1
NET POSITION TREND:
– Strength Index Score (3 Year Range Pct):24.178.225.1
– Strength Index Reading (3 Year Range):BearishBullishBearish
NET POSITION MOVEMENT INDEX:
– 6-Week Change in Strength Index:-34.239.3-50.3


SOYBEAN MEAL Futures:

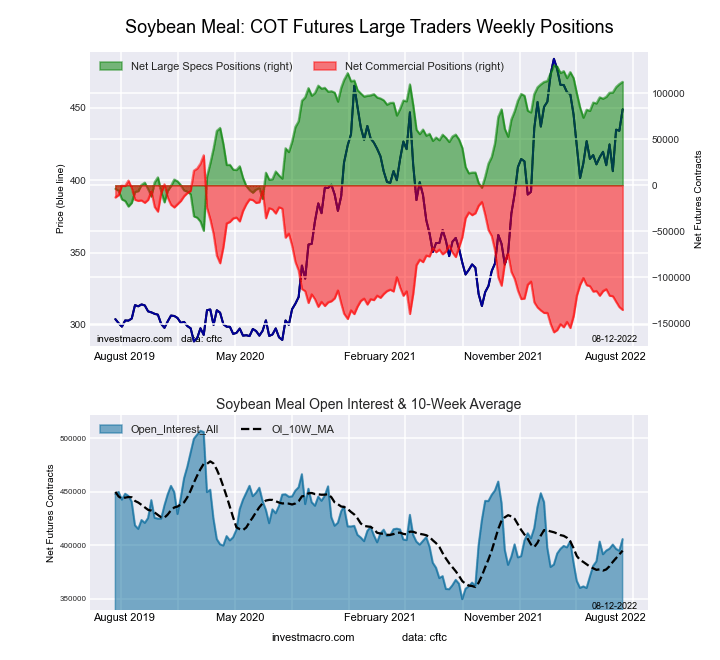
SOYBEAN MEAL Futures COT ChartThe SOYBEAN MEAL large speculator standing this week recorded a net position of 100,674 contracts in the data reported through Tuesday. This was a weekly rise of 277 contracts from the previous week which had a total of 100,397 net contracts.

This week’s current strength score (the trader positioning range over the past three years, measured from 0 to 100) shows the speculators are currently Bullish-Extreme with a score of 83.5 percent. The commercials are Bearish with a score of 20.4 percent and the small traders (not shown in chart) are Bearish with a score of 34.7 percent.

SOYBEAN MEAL Futures StatisticsSPECULATORSCOMMERCIALSSMALL TRADERS
– Percent of Open Interest Longs:28.342.110.9
– Percent of Open Interest Shorts:3.172.16.0
– Net Position:100,674-120,30419,630
– Gross Longs:113,190168,51243,743
– Gross Shorts:12,516288,81624,113
– Long to Short Ratio:9.0 to 10.6 to 11.8 to 1
NET POSITION TREND:
– Strength Index Score (3 Year Range Pct):83.520.434.7
– Strength Index Reading (3 Year Range):Bullish-ExtremeBearishBearish
NET POSITION MOVEMENT INDEX:
– 6-Week Change in Strength Index:6.1-2.6-30.7


LIVE CATTLE Futures:

The LIVE CATTLE large speculator standing this week recorded a net position of 21,956 contracts in the data reported through Tuesday. This was a weekly lift of 57 contracts from the previous week which had a total of 21,899 net contracts.

This week’s current strength score (the trader positioning range over the past three years, measured from 0 to 100) shows the speculators are currently Bearish-Extreme with a score of 6.9 percent. The commercials are Bullish-Extreme with a score of 82.5 percent and the small traders (not shown in chart) are Bullish-Extreme with a score of 83.8 percent.

LIVE CATTLE Futures StatisticsSPECULATORSCOMMERCIALSSMALL TRADERS
– Percent of Open Interest Longs:33.141.812.0
– Percent of Open Interest Shorts:24.850.411.8
– Net Position:21,956-22,536580
– Gross Longs:87,558110,73831,759
– Gross Shorts:65,602133,27431,179
– Long to Short Ratio:1.3 to 10.8 to 11.0 to 1
NET POSITION TREND:
– Strength Index Score (3 Year Range Pct):6.982.583.8
– Strength Index Reading (3 Year Range):Bearish-ExtremeBullish-ExtremeBullish-Extreme
NET POSITION MOVEMENT INDEX:
– 6-Week Change in Strength Index:-4.42.36.2


LEAN HOGS Futures:

The LEAN HOGS large speculator standing this week recorded a net position of 29,619 contracts in the data reported through Tuesday. This was a weekly advance of 4,560 contracts from the previous week which had a total of 25,059 net contracts.

This week’s current strength score (the trader positioning range over the past three years, measured from 0 to 100) shows the speculators are currently Bearish with a score of 39.0 percent. The commercials are Bullish with a score of 67.8 percent and the small traders (not shown in chart) are Bullish with a score of 55.3 percent.

LEAN HOGS Futures StatisticsSPECULATORSCOMMERCIALSSMALL TRADERS
– Percent of Open Interest Longs:35.737.710.6
– Percent of Open Interest Shorts:20.948.514.5
– Net Position:29,619-21,680-7,939
– Gross Longs:71,39575,38621,122
– Gross Shorts:41,77697,06629,061
– Long to Short Ratio:1.7 to 10.8 to 10.7 to 1
NET POSITION TREND:
– Strength Index Score (3 Year Range Pct):39.067.855.3
– Strength Index Reading (3 Year Range):BearishBullishBullish
NET POSITION MOVEMENT INDEX:
– 6-Week Change in Strength Index:20.8-22.0-2.8


COTTON Futures:

COTTON Futures COT ChartThe COTTON large speculator standing this week recorded a net position of 37,751 contracts in the data reported through Tuesday. This was a weekly decline of -4,934 contracts from the previous week which had a total of 42,685 net contracts.

This week’s current strength score (the trader positioning range over the past three years, measured from 0 to 100) shows the speculators are currently Bearish with a score of 46.7 percent. The commercials are Bullish with a score of 54.3 percent and the small traders (not shown in chart) are Bearish with a score of 30.3 percent.

COTTON Futures StatisticsSPECULATORSCOMMERCIALSSMALL TRADERS
– Percent of Open Interest Longs:37.244.96.3
– Percent of Open Interest Shorts:16.167.64.7
– Net Position:37,751-40,6312,880
– Gross Longs:66,52080,42911,313
– Gross Shorts:28,769121,0608,433
– Long to Short Ratio:2.3 to 10.7 to 11.3 to 1
NET POSITION TREND:
– Strength Index Score (3 Year Range Pct):46.754.330.3
– Strength Index Reading (3 Year Range):BearishBullishBearish
NET POSITION MOVEMENT INDEX:
– 6-Week Change in Strength Index:-21.023.3-43.1


COCOA Futures:

The COCOA large speculator standing this week recorded a net position of -602 contracts in the data reported through Tuesday. This was a weekly increase of 3,578 contracts from the previous week which had a total of -4,180 net contracts.

This week’s current strength score (the trader positioning range over the past three years, measured from 0 to 100) shows the speculators are currently Bearish-Extreme with a score of 17.0 percent. The commercials are Bullish-Extreme with a score of 84.9 percent and the small traders (not shown in chart) are Bearish-Extreme with a score of 12.8 percent.

COCOA Futures StatisticsSPECULATORSCOMMERCIALSSMALL TRADERS
– Percent of Open Interest Longs:30.445.44.2
– Percent of Open Interest Shorts:30.645.73.7
– Net Position:-602-1,0281,630
– Gross Longs:94,072140,64913,132
– Gross Shorts:94,674141,67711,502
– Long to Short Ratio:1.0 to 11.0 to 11.1 to 1
NET POSITION TREND:
– Strength Index Score (3 Year Range Pct):17.084.912.8
– Strength Index Reading (3 Year Range):Bearish-ExtremeBullish-ExtremeBearish-Extreme
NET POSITION MOVEMENT INDEX:
– 6-Week Change in Strength Index:-14.816.3-17.0


WHEAT Futures:

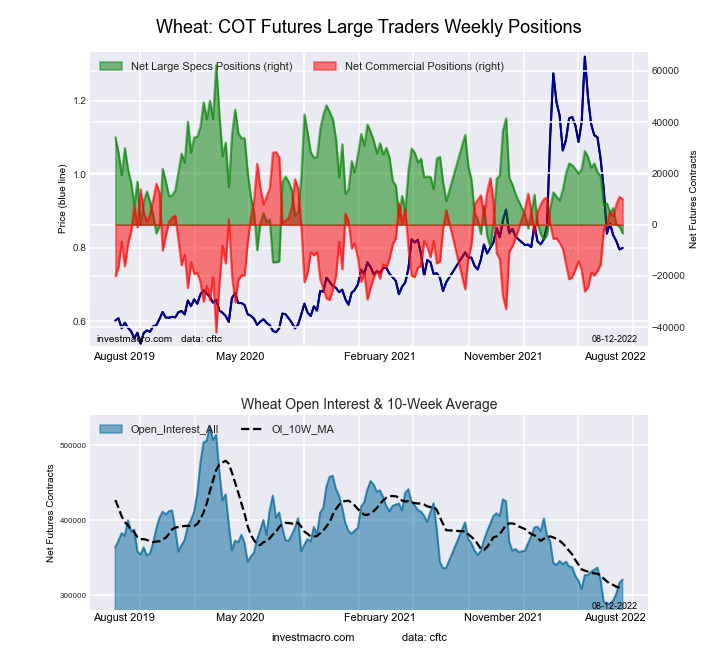
WHEAT Futures COT ChartThe WHEAT large speculator standing this week recorded a net position of 6,522 contracts in the data reported through Tuesday. This was a weekly advance of 1,883 contracts from the previous week which had a total of 4,639 net contracts.

This week’s current strength score (the trader positioning range over the past three years, measured from 0 to 100) shows the speculators are currently Bearish with a score of 27.5 percent. The commercials are Bullish with a score of 64.2 percent and the small traders (not shown in chart) are Bullish with a score of 60.1 percent.

WHEAT Futures StatisticsSPECULATORSCOMMERCIALSSMALL TRADERS
– Percent of Open Interest Longs:31.340.59.4
– Percent of Open Interest Shorts:29.139.412.7
– Net Position:6,5223,173-9,695
– Gross Longs:91,557118,63427,569
– Gross Shorts:85,035115,46137,264
– Long to Short Ratio:1.1 to 11.0 to 10.7 to 1
NET POSITION TREND:
– Strength Index Score (3 Year Range Pct):27.564.260.1
– Strength Index Reading (3 Year Range):BearishBullishBullish
NET POSITION MOVEMENT INDEX:
– 6-Week Change in Strength Index:-22.632.8-29.5


Article By InvestMacroReceive our weekly COT Reports by Email

*COT Report: The COT data, released weekly to the public each Friday, is updated through the most recent Tuesday (data is 3 days old) and shows a quick view of how large speculators or non-commercials (for-profit traders) were positioned in the futures markets.

The CFTC categorizes trader positions according to commercial hedgers (traders who use futures contracts for hedging as part of the business), non-commercials (large traders who speculate to realize trading profits) and nonreportable traders (usually small traders/speculators) as well as their open interest (contracts open in the market at time of reporting).See CFTC criteria here.

COT Week 29 Charts: Stock Market Speculator bets mostly higher led by Russell 2000 & Nasdaq

By InvestMacro | COT | Data Tables | COT Leaders | Downloads | COT Newsletter

Here are the latest charts and statistics for the Commitment of Traders (COT) data published by the Commodities Futures Trading Commission (CFTC).

The latest COT data is updated through Tuesday July 19th and shows a quick view of how large traders (for-profit speculators and commercial entities) were positioned in the futures markets.

Weekly Speculator Changes

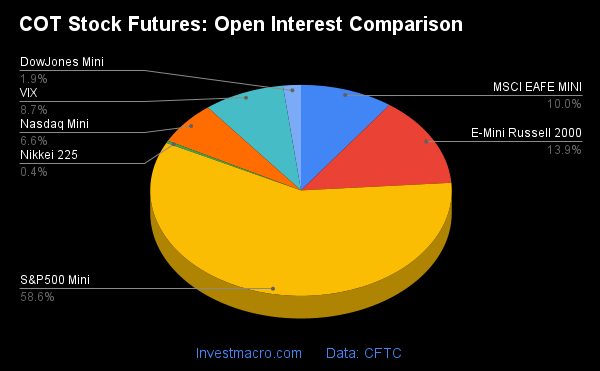
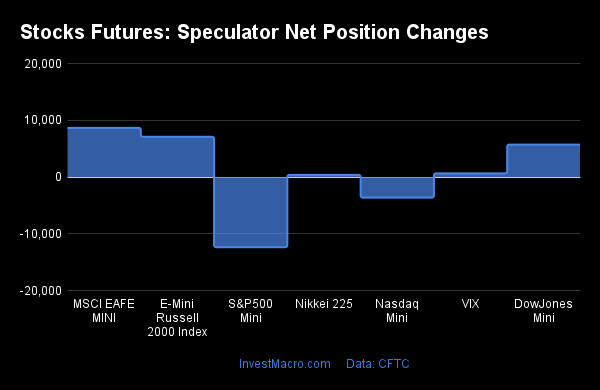
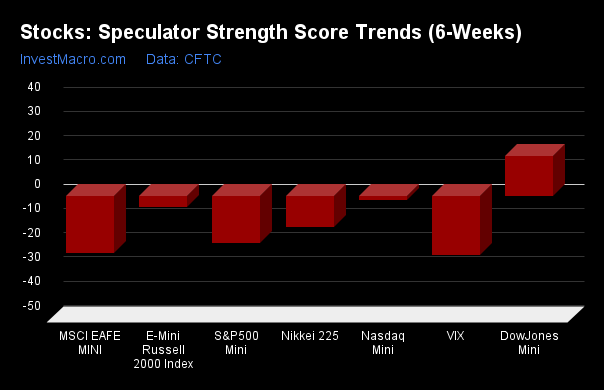
COT stock market speculator bets were mostly higher this week as five out of the seven stock markets we cover had higher positioning this week while the other three markets had lower contracts.

Leading the weekly gains for stock markets was Russell 2000 Mini (17,089 contracts) with the Nasdaq Mini (8,701 contracts), S&P500 Mini (7,380 contracts) and the Dow Jones Industrial Average Mini (4,006 contracts) also showing positive weeks.

The stock markets leading the declines in speculator bets this week were MSCI EAFE Mini (-3,637 contracts) with VIX (-3,533 contracts) and Nikkei 225 USD (-1,176 contracts) also registering lower bets on the week.


Data Snapshot of Stock Market Traders | Columns Legend
Jul-19-2022OIOI-IndexSpec-NetSpec-IndexCom-NetCOM-IndexSmalls-NetSmalls-Index
S&P500-Mini2,335,3199-208,14818266,346100-58,19814
Nikkei 22513,3247-3,127633,34146-21426
Nasdaq-Mini256,3884628,11791-19,55514-8,56231
DowJones-Mini71,27730-15,8371620,98488-5,14711
VIX308,12429-69,9007476,07726-6,17761
Nikkei 225 Yen64,010495,1775025,66889-30,84511


Strength Scores

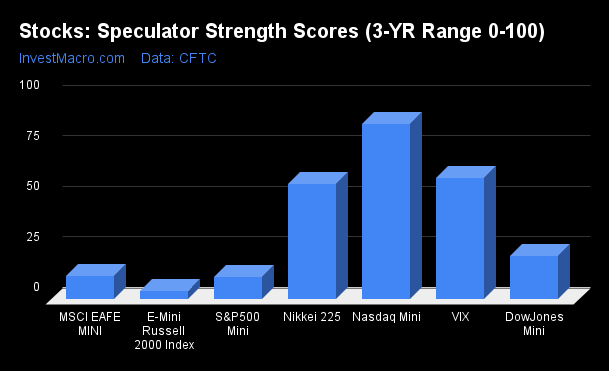
Strength Scores (a normalized measure of Speculator positions over a 3-Year range, from 0 to 100 where above 80 is extreme bullish and below 20 is extreme bearish) show that the Nasdaq-Mini (90.7 percent) lead the stocks is currently in a bullish extreme level. The VIX (74.2 percent) and the Nikkei USD (62.6 percent) comes in as the next highest stock markets in strength scores. On the downside, the EAFE-Mini (8.5 percent) comes in at the lowest strength level currently and is followed by the Russell 2000-Mini (10.1 percent), the DowJones-Mini (16.1 percent) and the S&P500-Mini (17.6 percent). All four of those markets are in bearish extreme levels at the moment (below 20 percent).

Strength Statistics:
VIX (74.2 percent) vs VIX previous week (76.0 percent)
S&P500-Mini (17.6 percent) vs S&P500-Mini previous week (16.3 percent)
DowJones-Mini (16.1 percent) vs DowJones-Mini previous week (11.1 percent)
Nasdaq-Mini (90.7 percent) vs Nasdaq-Mini previous week (85.9 percent)
Russell2000-Mini (10.1 percent) vs Russell2000-Mini previous week (0.5 percent)
Nikkei USD (62.6 percent) vs Nikkei USD previous week (68.2 percent)
EAFE-Mini (8.5 percent) vs EAFE-Mini previous week (12.6 percent)

Strength Trends

Strength Score Trends (or move index, calculates the 6-week changes in strength scores) show that the Nasdaq-Mini (6.2 percent) and DowJones-Mini (5.7 percent) lead the past six weeks trends for stocks this week. The S&P500-Mini (-35.4 percent) leads the downside trend scores currently while the next market with lower trend scores were the EAFE-Mini (-30.9 percent) followed by the Nikkei USD (-21.8 percent).

Strength Trend Statistics:
VIX (-6.3 percent) vs VIX previous week (-10.8 percent)
S&P500-Mini (-35.4 percent) vs S&P500-Mini previous week (-44.0 percent)
DowJones-Mini (5.7 percent) vs DowJones-Mini previous week (7.8 percent)
Nasdaq-Mini (6.2 percent) vs Nasdaq-Mini previous week (7.7 percent)
Russell2000-Mini (-15.3 percent) vs Russell2000-Mini previous week (-22.2 percent)
Nikkei USD (-21.8 percent) vs Nikkei USD previous week (5.4 percent)
EAFE-Mini (-30.9 percent) vs EAFE-Mini previous week (-20.7 percent)


Individual Markets:

VIX Volatility Futures:

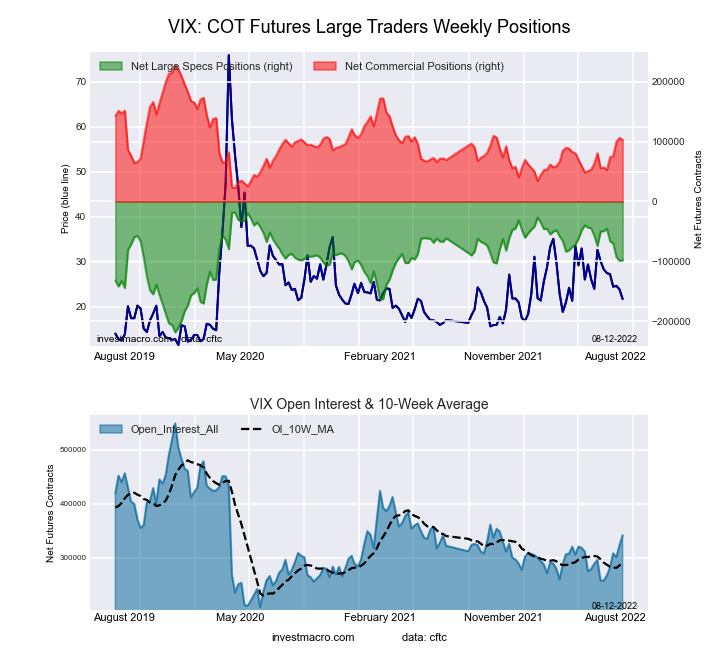
VIX Volatility Futures COT ChartThe VIX Volatility large speculator standing this week equaled a net position of -69,900 contracts in the data reported through Tuesday. This was a weekly decline of -3,533 contracts from the previous week which had a total of -66,367 net contracts.

This week’s current strength score (the trader positioning range over the past three years, measured from 0 to 100) shows the speculators are currently Bullish with a score of 74.2 percent. The commercials are Bearish with a score of 26.1 percent and the small traders (not shown in chart) are Bullish with a score of 61.4 percent.

VIX Volatility Futures StatisticsSPECULATORSCOMMERCIALSSMALL TRADERS
– Percent of Open Interest Longs:15.556.87.9
– Percent of Open Interest Shorts:38.232.19.9
– Net Position:-69,90076,077-6,177
– Gross Longs:47,762175,04324,318
– Gross Shorts:117,66298,96630,495
– Long to Short Ratio:0.4 to 11.8 to 10.8 to 1
NET POSITION TREND:
– Strength Index Score (3 Year Range Pct):74.226.161.4
– Strength Index Reading (3 Year Range):BullishBearishBullish
NET POSITION MOVEMENT INDEX:
– 6-Week Change in Strength Index:-6.36.4-2.4


S&P500 Mini Futures:

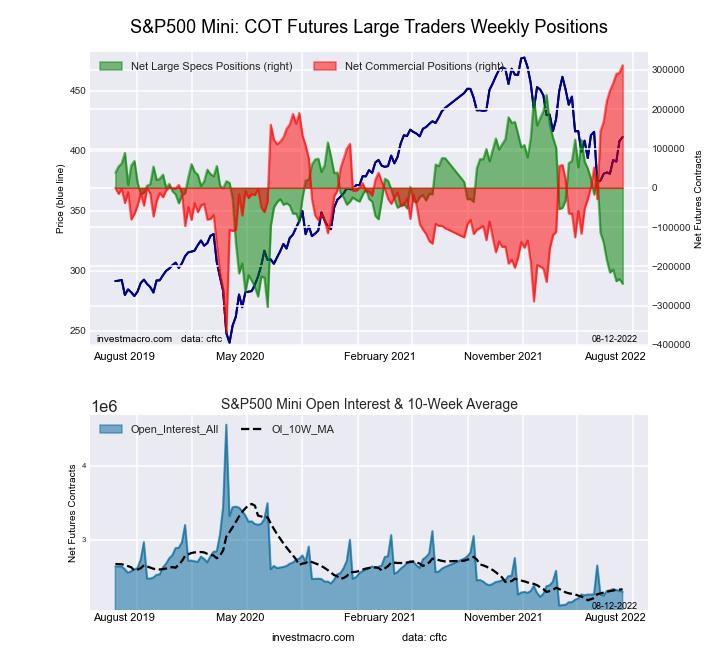
The S&P500 Mini large speculator standing this week equaled a net position of -208,148 contracts in the data reported through Tuesday. This was a weekly boost of 7,380 contracts from the previous week which had a total of -215,528 net contracts.

This week’s current strength score (the trader positioning range over the past three years, measured from 0 to 100) shows the speculators are currently Bearish-Extreme with a score of 17.6 percent. The commercials are Bullish-Extreme with a score of 100.0 percent and the small traders (not shown in chart) are Bearish-Extreme with a score of 14.2 percent.

S&P500 Mini Futures StatisticsSPECULATORSCOMMERCIALSSMALL TRADERS
– Percent of Open Interest Longs:10.776.89.6
– Percent of Open Interest Shorts:19.665.412.1
– Net Position:-208,148266,346-58,198
– Gross Longs:250,3871,792,747223,471
– Gross Shorts:458,5351,526,401281,669
– Long to Short Ratio:0.5 to 11.2 to 10.8 to 1
NET POSITION TREND:
– Strength Index Score (3 Year Range Pct):17.6100.014.2
– Strength Index Reading (3 Year Range):Bearish-ExtremeBullish-ExtremeBearish-Extreme
NET POSITION MOVEMENT INDEX:
– 6-Week Change in Strength Index:-35.433.8-4.9


Dow Jones Mini Futures:

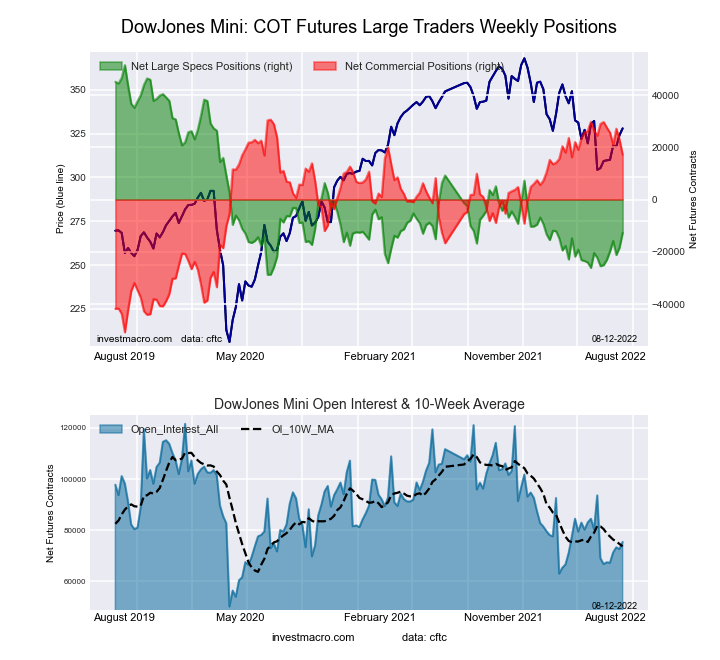
Dow Jones Mini Futures COT ChartThe Dow Jones Mini large speculator standing this week equaled a net position of -15,837 contracts in the data reported through Tuesday. This was a weekly gain of 4,006 contracts from the previous week which had a total of -19,843 net contracts.

This week’s current strength score (the trader positioning range over the past three years, measured from 0 to 100) shows the speculators are currently Bearish-Extreme with a score of 16.1 percent. The commercials are Bullish-Extreme with a score of 88.2 percent and the small traders (not shown in chart) are Bearish-Extreme with a score of 10.9 percent.

Dow Jones Mini Futures StatisticsSPECULATORSCOMMERCIALSSMALL TRADERS
– Percent of Open Interest Longs:24.659.914.6
– Percent of Open Interest Shorts:46.930.421.8
– Net Position:-15,83720,984-5,147
– Gross Longs:17,56742,66710,371
– Gross Shorts:33,40421,68315,518
– Long to Short Ratio:0.5 to 12.0 to 10.7 to 1
NET POSITION TREND:
– Strength Index Score (3 Year Range Pct):16.188.210.9
– Strength Index Reading (3 Year Range):Bearish-ExtremeBullish-ExtremeBearish-Extreme
NET POSITION MOVEMENT INDEX:
– 6-Week Change in Strength Index:5.7-6.85.0


Nasdaq Mini Futures:

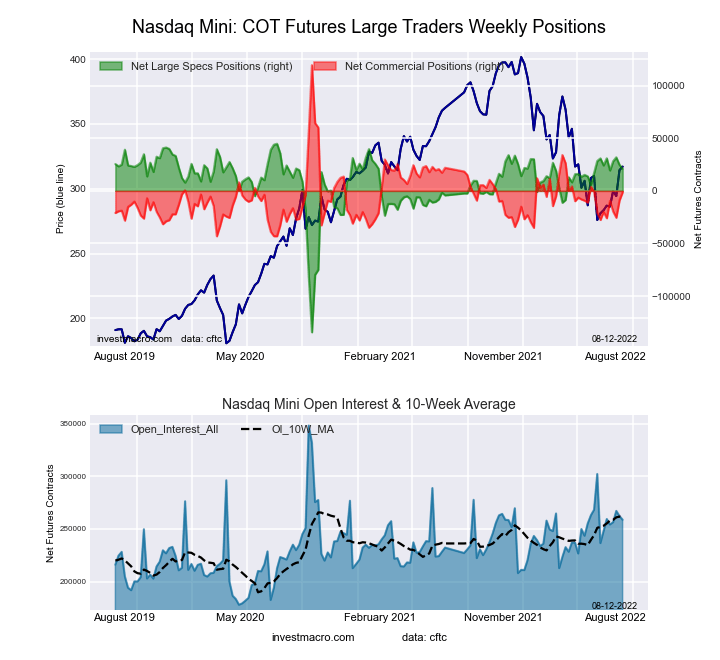
The Nasdaq Mini large speculator standing this week equaled a net position of 28,117 contracts in the data reported through Tuesday. This was a weekly advance of 8,701 contracts from the previous week which had a total of 19,416 net contracts.

This week’s current strength score (the trader positioning range over the past three years, measured from 0 to 100) shows the speculators are currently Bullish-Extreme with a score of 90.7 percent. The commercials are Bearish-Extreme with a score of 14.5 percent and the small traders (not shown in chart) are Bearish with a score of 30.9 percent.

Nasdaq Mini Futures StatisticsSPECULATORSCOMMERCIALSSMALL TRADERS
– Percent of Open Interest Longs:30.054.213.5
– Percent of Open Interest Shorts:19.061.916.8
– Net Position:28,117-19,555-8,562
– Gross Longs:76,826139,08834,491
– Gross Shorts:48,709158,64343,053
– Long to Short Ratio:1.6 to 10.9 to 10.8 to 1
NET POSITION TREND:
– Strength Index Score (3 Year Range Pct):90.714.530.9
– Strength Index Reading (3 Year Range):Bullish-ExtremeBearish-ExtremeBearish
NET POSITION MOVEMENT INDEX:
– 6-Week Change in Strength Index:6.2-11.415.4


Russell 2000 Mini Futures:

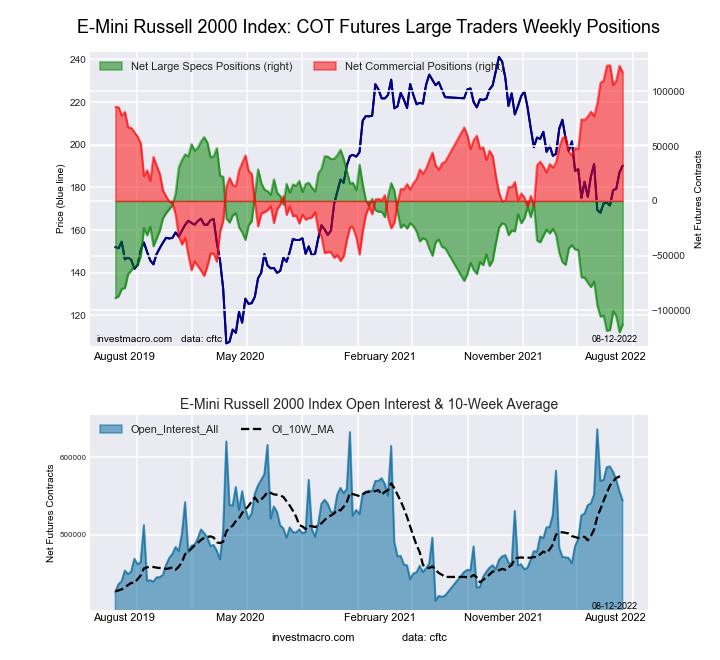
The Russell 2000 Mini large speculator standing this week equaled a net position of -100,689 contracts in the data reported through Tuesday. This was a weekly lift of 17,089 contracts from the previous week which had a total of -117,778 net contracts.

This week’s current strength score (the trader positioning range over the past three years, measured from 0 to 100) shows the speculators are currently Bearish-Extreme with a score of 10.1 percent. The commercials are Bullish-Extreme with a score of 90.6 percent and the small traders (not shown in chart) are Bearish-Extreme with a score of 11.6 percent.

Russell 2000 Mini Futures StatisticsSPECULATORSCOMMERCIALSSMALL TRADERS
– Percent of Open Interest Longs:9.186.73.5
– Percent of Open Interest Shorts:26.568.44.4
– Net Position:-100,689105,868-5,179
– Gross Longs:53,055503,44920,163
– Gross Shorts:153,744397,58125,342
– Long to Short Ratio:0.3 to 11.3 to 10.8 to 1
NET POSITION TREND:
– Strength Index Score (3 Year Range Pct):10.190.611.6
– Strength Index Reading (3 Year Range):Bearish-ExtremeBullish-ExtremeBearish-Extreme
NET POSITION MOVEMENT INDEX:
– 6-Week Change in Strength Index:-15.314.8-4.0


Nikkei Stock Average (USD) Futures:

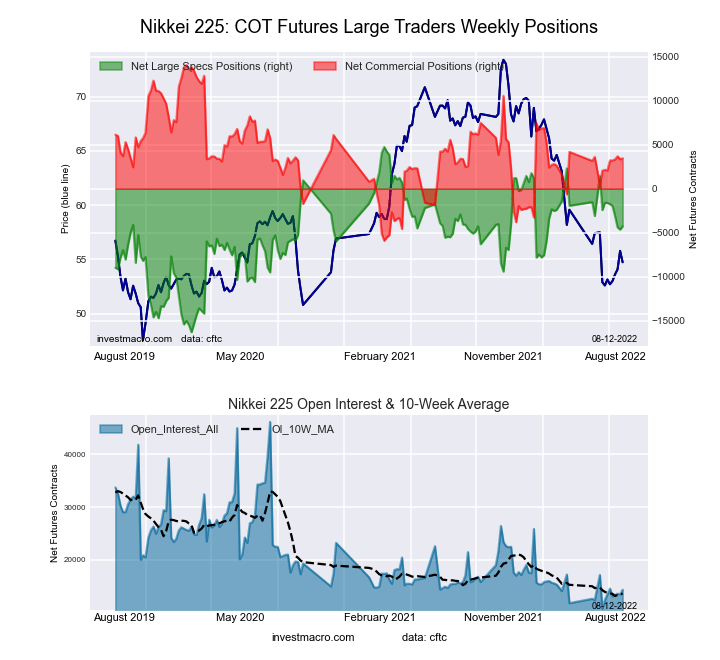
The Nikkei Stock Average (USD) large speculator standing this week equaled a net position of -3,127 contracts in the data reported through Tuesday. This was a weekly reduction of -1,176 contracts from the previous week which had a total of -1,951 net contracts.

This week’s current strength score (the trader positioning range over the past three years, measured from 0 to 100) shows the speculators are currently Bullish with a score of 62.6 percent. The commercials are Bearish with a score of 46.4 percent and the small traders (not shown in chart) are Bearish with a score of 25.6 percent.

Nikkei Stock Average Futures StatisticsSPECULATORSCOMMERCIALSSMALL TRADERS
– Percent of Open Interest Longs:17.061.920.9
– Percent of Open Interest Shorts:40.536.822.5
– Net Position:-3,1273,341-214
– Gross Longs:2,2698,2412,783
– Gross Shorts:5,3964,9002,997
– Long to Short Ratio:0.4 to 11.7 to 10.9 to 1
NET POSITION TREND:
– Strength Index Score (3 Year Range Pct):62.646.425.6
– Strength Index Reading (3 Year Range):BullishBearishBearish
NET POSITION MOVEMENT INDEX:
– 6-Week Change in Strength Index:-21.814.521.3


MSCI EAFE Mini Futures:

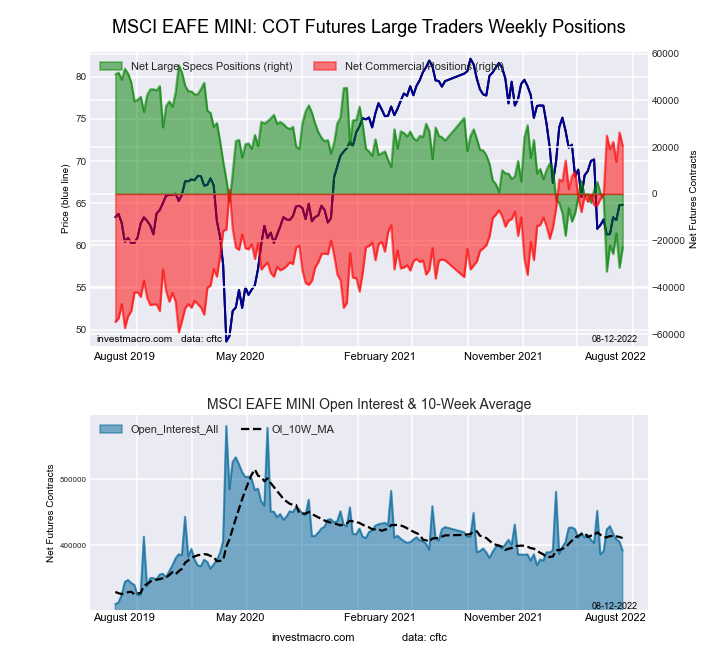
MSCI EAFE Mini Futures COT ChartThe MSCI EAFE Mini large speculator standing this week equaled a net position of -25,673 contracts in the data reported through Tuesday. This was a weekly decrease of -3,637 contracts from the previous week which had a total of -22,036 net contracts.

This week’s current strength score (the trader positioning range over the past three years, measured from 0 to 100) shows the speculators are currently Bearish-Extreme with a score of 8.5 percent. The commercials are Bullish-Extreme with a score of 96.8 percent and the small traders (not shown in chart) are Bearish with a score of 48.9 percent.

MSCI EAFE Mini Futures StatisticsSPECULATORSCOMMERCIALSSMALL TRADERS
– Percent of Open Interest Longs:5.591.62.2
– Percent of Open Interest Shorts:11.686.31.4
– Net Position:-25,67322,2453,428
– Gross Longs:22,869382,7619,198
– Gross Shorts:48,542360,5165,770
– Long to Short Ratio:0.5 to 11.1 to 11.6 to 1
NET POSITION TREND:
– Strength Index Score (3 Year Range Pct):8.596.848.9
– Strength Index Reading (3 Year Range):Bearish-ExtremeBullish-ExtremeBearish
NET POSITION MOVEMENT INDEX:
– 6-Week Change in Strength Index:-30.932.21.6


Article By InvestMacroReceive our weekly COT Reports by Email

*COT Report: The COT data, released weekly to the public each Friday, is updated through the most recent Tuesday (data is 3 days old) and shows a quick view of how large speculators or non-commercials (for-profit traders) were positioned in the futures markets.

The CFTC categorizes trader positions according to commercial hedgers (traders who use futures contracts for hedging as part of the business), non-commercials (large traders who speculate to realize trading profits) and nonreportable traders (usually small traders/speculators) as well as their open interest (contracts open in the market at time of reporting).See CFTC criteria here.

COT Week 29 Charts: Energy Speculator bets go higher led by Natural Gas & Gasoline

By InvestMacro | COT | Data Tables | COT Leaders | Downloads | COT Newsletter

Here are the latest charts and statistics for the Commitment of Traders (COT) data published by the Commodities Futures Trading Commission (CFTC).

The latest COT data is updated through Tuesday July 19th and shows a quick view of how large traders (for-profit speculators and commercial entities) were positioned in the futures markets.

Weekly Speculator Changes

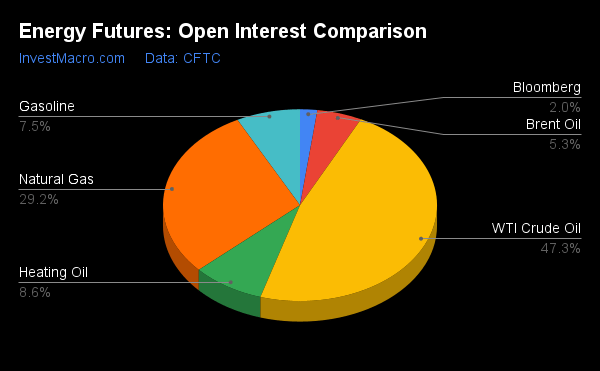
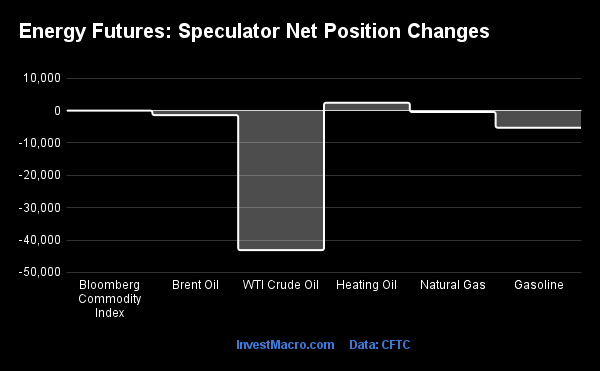
COT energy market speculator bets were mostly higher this week as four out of the six energy markets we cover had higher positioning this week while the other two markets had lower contracts.

Leading the gains for energy markets was Natural Gas (11,280 contracts) with Gasoline (7,074 contracts), WTI Crude Oil (2,763 contracts) and Heating Oil (2,515 contracts) also showing  positive weeks.

The energy markets leading the declines in speculator bets this week was the Bloomberg Commodity Index (-3,413 contracts) with Brent Crude Oil (-2,914 contracts) also registering lower bets on the week.


Data Snapshot of Commodity Market Traders | Columns Legend
Jul-19-2022OIOI-IndexSpec-NetSpec-IndexCom-NetCOM-IndexSmalls-NetSmalls-Index
WTI Crude1,577,6160271,0911-293,68910022,59847
Gold524,7862194,9550-112,26210017,3070
Silver145,247121,3600-8,2131006,8532
Copper174,5928-23,8362523,745769126
Palladium6,9153-3,75124,30299-55112
Platinum75,06947-4,2822-273984,55526
Natural Gas953,3250-120,3234286,6995833,62460
Brent177,88922-41,3024240,8436145915
Heating Oil267,576229,24356-23,8004614,55749
Soybeans602,9870102,59345-74,42761-28,16623
Corn1,308,4580209,94057-165,61148-44,32918
Coffee196,041327,97963-28,02644470
Sugar703,6140127,16263-141,8424114,68026
Wheat292,70026,522283,17364-9,69560


Strength Scores

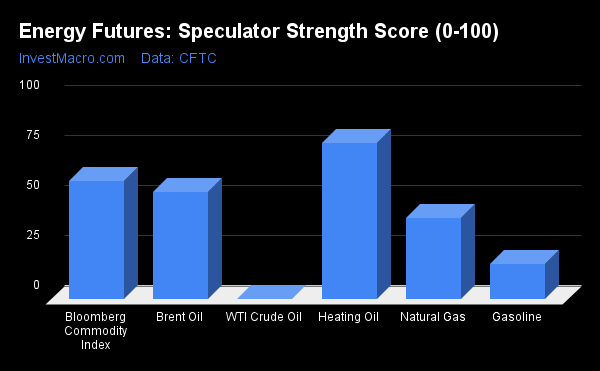
Strength Scores (a normalized measure of Speculator positions over a 3-Year range, from 0 to 100 where above 80 is extreme bullish and below 20 is extreme bearish) show that the Heating Oil (56.0 percent) and the Bloomberg Commodity Index (53.4 percent) lead the energy markets with both above the 50 percent level of the past three year ranges. On the downside, WTI Crude Oil (0.9 percent) comes in at the lowest strength level currently and is followed by Gasoline (11.8 percent) with both in bearish extreme levels (below 20 percent).

Strength Statistics:
WTI Crude Oil (0.9 percent) vs WTI Crude Oil previous week (0.0 percent)
Brent Crude Oil (41.9 percent) vs Brent Crude Oil previous week (46.8 percent)
Natural Gas (42.5 percent) vs Natural Gas previous week (39.1 percent)
Gasoline (11.8 percent) vs Gasoline previous week (4.7 percent)
Heating Oil (56.0 percent) vs Heating Oil previous week (52.3 percent)
Bloomberg Commodity Index (53.4 percent) vs Bloomberg Commodity Index previous week (66.5 percent)

Strength Trends

Strength Score Trends (or move index, calculates the 6-week changes in strength scores) show that the Gasoline (9.4 percent) leads the past six weeks trends for energy this week. Heating Oil (6.4 percent) is the only positive mover in the latest trends data. The Bloomberg Commodity Index (-22.0 percent) leads the downside trend scores currently while the next market with lower trend scores were WTI Crude Oil (-17.8 percent) followed by Brent Crude Oil (-8.7 percent).


Strength Trend Statistics:
WTI Crude Oil (-17.8 percent) vs WTI Crude Oil previous week (-20.1 percent)
Brent Crude Oil (-8.7 percent) vs Brent Crude Oil previous week (4.2 percent)
Natural Gas (-1.8 percent) vs Natural Gas previous week (-6.4 percent)
Gasoline (9.4 percent) vs Gasoline previous week (-1.0 percent)
Heating Oil (6.4 percent) vs Heating Oil previous week (9.7 percent)
Bloomberg Commodity Index (-22.0 percent) vs Bloomberg Commodity Index previous week (-0.6 percent)


Individual Markets:

WTI Crude Oil Futures:

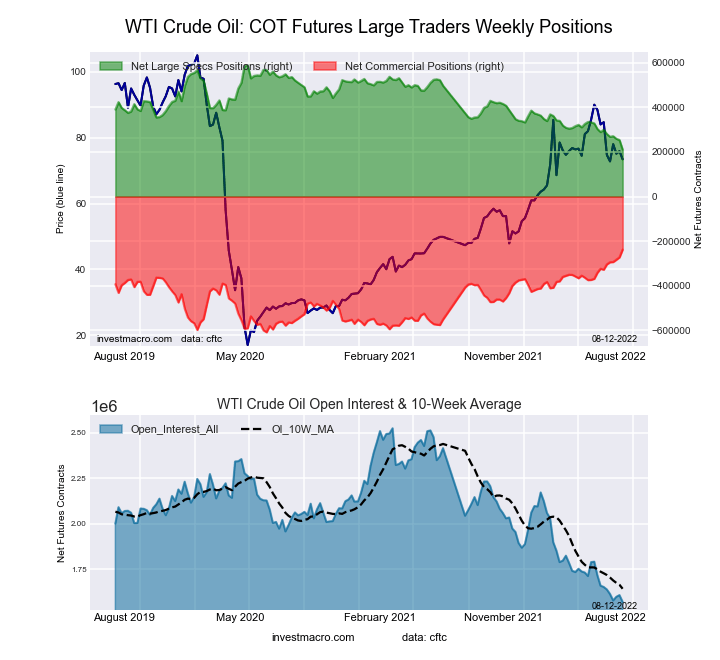
The WTI Crude Oil Futures large speculator standing this week totaled a net position of 271,091 contracts in the data reported through Tuesday. This was a weekly advance of 2,763 contracts from the previous week which had a total of 268,328 net contracts.

This week’s current strength score (the trader positioning range over the past three years, measured from 0 to 100) shows the speculators are currently Bearish-Extreme with a score of 0.9 percent. The commercials are Bullish-Extreme with a score of 100.0 percent and the small traders (not shown in chart) are Bearish with a score of 46.8 percent.

WTI Crude Oil Futures StatisticsSPECULATORSCOMMERCIALSSMALL TRADERS
– Percent of Open Interest Longs:23.736.84.7
– Percent of Open Interest Shorts:6.655.43.2
– Net Position:271,091-293,68922,598
– Gross Longs:374,677580,33073,482
– Gross Shorts:103,586874,01950,884
– Long to Short Ratio:3.6 to 10.7 to 11.4 to 1
NET POSITION TREND:
– Strength Index Score (3 Year Range Pct):0.9100.046.8
– Strength Index Reading (3 Year Range):Bearish-ExtremeBullish-ExtremeBearish
NET POSITION MOVEMENT INDEX:
– 6-Week Change in Strength Index:-17.823.9-25.6


Brent Crude Oil Futures:

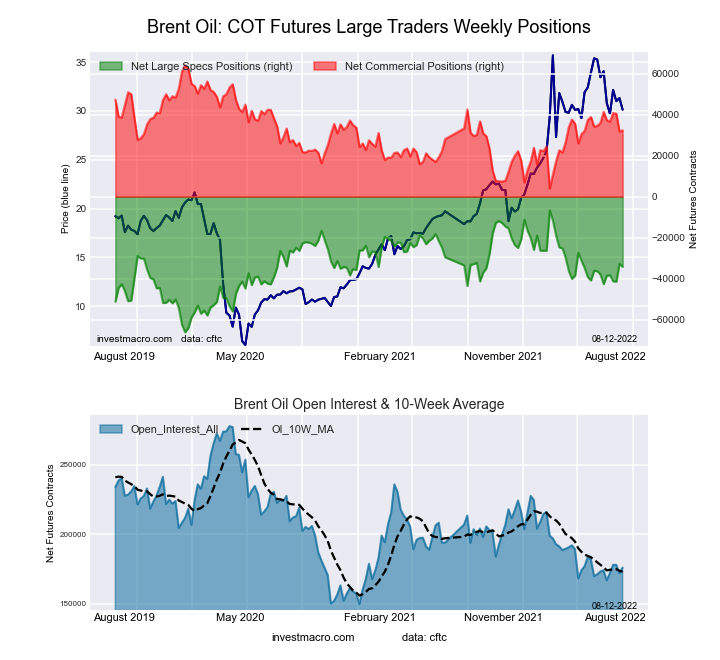
Brent Last Day Crude Oil Futures COT ChartThe Brent Crude Oil Futures large speculator standing this week totaled a net position of -41,302 contracts in the data reported through Tuesday. This was a weekly reduction of -2,914 contracts from the previous week which had a total of -38,388 net contracts.

This week’s current strength score (the trader positioning range over the past three years, measured from 0 to 100) shows the speculators are currently Bearish with a score of 41.9 percent. The commercials are Bullish with a score of 61.2 percent and the small traders (not shown in chart) are Bearish-Extreme with a score of 15.4 percent.

Brent Crude Oil Futures StatisticsSPECULATORSCOMMERCIALSSMALL TRADERS
– Percent of Open Interest Longs:15.652.53.9
– Percent of Open Interest Shorts:38.829.63.6
– Net Position:-41,30240,843459
– Gross Longs:27,72493,4116,899
– Gross Shorts:69,02652,5686,440
– Long to Short Ratio:0.4 to 11.8 to 11.1 to 1
NET POSITION TREND:
– Strength Index Score (3 Year Range Pct):41.961.215.4
– Strength Index Reading (3 Year Range):BearishBullishBearish-Extreme
NET POSITION MOVEMENT INDEX:
– 6-Week Change in Strength Index:-8.711.0-19.4


Natural Gas Futures:

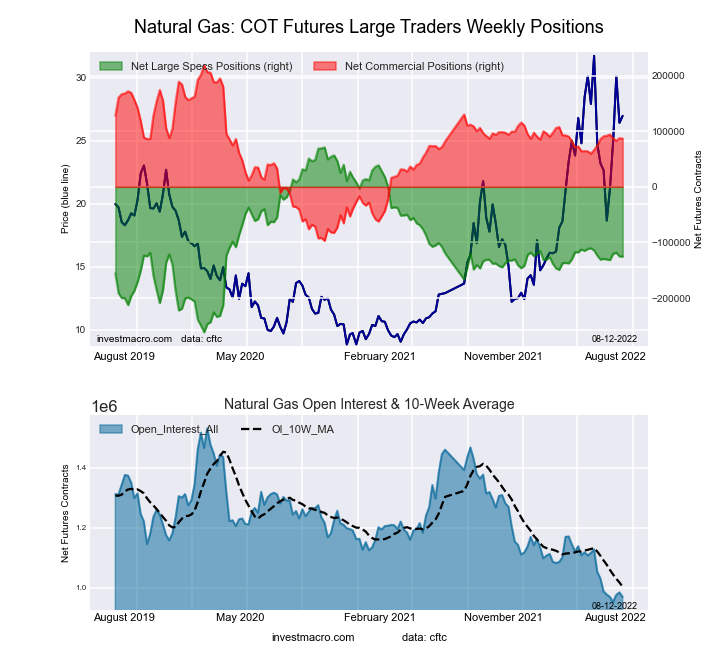
Natural Gas Futures COT ChartThe Natural Gas Futures large speculator standing this week totaled a net position of -120,323 contracts in the data reported through Tuesday. This was a weekly lift of 11,280 contracts from the previous week which had a total of -131,603 net contracts.

This week’s current strength score (the trader positioning range over the past three years, measured from 0 to 100) shows the speculators are currently Bearish with a score of 42.5 percent. The commercials are Bullish with a score of 58.2 percent and the small traders (not shown in chart) are Bullish with a score of 59.8 percent.

Natural Gas Futures StatisticsSPECULATORSCOMMERCIALSSMALL TRADERS
– Percent of Open Interest Longs:19.342.06.6
– Percent of Open Interest Shorts:31.932.93.1
– Net Position:-120,32386,69933,624
– Gross Longs:183,610400,46863,072
– Gross Shorts:303,933313,76929,448
– Long to Short Ratio:0.6 to 11.3 to 12.1 to 1
NET POSITION TREND:
– Strength Index Score (3 Year Range Pct):42.558.259.8
– Strength Index Reading (3 Year Range):BearishBullishBullish
NET POSITION MOVEMENT INDEX:
– 6-Week Change in Strength Index:-1.86.4-33.7


Gasoline Blendstock Futures:

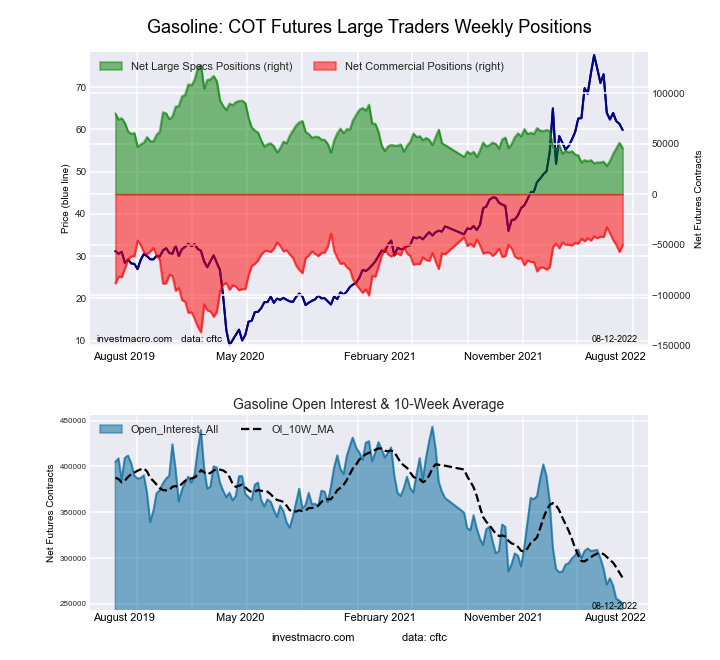
RBOB Gasoline Energy Futures COT ChartThe Gasoline Blendstock Futures large speculator standing this week totaled a net position of 39,816 contracts in the data reported through Tuesday. This was a weekly advance of 7,074 contracts from the previous week which had a total of 32,742 net contracts.

This week’s current strength score (the trader positioning range over the past three years, measured from 0 to 100) shows the speculators are currently Bearish-Extreme with a score of 11.8 percent. The commercials are Bullish-Extreme with a score of 87.7 percent and the small traders (not shown in chart) are Bullish with a score of 50.6 percent.

Nasdaq Mini Futures StatisticsSPECULATORSCOMMERCIALSSMALL TRADERS
– Percent of Open Interest Longs:26.951.77.3
– Percent of Open Interest Shorts:12.268.65.2
– Net Position:39,816-45,5015,685
– Gross Longs:72,688139,64619,650
– Gross Shorts:32,872185,14713,965
– Long to Short Ratio:2.2 to 10.8 to 11.4 to 1
NET POSITION TREND:
– Strength Index Score (3 Year Range Pct):11.887.750.6
– Strength Index Reading (3 Year Range):Bearish-ExtremeBullish-ExtremeBullish
NET POSITION MOVEMENT INDEX:
– 6-Week Change in Strength Index:9.4-3.5-37.9


#2 Heating Oil NY-Harbor Futures:

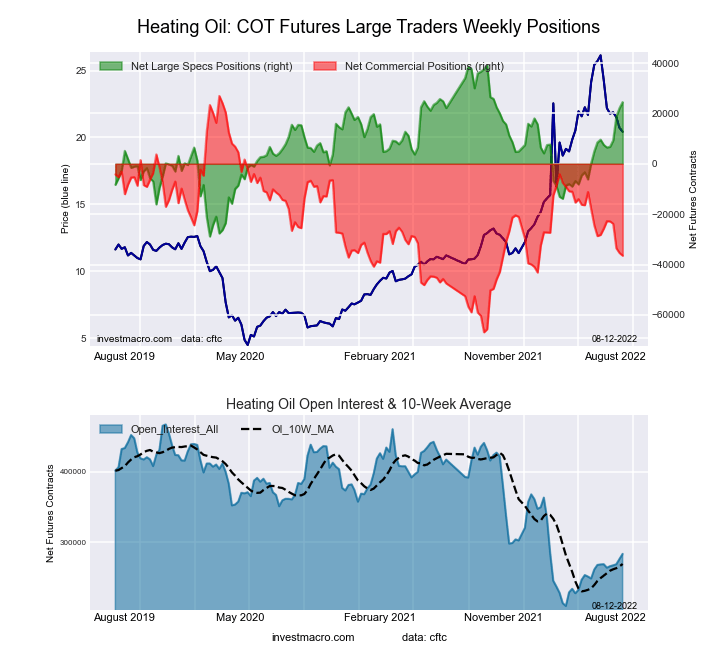
NY Harbor Heating Oil Energy Futures COT ChartThe #2 Heating Oil NY-Harbor Futures large speculator standing this week totaled a net position of 9,243 contracts in the data reported through Tuesday. This was a weekly increase of 2,515 contracts from the previous week which had a total of 6,728 net contracts.

This week’s current strength score (the trader positioning range over the past three years, measured from 0 to 100) shows the speculators are currently Bullish with a score of 56.0 percent. The commercials are Bearish with a score of 45.9 percent and the small traders (not shown in chart) are Bearish with a score of 48.8 percent.

Heating Oil Futures StatisticsSPECULATORSCOMMERCIALSSMALL TRADERS
– Percent of Open Interest Longs:14.154.115.7
– Percent of Open Interest Shorts:10.662.910.3
– Net Position:9,243-23,80014,557
– Gross Longs:37,695144,63542,056
– Gross Shorts:28,452168,43527,499
– Long to Short Ratio:1.3 to 10.9 to 11.5 to 1
NET POSITION TREND:
– Strength Index Score (3 Year Range Pct):56.045.948.8
– Strength Index Reading (3 Year Range):BullishBearishBearish
NET POSITION MOVEMENT INDEX:
– 6-Week Change in Strength Index:6.40.7-17.3


Bloomberg Commodity Index Futures:

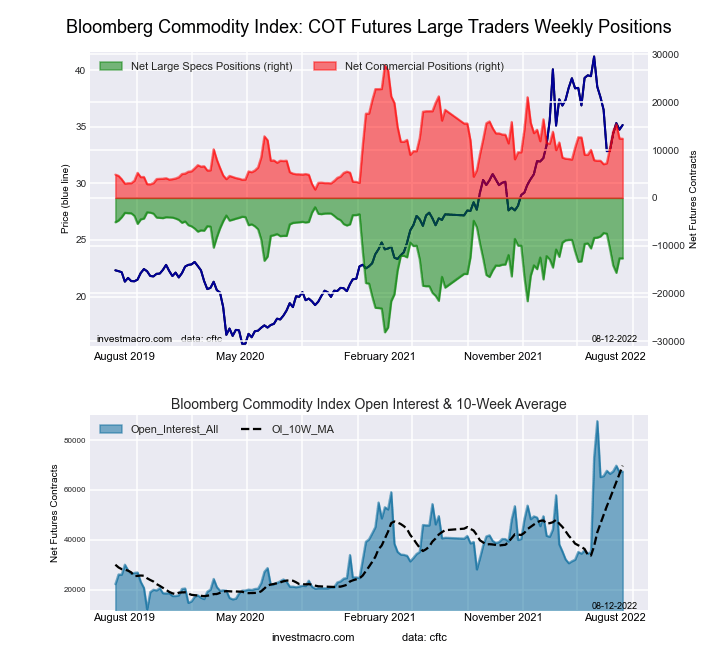
The Bloomberg Commodity Index Futures large speculator standing this week totaled a net position of -14,128 contracts in the data reported through Tuesday. This was a weekly reduction of -3,413 contracts from the previous week which had a total of -10,715 net contracts.

This week’s current strength score (the trader positioning range over the past three years, measured from 0 to 100) shows the speculators are currently Bullish with a score of 53.4 percent. The commercials are Bearish with a score of 46.8 percent and the small traders (not shown in chart) are Bearish-Extreme with a score of 18.2 percent.

Bloomberg Index Futures StatisticsSPECULATORSCOMMERCIALSSMALL TRADERS
– Percent of Open Interest Longs:19.176.90.5
– Percent of Open Interest Shorts:40.056.30.2
– Net Position:-14,12813,905223
– Gross Longs:12,86851,893364
– Gross Shorts:26,99637,988141
– Long to Short Ratio:0.5 to 11.4 to 12.6 to 1
NET POSITION TREND:
– Strength Index Score (3 Year Range Pct):53.446.818.2
– Strength Index Reading (3 Year Range):BullishBearishBearish-Extreme
NET POSITION MOVEMENT INDEX:
– 6-Week Change in Strength Index:-22.023.2-11.8


Article By InvestMacroReceive our weekly COT Reports by Email

*COT Report: The COT data, released weekly to the public each Friday, is updated through the most recent Tuesday (data is 3 days old) and shows a quick view of how large speculators or non-commercials (for-profit traders) were positioned in the futures markets.

The CFTC categorizes trader positions according to commercial hedgers (traders who use futures contracts for hedging as part of the business), non-commercials (large traders who speculate to realize trading profits) and nonreportable traders (usually small traders/speculators) as well as their open interest (contracts open in the market at time of reporting).See CFTC criteria here.

Landsat at 50: How satellites revolutionized the way we see – and protect – the natural world

By Stacy Morford, The Conversation 

Fifty years ago, U.S. scientists launched a satellite that dramatically changed how we see the world.

It captured images of Earth’s surface in minute detail, showing how wildfires burned landscapes, how farms erased forests, and many other ways humans were changing the face of the planet.

The first satellite in the Landsat series launched on July 23, 1972. Eight others followed, providing the same views so changes could be tracked over time, but with increasingly powerful instruments. Landsat 8 and Landsat 9 are orbiting the planet today, and NASA and the U.S. Geological Survey are planning a new Landsat mission.

The images and data from these satellites are used to track deforestation and changing landscapes around the world, locate urban heat islands, and understand the impact of new river dams, among many other projects. Often, the results help communities respond to risks that may not be obvious from the ground.

Here are three examples of Landsat in action, from The Conversation’s archive.

Tracking changes in the Amazon

A river meanders through the Amazon Basin, seen from Landsat.
NASA

When work began on the Belo Monte Dam project in the Brazilian Amazon in 2015, Indigenous tribes living along the Big Bend of the Xingu River started noticing changes in the river’s flow. The water they relied on for food and transportation was disappearing.

Upstream, a new channel would eventually divert as much as 80% of the water to the hydroelectric dam, bypassing the bend.

The consortium that runs the dam argued that there was no scientific proof that the change in water flow harmed fish.

But there is clear proof of the Belo Monte Dam project’s impact – from above, write Pritam Das, Faisal Hossain, Hörður Helgason and Shahzaib Khan at the University of Washington. Using satellite data from the Landsat program, the team showed how the dam dramatically altered the hydrology of the river.

“As scientists who work with remote sensing, we believe satellite observations can empower populations around the world who face threats to their resources,” Das and his colleagues write.

It’s hot in the city – and even hotter in some neighborhoods

Landsat’s instruments can also measure surface temperatures, allowing scientists to map heat risk street by street within cities as global temperatures rise.

“Cities are generally hotter than surrounding rural areas, but even within cities, some residential neighborhoods get dangerously warmer than others just a few miles away,” writes Daniel P. Johnson, who uses satellites to study the urban heat island effect at Indiana University.

Neighborhoods with more pavement and buildings and fewer trees can be 10 degrees Fahrenheit (5.5 C) or more warmer than leafier neighborhoods, Johnson writes. He found that the hottest neighborhoods tend to be low-income, have majority Black or Hispanic residents and had been subjected to redlining, the discriminatory practice once used to deny loans in racial and ethnic minority communities.

Two maps of New York City show how vegetation matches cooler areas by temperature.
Comparing maps of New York City’s vegetation and temperature shows the cooling effect of parks and neighborhoods with more trees.
NASA/USGS Landsat

“Within these ‘micro-urban heat islands,’ communities can experience heat wave conditions well before officials declare a heat emergency,” Johnson writes.

Knowing which neighborhoods face the highest risks allows cities to organize cooling centers and other programs to help residents manage the heat.

The making of ghost forests

Dead tree trunks with low ground cover below.
The white trunks of a ghost forest mark a coastal North Carolina landscape.
Emily Ury, CC BY-ND

Satellites that scan the same areas year after year can be crucial for spotting changes in hard-to-reach regions. They can monitor snow and ice cover, and, along U.S. Atlantic coast, dying wetland forests.
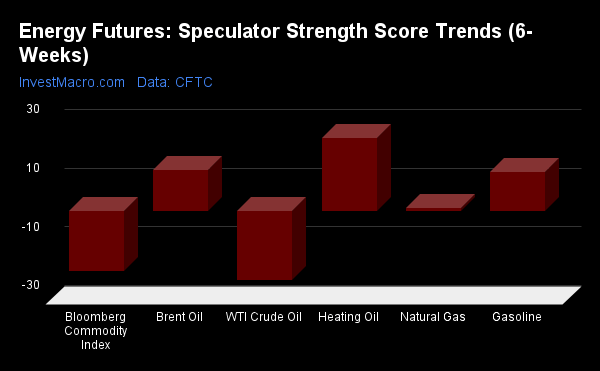
These eerie landscapes of dead, often bleached-white tree trunks have earned the nickname “ghost forests.”

Emily Ury, an ecologist now at the University of Waterloo in Ontario, used Landsat data to spot wetland changes. She then zoomed in with high-resolution images from Google Earth – which includes Landsat images – to confirm that they were ghost forests.

“The results were shocking. We found that more than 10% of forested wetland within the Alligator River National Wildlife Refuge [in North Carolina] was lost over the past 35 years. This is federally protected land, with no other human activity that could be killing off the forest,” Ury writes.

A satellite image of the coast with red spots along a river inlet indicating dead forests
Landsat’s view of the Alligator River and refuge shows signs of ghost forests on the east side of the river.
NASA Earth Observatory

As the planet warms and sea levels rise, more salt water is reaching these areas, increasing the amount of salt in the soil of coastal woodlands from Maine to Florida. “Rapid sea level rise seems to be outpacing the ability of these forests to adapt to wetter, saltier conditions,” Ury writes.

Many more stories can be found in Landsat’s images, such as an overview of the war’s effects on Ukraine’s wheat crop, and how algae blooms have spread in Florida’s Lake Okeechobee. Countless projects are using Landsat data to track global change and possibly find solutions to problems, from deforestation in the Amazon to the fires that have put Alaska on pace for another historic fire season. The Conversation

An illustration of a satellite with a large solar panel for power high over a coastal area
An artist’s rendering of Landsat 8.
NASA/Goddard Space Flight Center Conceptual Image Lab

About the Author:

Stacy Morford, Environment + Climate Editor, The Conversation

This article is republished from The Conversation under a Creative Commons license. Read the original article.


Ichimoku Cloud Analysis 22.07.2022 (EURUSD, XAUUSD, NZDUSD)

Article By RoboForex.com

XAUUSD, “Gold vs US Dollar”

As we can see in the H4 chart, XAUUSD has formed a Harami reversal pattern not far from the resistance area. At the moment, the asset may reverse in the form of a new correctional impulse. In this case, the downside correctional target may be the support level at 1650.00. At the same time, the opposite scenario implies that the price may continue growing to reach 1740.00 without any pullbacks.

XAUUSD
Risk Warning: the result of previous trading operations do not guarantee the same results in the future

NZDUSD, “New Zealand vs US Dollar”

As we can see in the H4 chart, NZDUSD has formed a Hammer reversal pattern close to the support area. At the moment, the asset may reverse in the form of another ascending impulse. In this case, the upside target may be at 0.6290. After that, the asset may break the resistance level and continue moving upwards. However, an alternative scenario implies that the price may fall to reach 0.6190 before resuming its growth towards the resistance level.

NZDUSD
Risk Warning: the result of previous trading operations do not guarantee the same results in the future

GBPUSD, “Great Britain Pound vs US Dollar”

As we can see in the H4 chart, GBPUSD has formed a Harami reversal pattern near the resistance level. At the moment, the pair may reverse in the form of a new descending impulse. In this case, the downside target may be the support area at 1.1845. Later, the market may break this level and continue falling. Still, there might be an alternative scenario, in which the asset may correct to reach the resistance level at 1.2055 first and then resume the descending tendency.

GBPUSD

Article By RoboForex.com

Attention!
Forecasts presented in this section only reflect the author’s private opinion and should not be considered as guidance for trading. RoboForex LP bears no responsibility for trading results based on trading recommendations described in these analytical reviews.

Japanese Candlesticks Analysis 22.07.2022 (XAUUSD, NZDUSD, GBPUSD)

Article By RoboForex.com

XAUUSD, “Gold vs US Dollar”

As we can see in the H4 chart, XAUUSD has formed a Harami reversal pattern not far from the resistance area. At the moment, the asset may reverse in the form of a new correctional impulse. In this case, the downside correctional target may be the support level at 1650.00. At the same time, the opposite scenario implies that the price may continue growing to reach 1740.00 without any pullbacks.

XAUUSD
Risk Warning: the result of previous trading operations do not guarantee the same results in the future

NZDUSD, “New Zealand vs US Dollar”

As we can see in the H4 chart, NZDUSD has formed a Hammer reversal pattern close to the support area. At the moment, the asset may reverse in the form of another ascending impulse. In this case, the upside target may be at 0.6290. After that, the asset may break the resistance level and continue moving upwards. However, an alternative scenario implies that the price may fall to reach 0.6190 before resuming its growth towards the resistance level.

NZDUSD
Risk Warning: the result of previous trading operations do not guarantee the same results in the future

GBPUSD, “Great Britain Pound vs US Dollar”

As we can see in the H4 chart, GBPUSD has formed a Harami reversal pattern near the resistance level. At the moment, the pair may reverse in the form of a new descending impulse. In this case, the downside target may be the support area at 1.1845. Later, the market may break this level and continue falling. Still, there might be an alternative scenario, in which the asset may correct to reach the resistance level at 1.2055 first and then resume the descending tendency.

GBPUSD

Article By RoboForex.com

Attention!
Forecasts presented in this section only reflect the author’s private opinion and should not be considered as guidance for trading. RoboForex LP bears no responsibility for trading results based on trading recommendations described in these analytical reviews.