
Article By RoboForex.com
XAUUSD, “Gold vs US Dollar”
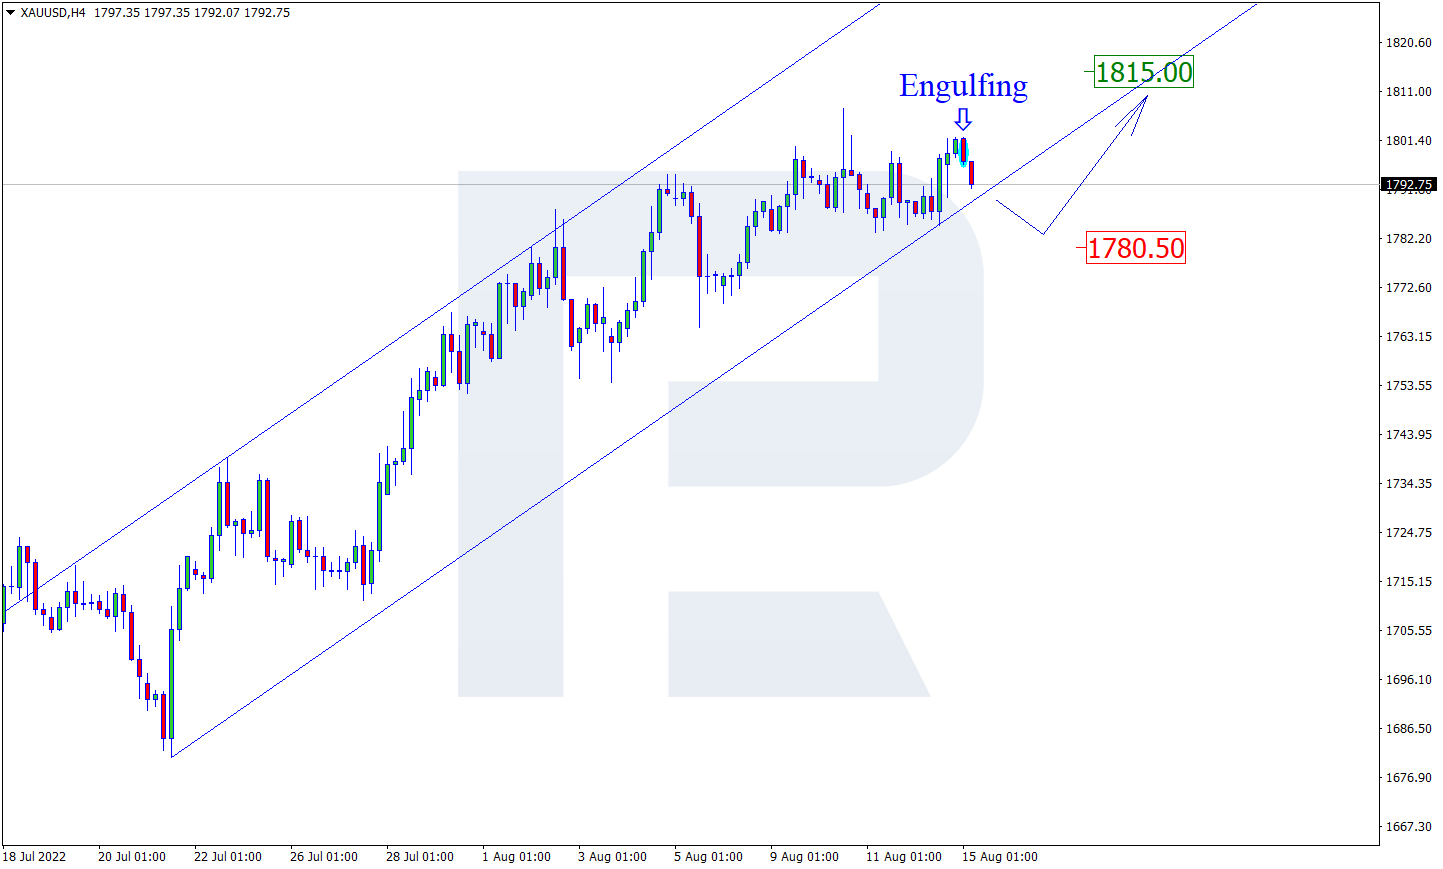
As we can see in the H4 chart, XAUUSD has formed an Engulfing reversal pattern not far from the resistance area. At the moment, the asset may reverse in the form of a new descending impulse. In this case, the downside target may be at 1780.50. At the same time, the opposite scenario implies that the price may grow to reach 1815.00 without testing the support level.

NZDUSD, “New Zealand vs US Dollar”
As we can see in the H4 chart, NZDUSD has formed a Harami reversal pattern close to the resistance area. At the moment, the asset is reversing in the form of another descending impulse. In this case, the downside correctional target may be at 0.6385. After that, the asset may rebound from the support level and resume moving upwards. However, an alternative scenario implies that the price may grow to reach 0.6475 without any pullbacks down to the support level.
Free Reports:
 Download Our Metatrader 4 Indicators – Put Our Free MetaTrader 4 Custom Indicators on your charts when you join our Weekly Newsletter
 Get our Weekly Commitment of Traders Reports - See where the biggest traders (Hedge Funds and Commercial Hedgers) are positioned in the futures markets on a weekly basis.

GBPUSD, “Great Britain Pound vs US Dollar”
As we can see in the H4 chart, GBPUSD has formed a Harami reversal pattern near the support level. At the moment, the pair may reverse in the form of a new ascending impulse. In this case, the upside target may be the resistance area at 1.2255. Later, the market may break this level and continue growing. Still, there might be an alternative scenario, in which the asset may correct to reach the support level at 1.2075 first and then resume the ascending tendency.

Article By RoboForex.com
Attention!
Forecasts presented in this section only reflect the author’s private opinion and should not be considered as guidance for trading. RoboForex LP bears no responsibility for trading results based on trading recommendations described in these analytical reviews.

- GBP/USD Starts the Week on a Strong Footing Aug 10, 2026
- The US stock indices finished the session with solid gains following the release of weak labor‑market data Aug 10, 2026
- COT Metals Charts: Speculator Bets led by Gold, Copper & Platinum Aug 9, 2026
- COT Bonds Charts: Speculator Bets led by 2-Year Bonds & US Treasury Bonds Aug 9, 2026
- COT Energy Charts: Speculator Bets led by Heating Oil & Bloomberg Index Aug 9, 2026
- COT Soft Commodities Charts: Speculator Bets led by Sugar & Cotton Aug 9, 2026
- The Central Bank of Mexico kept its interest rate unchanged. Iran plans to introduce strict bans for US and Israeli vessels in the Strait of Hormuz Aug 7, 2026
- USD/JPY Holds Firm: Yen Loses Some Support Aug 7, 2026
- Australian trade balance returned to positive territory Aug 6, 2026
- Results in Line for Most Reporting Companies Aug 5, 2026
