The euro gained about 1.4% against the US dollar last week, the best week since late May. On Friday, San Francisco Federal Reserve President Mary Daly said it was time to start talking about slowing borrowing costs and that the Fed should be less aggressive in its rate hike cycle. So the next rate hike is being considered at 0.5%. The statement came as a surprise to analysts as all previous statements of the Fed representatives were only aimed at an aggressive rate hike cycle with the next step at 0.75%. Because the ECB is planning to raise the rate by 0.75% this week, a reduction in the interest rate differential between the US Fed and the ECB might give confidence to the European currency.
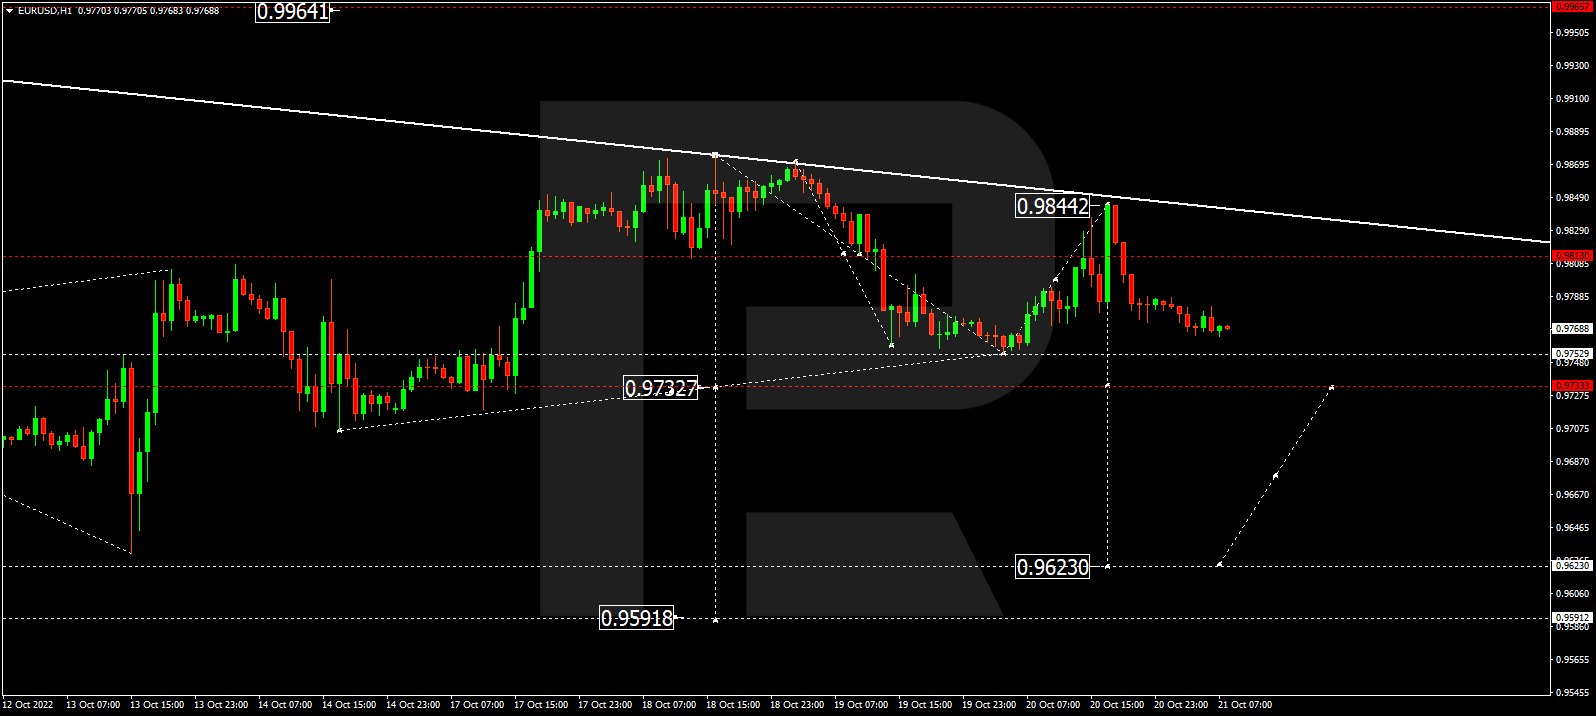
From the technical point of view, the trend on the EUR/USD currency pair on the hourly time frame is bullish. The price is trading above the moving averages. The MACD indicator became positive, and the buyers’ pressure is prevailing again. Buy trades should be considered from the support level of 0.9817 or 0.9755, but with additional confirmation in the form of reverse initiative. Sell deals may be considered from the resistance level of 0.9961, but also with confirmation.
Alternative scenario: if the price breaks down through the support level of 0.9700 and fixes below it, the downtrend will likely resume.
News feed for 2022.10.24:
– French Manufacturing PMI (m/m) at 10:15 (GMT+3);
– French Services PMI (m/m) at 10:15 (GMT+3);
– German Manufacturing PMI (m/m) at 10:30 (GMT+3);
– German Services PMI (m/m) at 10:30 (GMT+3);
– Eurozone Manufacturing PMI (m/m) at 11:00 (GMT+3);
– Eurozone Services PMI (m/m) at 11:00 (GMT+3);
– US Manufacturing PMI (m/m) at 16:45 (GMT+3);
– US Services PMI (m/m) at 16:45 (GMT+3);
– US Treasury Secretary Yellen Speaks at 18:00 (GMT+3).
The GBP/USD currency pair
Technical indicators of the currency pair:
Prev Open: 1.1219
Prev Close: 1.1292
% chg. over the last day: +0.65 %
This week the Conservative Party of Great Britain must choose a new leader to become the fifth Prime Minister in Great Britain in the last six years. Boris Johnson has announced that he will not run for the Conservative Party leader and UK prime minister position. Thus, former finance minister Rishi Sunak is the front-runner for the prime minister. The next prime minister will inherit an economy on the road to a recession, with rising interest rates and inflation of more than 10%, leaving millions of people facing a cost-of-living crisis. Chancellor Jeremy Hunt, who is expected to remain in office under the new prime minister, said Friday that he would do “whatever is necessary” to reduce the national debt ahead of his new budget, to be announced on October 31.
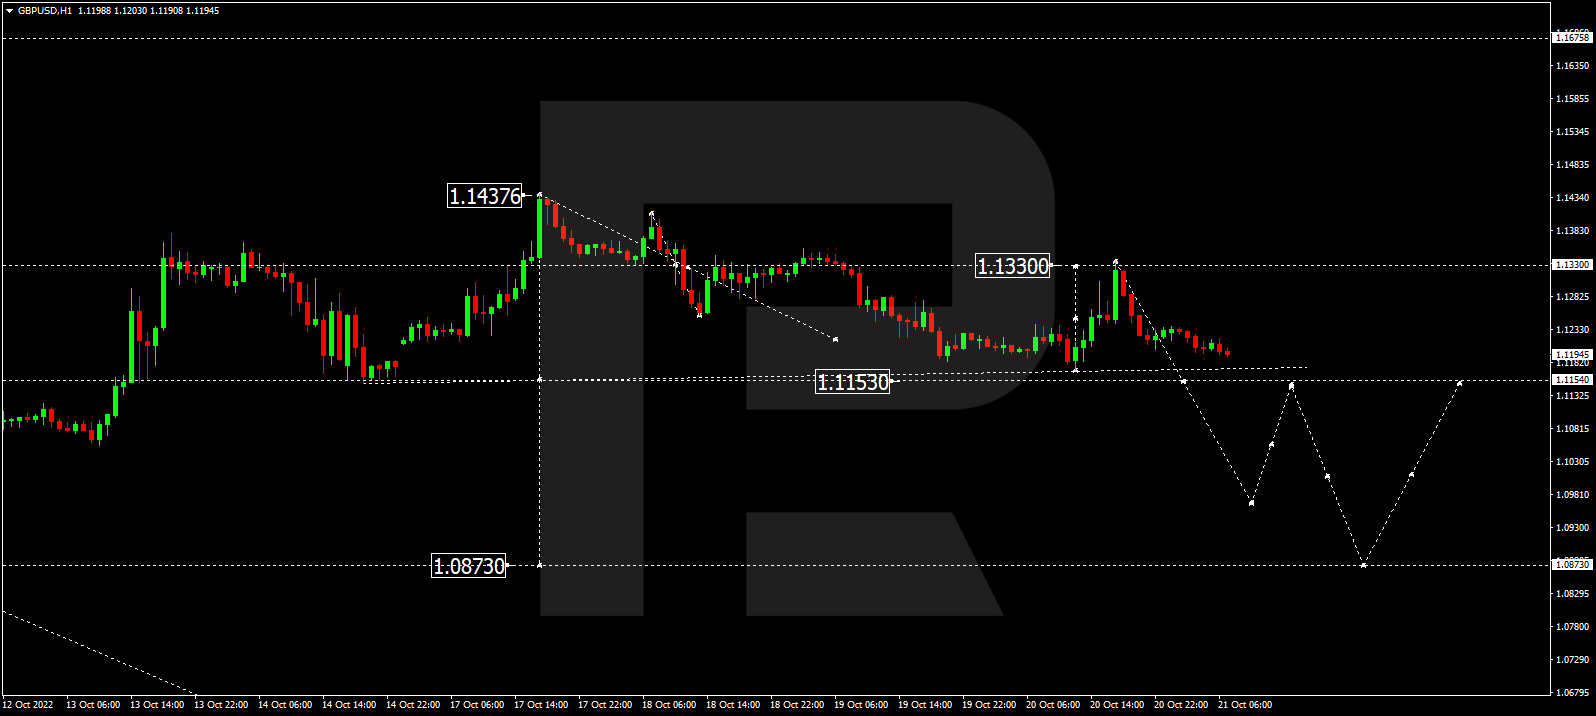
From the technical point of view, the GBP/USD currency pair trend on the hourly time frame is bullish. But the price is trading below the moving averages. The price is trading below the moving averages again. The MACD indicator has become positive, and buyers’ pressure prevails. Under such market conditions, buy trades can be considered from the support level of 1.1172, but better after confirmation. Sell trades are best to look for on intraday time frames, the nearest resistance level is 1.1369.
Alternative scenario: if the price breaks down of the 1.1093 support level and fixes below it, the downtrend will likely resume.
News feed for 2022.10.24:
– UK Manufacturing PMI (m/m) at 11:30 (GMT+3);
– UK Services PMI (m/m) at 11:30 (GMT+3).
The USD/JPY currency pair
Technical indicators of the currency pair:
Prev Open: 150.13
Prev Close: 147.58
% chg. over the last day: -1.73 %
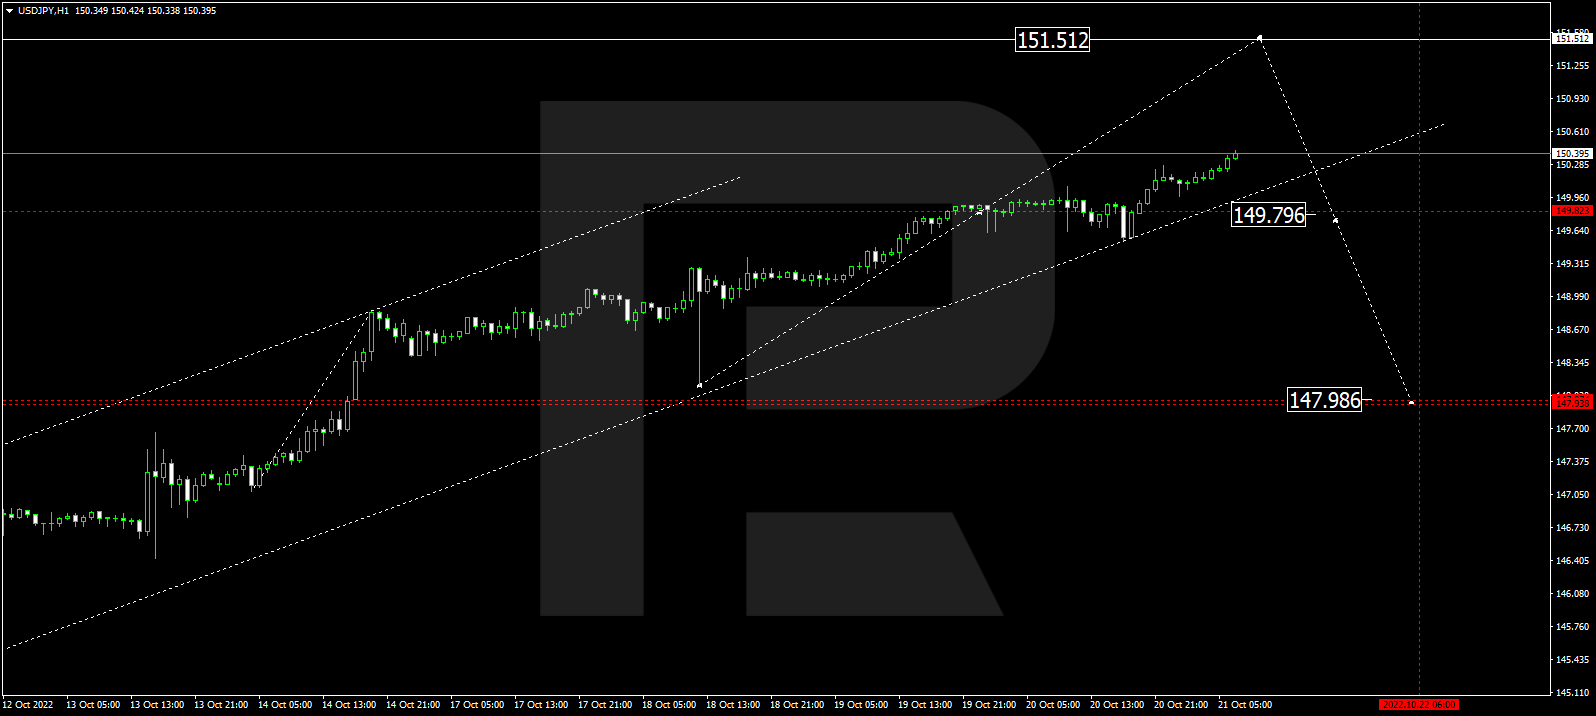
On Friday, the Japanese Ministry of Finance carried out another intervention to protect the yen from falling further. The background to this price movement is the continued monetary policy divergence between the Bank of Japan and the US Federal Reserve. The Japanese government is expected to announce a stimulus package by the end of this month. The weak yen exacerbates household problems by raising the expensive food and fuel costs. The Bank of Japan will also meet on monetary policy and interest rates this week. But analysts do not expect any changes and believe that the Bank of Japan will maintain its current loose monetary policy, which will continue to put pressure on the yen.
Trading recommendations
Support levels: 146.63, 145.88, 144.91, 144.16, 143.00
Resistance levels: 149.55, 150.00, 151.05
From the technical point of view, the medium-term trend on the currency pair USD/JPY is bullish despite the currency intervention. The price is trading below the moving levels. The MACD indicator is in the negative zone, but the buyers’ pressure remains. Under such market conditions, buy trades can be sought on intraday time frames from the support level of 146.63, but with confirmation. Sell deals can be searched from the resistance level of 150.00 or 151.05, but only with additional confirmation in the form of a reverse initiative.
Alternative scenario: If the price fixes below 145.88, the downtrend will likely resume.
News feed for 2022.10.24:
– Japan Manufacturing PMI (m/m) at 03:30 (GMT+3);
– Japan Services PMI (m/m) at 03:30 (GMT+3).
The USD/CAD currency pair
Technical indicators of the currency pair:
Prev Open: 1.3761
Prev Close: 1.3643
% chg. over the last day: -0.86 %
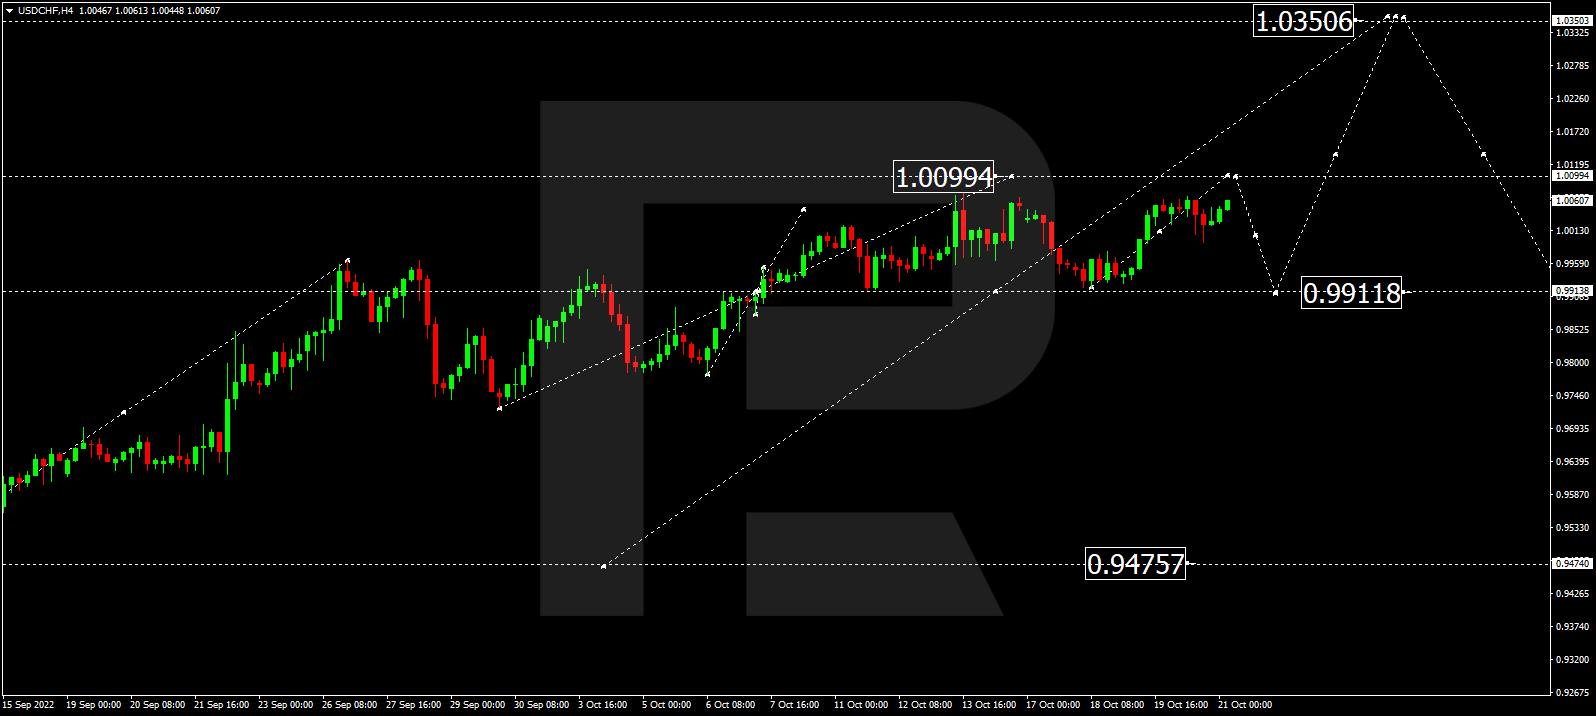
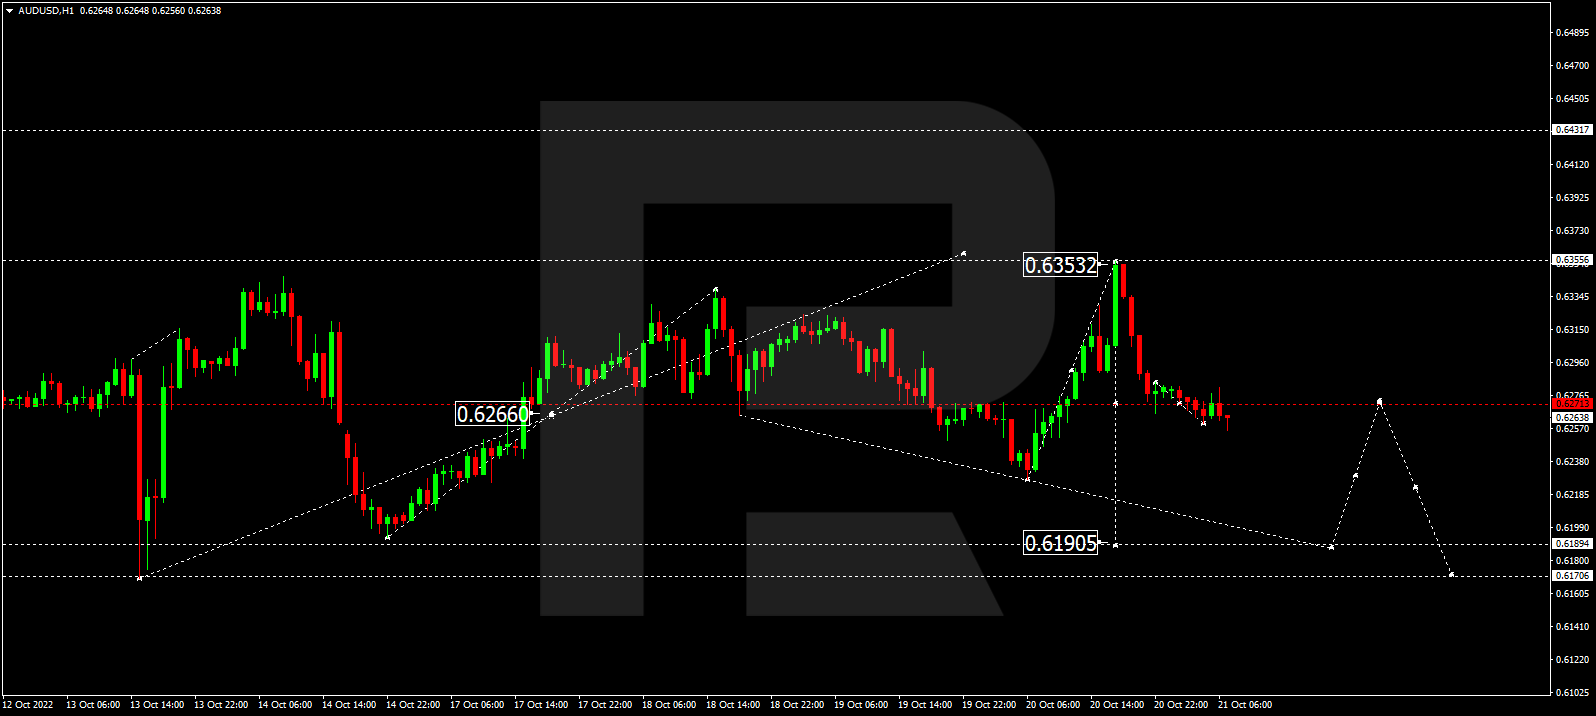
The Bank of Canada will hold its monetary policy and interest rate meeting this week. The Bank of Canada is expected to raise its benchmark interest rate by 50 basis points, although a move from 75 bps is possible as core inflation in Canada shows no signs of slowing. Also, keep in mind that the Canadian dollar is a commodity currency, so it is also highly exposed to oil price fluctuations. The medium-term oil outlook points to growth, so amid a decline in the dollar index, the Canadian currency can at least take over the initiative.
Trading recommendations
Support levels: 1.3639, 1.3619, 1.3583, 1.3535, 1.3454
Resistance levels: 1.3795, 1.3855, 1.3968
From the point of view of technical analysis, the trend on the USD/CAD currency pair is bullish. The price is trading at the level of moving averages. The MACD indicator has become negative, but the sellers’ pressure is weak. Under such market conditions, buy trades should be considered on the lower time frames from the support level of 1.3638 but better after confirmation. For sell deals, it is best to consider the resistance level of 1.3795, but only after additional confirmation in the form of a reverse initiative.
Alternative scenario: if the price breaks down and consolidates below the support level of 1.3619, the downtrend will likely resume.
This article reflects a personal opinion and should not be interpreted as an investment advice, and/or offer, and/or a persistent request for carrying out financial transactions, and/or a guarantee, and/or a forecast of future events.
The US stock indexes rose Friday after news that US Federal Reserve officials are discussing a 0.5% interest rate hike in November, raising hopes that the central bank may adopt a less aggressive policy. As the stock market closed on Friday, the Dow Jones Index (US30) increased by 2.47% (3.48% for the week), and the S&P 500 Index (US500) added 2.37% (2.93% for the week). The NASDAQ Technology Index (US100) jumped by 2.31% on Friday (2.69% for the week).
According to a Wall Street Journal report, some Fed officials have begun stating their desire to slow the pace of the increase soon. On Friday, San Francisco Federal Reserve President Mary Daly said it was time to start talking about slowing the pace of borrowing costs and that the Fed should be less aggressive in its rate hike cycle. Charles Evans, president of the Federal Reserve Bank of Chicago, also cited similar statements. According to Reuters calculations, speculators’ net long rates on the US dollar rose last week.
The four largest US companies by market capitalization are due to report this week. Investors are filled with optimism as corporate earnings help keep the stock market from falling amid soaring inflation and an aggressive Federal Reserve rate hike.
Stock markets in Europe were mostly down Friday, but all closed the week in positive territory. German DAX (DE30) decreased by 0.29% on Friday (+2.11% for the week), French CAC 40 (FR40) lost 0.85% (+1.44% for the week), Spanish IBEX 35 (ES35) fell by 1.29% (+1.72% for the week), British FTSE 100 (UK100) was up by 0.15% (+1.62% for the week).
Boris Johnson announced that he would not run for the Conservative Party leader and British Prime Minister post. Johnson’s announcement will pave the way for Rishi Sunak, who will likely become the next prime minister. Liz Truss was forced to resign after she launched an economic program that caused turmoil in the financial markets. Former Finance Minister Rishi Sunak earlier confirmed that he would be on the ballot, promising to handle the country’s “deep economic crisis” with “honesty, professionalism, and accountability.” Chancellor Jeremy Hunt, who is expected to remain in office under the new prime minister, said Friday that he would do “whatever is necessary” to reduce the national debt ahead of his new budget, to be announced on October 31.
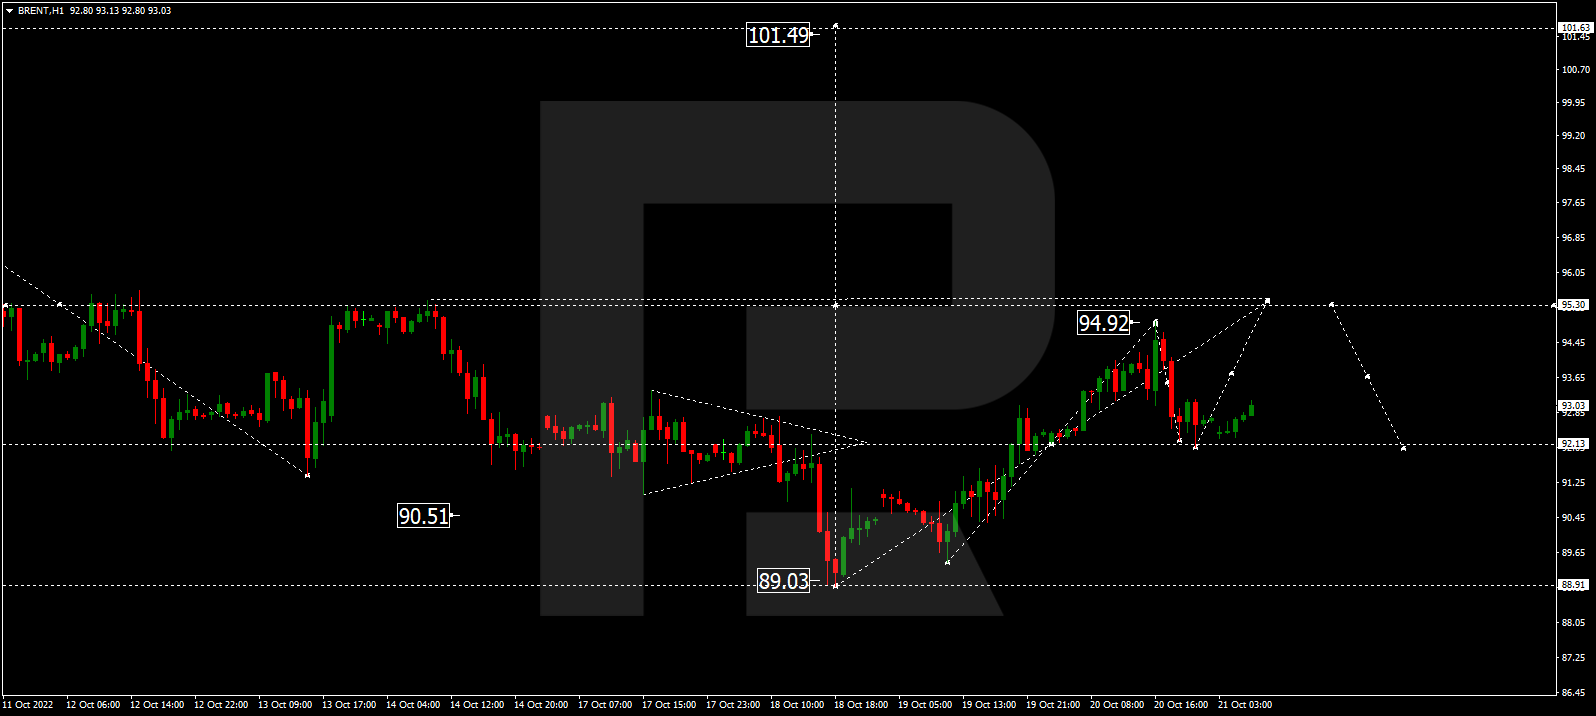
Oil prices rebounded Friday as hopes for stronger demand in China and a weaker US dollar outweighed concerns about the global economic slowdown and the impact of higher interest rates. Overall, the oil market remains uncertain as, on the one hand, OPEC+ production cuts and European sanctions against Russia for its invasion of Ukraine are keeping oil prices from falling. On the other hand, falling oil demand in the largest importer China, along with the release of strategic reserves by the US, are keeping the price down.
Chinese President Xi Jinping secured an unprecedented third presidential term and introduced a top governing body made up of loyalists, cementing his place as the country’s most powerful ruler since Mao Zedong. On Monday, China released a slew of macroeconomic statistics, the publication of which was delayed by a week because of the presidential re-election. The data indicated that China’s GDP grew by 3.9% in the last quarter, but analysts believe the numbers do not correspond to reality. China now faces a host of economic challenges, and China’s biggest concerns remain the real estate market and falling manufacturing numbers due to the new Covid lockdowns.
Japan’s promised economic stimulus should be big enough to overcome the economy’s manufacturing deficit of about 15 trillion yen ($100 billion), a top ruling party official said Sunday. On Friday, Japan’s Finance Ministry held another intervention to protect the yen from falling further. The background to such price movement is the continuing unequal monetary policy between the Bank of Japan and the Federal Reserve.
At the commodities market, futures on lumber (+8.36%), silver (+7.35%), platinum (+4.44%), and Brent oil (+2.15%) showed the biggest gains over the week. Futures on natural gas (-22.64%), cotton (-4.51%), coffee (-3.94%), cocoa (-3.2%) and sugar (-2.49%) showed the biggest drop.
S&P 500 (F) (US500) 3,752.75 +86.97 (+2.37%)
Dow Jones (US30) 31,082.56 +748.97 (+2.47%)
DAX (DE40) 12,730.90 −36.51 (−0.29%)
FTSE 100 (UK100) 6,969.73 +25.82 (+0.37%)
USD Index 111.18 −0.14 (−0.12%)
Important events for today:
– Australia Manufacturing PMI (m/m) at 01:00 (GMT+3);
– Australia Services PMI (m/m) at 01:00 (GMT+3);
– Japan Manufacturing PMI (m/m) at 03:30 (GMT+3);
– Japan Services PMI (m/m) at 03:30 (GMT+3);
– China GDP (q/q) at 05:00 (GMT+3);
– China Retail Sales (m/m) at 05:00 (GMT+3);
– China Industrial Production (m/m) at 05:00 (GMT+3);
– China Unemployment Rate (m/m) at 05:00 (GMT+3);
– China Exports (m/m) at 06:00 (GMT+3);
– China Imports (m/m) at 06:00 (GMT+3);
– French Manufacturing PMI (m/m) at 10:15 (GMT+3);
– French Services PMI (m/m) at 10:15 (GMT+3);
– German Manufacturing PMI (m/m) at 10:30 (GMT+3);
– German Services PMI (m/m) at 10:30 (GMT+3);
– Eurozone Manufacturing PMI (m/m) at 11:00 (GMT+3);
– Eurozone Services PMI (m/m) at 11:00 (GMT+3);
– UK Manufacturing PMI (m/m) at 11:30 (GMT+3);
– UK Services PMI (m/m) at 11:30 (GMT+3);
– US Manufacturing PMI (m/m) at 16:45 (GMT+3);
– US Services PMI (m/m) at 16:45 (GMT+3);
– US Treasury Secretary Yellen Speaks at 18:00 (GMT+3).
This article reflects a personal opinion and should not be interpreted as an investment advice, and/or offer, and/or a persistent request for carrying out financial transactions, and/or a guarantee, and/or a forecast of future events.
Here are the latest charts and statistics for the Commitment of Traders (COT) reports data published by the Commodities Futures Trading Commission (CFTC).
The latest COT data is updated through Tuesday October 18th and shows a quick view of how large traders (for-profit speculators and commercial entities) were positioned in the futures markets.
Sugar and Soybean Oil top Weekly Speculator Changes
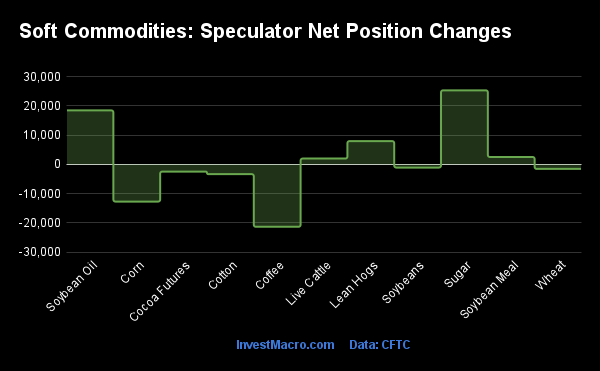
The COT soft commodities speculator bets were slightly lower this week as five out of the eleven soft commodities markets we cover had higher positioning this week while the other six markets had decreases in contracts.
Leading the gains for soft commodities markets was Sugar (25,297 contracts) with Soybean Oil (18,444 contracts), Lean Hogs (7,948 contracts), Soybean Meal (2,531 contracts) and Live Cattle (1,991 contracts) also showing positive weeks.
The softs market leading the declines in speculator bets this week was Coffee (-21,311 contracts) with Corn (-12,702 contracts), Cotton (-3,338 contracts), Cocoa (-2,468 contracts), Wheat (-1,551 contracts) and Soybeans (-1,086 contracts) also registering lower bets on the week.
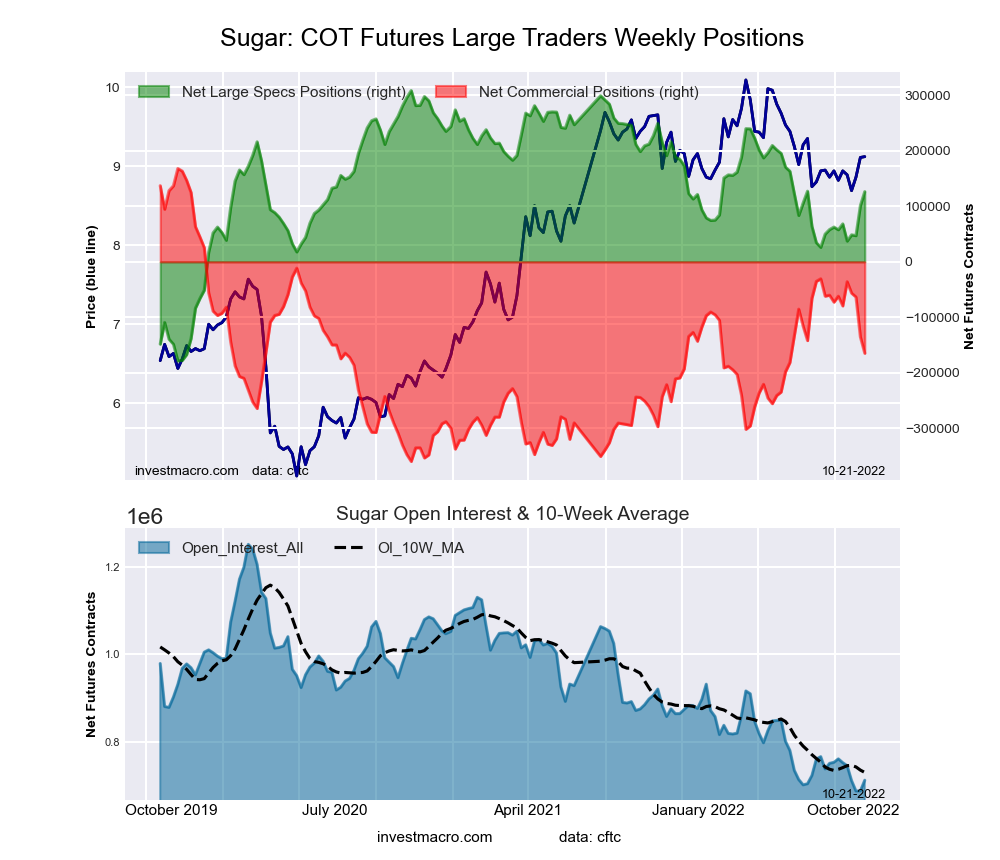
Highlighting the COT soft commodities data this week was the speculator positions in Sugar. The large speculative position for Sugar has risen sharply for two straight weeks and has advanced in seven out of the past ten weeks. This trader bullishness has brought a gain of +100,347 contracts over just the last ten-week period and pushed overall bullish standing back above the +100,000 net contract level for the first time since July.
Sugar prices and sentiment have been boosted higher by lower production numbers and higher prices out of Europe as well as Brazil this year. Prices closed this week around the 18.40 level and have been in a range between 17 and 20.70 since July of 2021.
Data Snapshot of Commodity Market Traders | Columns Legend
Oct-18-2022
OI
OI-Index
Spec-Net
Spec-Index
Com-Net
COM-Index
Smalls-Net
Smalls-Index
WTI Crude
1,454,431
0
251,545
11
-273,757
90
22,212
37
Gold
434,701
1
76,956
8
-90,030
91
13,074
12
Silver
136,055
9
1,267
15
-9,085
87
7,818
8
Copper
178,730
17
-20,302
20
19,696
82
606
29
Palladium
6,805
4
-1,209
16
1,444
82
-235
30
Platinum
53,728
11
8,494
21
-11,632
81
3,138
10
Natural Gas
963,792
3
-154,734
32
126,760
71
27,974
46
Brent
163,296
11
-41,847
41
38,681
58
3,166
52
Heating Oil
283,702
29
24,555
79
-44,031
24
19,476
66
Soybeans
714,532
30
54,683
30
-30,595
77
-24,088
30
Corn
1,419,087
22
312,419
70
-249,255
36
-63,164
7
Coffee
196,729
9
19,223
53
-21,605
52
2,382
24
Sugar
711,664
4
126,412
63
-164,671
37
38,259
55
Wheat
309,429
10
-3,541
14
10,534
75
-6,993
74
Soybean Meal leads Strength Scores
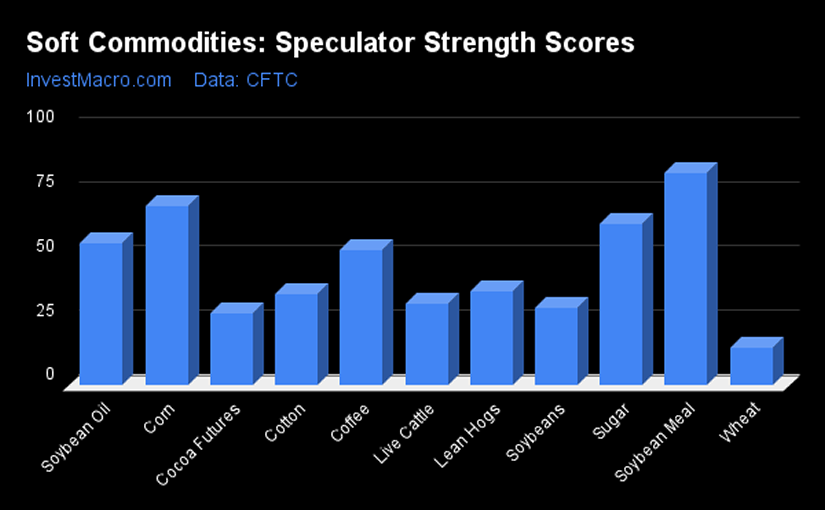
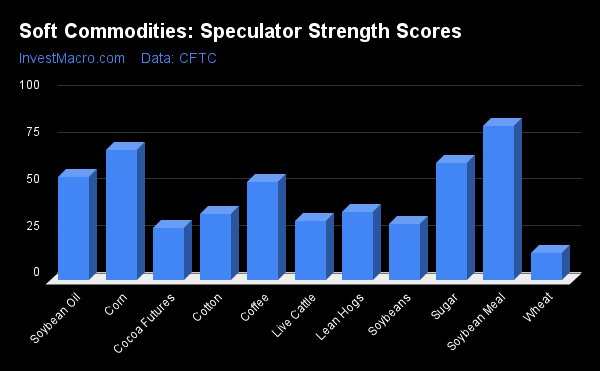
Strength Scores (a normalized measure of Speculator positions over a 3-Year range, from 0 to 100 where above 80 is extreme bullish and below 20 is extreme bearish) showed that Soybean Meal (82.7 percent) and the XXXX lead the soft commodity markets and remains in a bullish extreme position (above 80 percent). Corn (69.9 percent) and Sugar (62.5 percent) come in as the next highest soft commodity markets in strength scores.
On the downside, Wheat (14.4 percent) comes in at the lowest strength level currently and is a bearish extreme level (below 20 percent).
Strength Statistics: Corn (69.9 percent) vs Corn previous week (71.6 percent) Sugar (62.5 percent) vs Sugar previous week (57.3 percent) Coffee (52.5 percent) vs Coffee previous week (72.1 percent) Soybeans (30.2 percent) vs Soybeans previous week (30.5 percent) Soybean Oil (55.4 percent) vs Soybean Oil previous week (42.7 percent) Soybean Meal (82.7 percent) vs Soybean Meal previous week (81.3 percent) Live Cattle (31.6 percent) vs Live Cattle previous week (29.1 percent) Lean Hogs (36.3 percent) vs Lean Hogs previous week (27.6 percent) Cotton (35.3 percent) vs Cotton previous week (37.7 percent) Cocoa (27.9 percent) vs Cocoa previous week (30.4 percent) Wheat (14.4 percent) vs Wheat previous week (16.5 percent)
Strength Trends led by Soybean Oil and Sugar
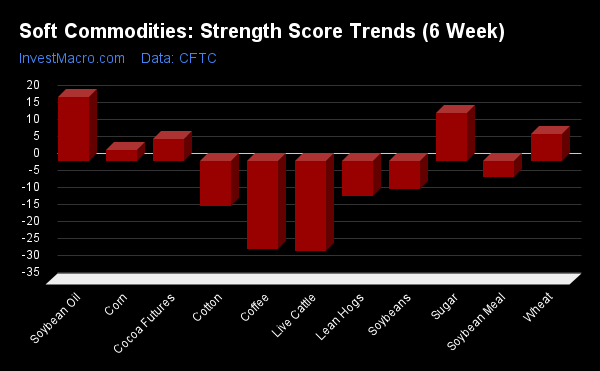
Strength Score Trends (or move index, calculates the 6-week changes in strength scores) show that Soybean Oil (18.9 percent) leads the past six weeks trends for soft commodity markets this week. Sugar (14.1 percent), Wheat (8.1 percent), Cocoa (6.7 percent) and Corn (3.3 percent) fill out the other positive movers in the latest trends data.
Live Cattle (-26.5 percent) and Coffee (-25.7 percent) lead the downside trend scores currently while the next market with lower trend scores was Cotton (-13.2 percent) followed by Lean Hogs (-10.1 percent).
Strength Trend Statistics: Corn (3.3 percent) vs Corn previous week (5.3 percent) Sugar (14.1 percent) vs Sugar previous week (7.9 percent) Coffee (-25.7 percent) vs Coffee previous week (-7.5 percent) Soybeans (-8.2 percent) vs Soybeans previous week (-8.5 percent) Soybean Oil (18.9 percent) vs Soybean Oil previous week (2.7 percent) Soybean Meal (-4.5 percent) vs Soybean Meal previous week (-10.9 percent) Live Cattle (-26.5 percent) vs Live Cattle previous week (-25.2 percent) Lean Hogs (-10.1 percent) vs Lean Hogs previous week (-26.2 percent) Cotton (-13.2 percent) vs Cotton previous week (-11.6 percent) Cocoa (6.7 percent) vs Cocoa previous week (5.3 percent) Wheat (8.1 percent) vs Wheat previous week (12.4 percent)
Individual Soft Commodities Markets:
CORN Futures:
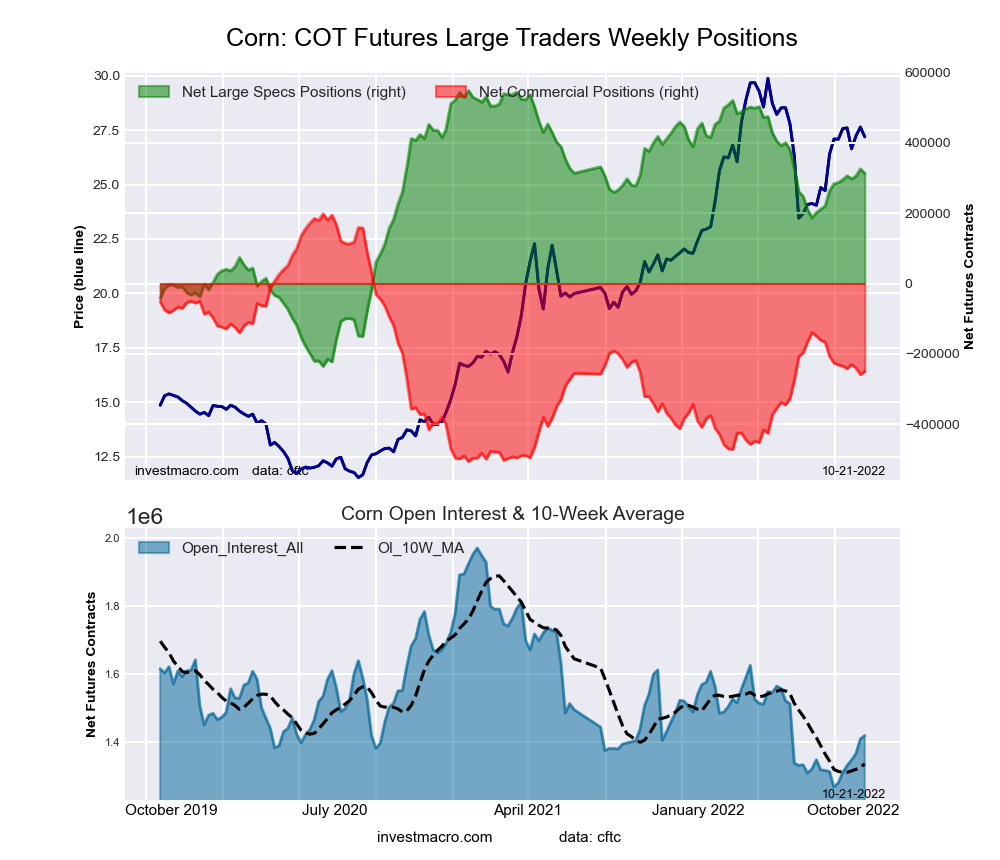
The CORN large speculator standing this week came in at a net position of 312,419 contracts in the data reported through Tuesday. This was a weekly decline of -12,702 contracts from the previous week which had a total of 325,121 net contracts.
This week’s current strength score (the trader positioning range over the past three years, measured from 0 to 100) shows the speculators are currently Bullish with a score of 69.9 percent. The commercials are Bearish with a score of 36.4 percent and the small traders (not shown in chart) are Bearish-Extreme with a score of 6.7 percent.
CORN Futures Statistics
SPECULATORS
COMMERCIALS
SMALL TRADERS
– Percent of Open Interest Longs:
30.9
44.8
8.9
– Percent of Open Interest Shorts:
8.8
62.3
13.3
– Net Position:
312,419
-249,255
-63,164
– Gross Longs:
437,906
635,253
126,283
– Gross Shorts:
125,487
884,508
189,447
– Long to Short Ratio:
3.5 to 1
0.7 to 1
0.7 to 1
NET POSITION TREND:
– Strength Index Score (3 Year Range Pct):
69.9
36.4
6.7
– Strength Index Reading (3 Year Range):
Bullish
Bearish
Bearish-Extreme
NET POSITION MOVEMENT INDEX:
– 6-Week Change in Strength Index:
3.3
-2.6
-4.2
SUGAR Futures:
The SUGAR large speculator standing this week came in at a net position of 126,412 contracts in the data reported through Tuesday. This was a weekly increase of 25,297 contracts from the previous week which had a total of 101,115 net contracts.
This week’s current strength score (the trader positioning range over the past three years, measured from 0 to 100) shows the speculators are currently Bullish with a score of 62.5 percent. The commercials are Bearish with a score of 37.3 percent and the small traders (not shown in chart) are Bullish with a score of 55.2 percent.
SUGAR Futures Statistics
SPECULATORS
COMMERCIALS
SMALL TRADERS
– Percent of Open Interest Longs:
28.9
48.1
11.8
– Percent of Open Interest Shorts:
11.1
71.2
6.4
– Net Position:
126,412
-164,671
38,259
– Gross Longs:
205,568
342,150
83,657
– Gross Shorts:
79,156
506,821
45,398
– Long to Short Ratio:
2.6 to 1
0.7 to 1
1.8 to 1
NET POSITION TREND:
– Strength Index Score (3 Year Range Pct):
62.5
37.3
55.2
– Strength Index Reading (3 Year Range):
Bullish
Bearish
Bullish
NET POSITION MOVEMENT INDEX:
– 6-Week Change in Strength Index:
14.1
-19.6
42.1
COFFEE Futures:
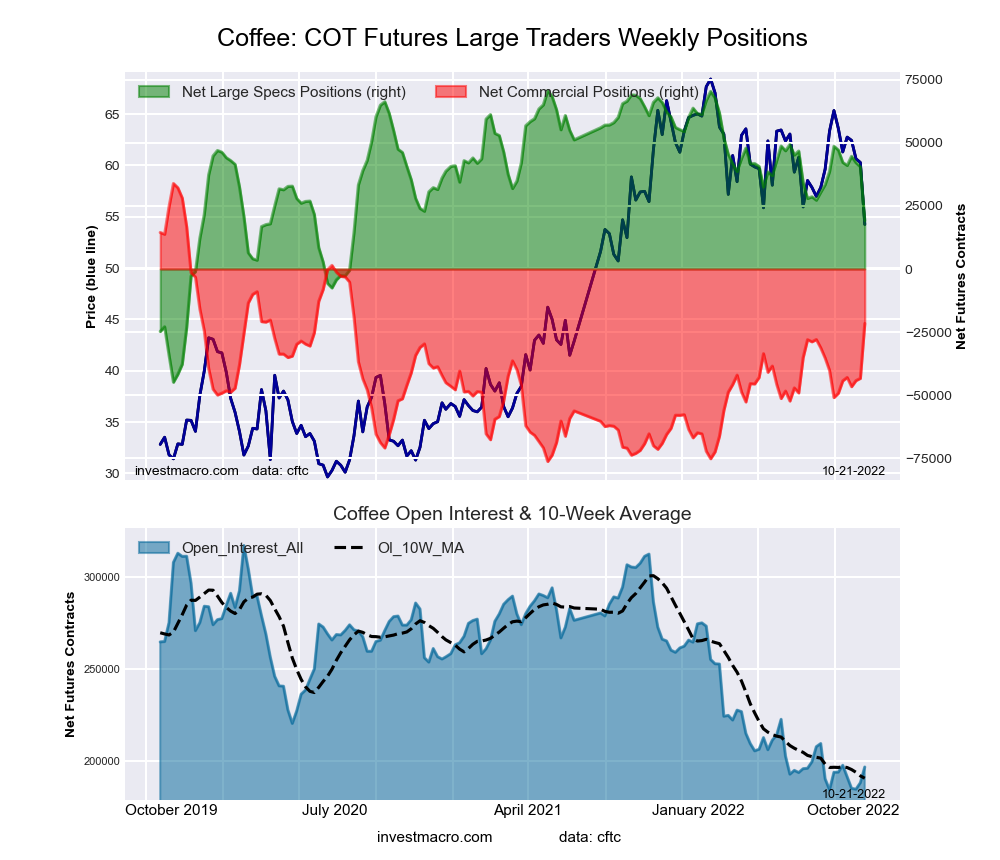
The COFFEE large speculator standing this week came in at a net position of 19,223 contracts in the data reported through Tuesday. This was a weekly reduction of -21,311 contracts from the previous week which had a total of 40,534 net contracts.
This week’s current strength score (the trader positioning range over the past three years, measured from 0 to 100) shows the speculators are currently Bullish with a score of 52.5 percent. The commercials are Bullish with a score of 52.4 percent and the small traders (not shown in chart) are Bearish with a score of 24.4 percent.
COFFEE Futures Statistics
SPECULATORS
COMMERCIALS
SMALL TRADERS
– Percent of Open Interest Longs:
20.9
51.5
4.6
– Percent of Open Interest Shorts:
11.1
62.4
3.4
– Net Position:
19,223
-21,605
2,382
– Gross Longs:
41,151
101,222
9,017
– Gross Shorts:
21,928
122,827
6,635
– Long to Short Ratio:
1.9 to 1
0.8 to 1
1.4 to 1
NET POSITION TREND:
– Strength Index Score (3 Year Range Pct):
52.5
52.4
24.4
– Strength Index Reading (3 Year Range):
Bullish
Bullish
Bearish
NET POSITION MOVEMENT INDEX:
– 6-Week Change in Strength Index:
-25.7
26.5
2.9
SOYBEANS Futures:
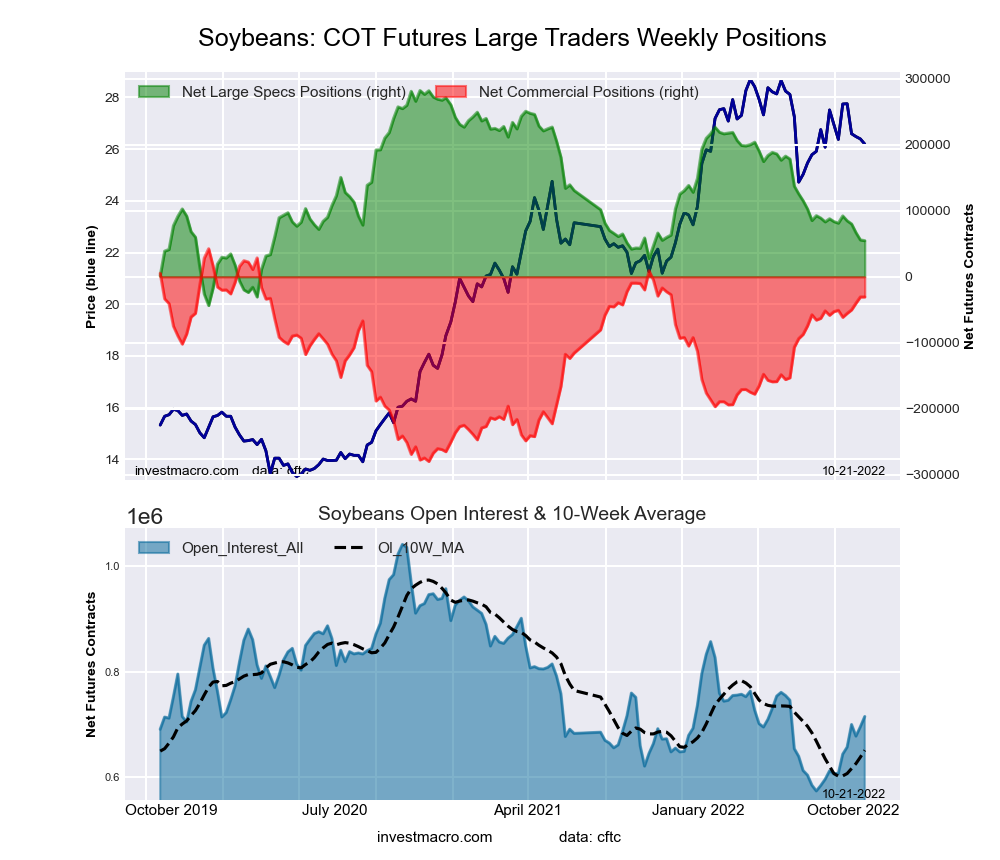
The SOYBEANS large speculator standing this week came in at a net position of 54,683 contracts in the data reported through Tuesday. This was a weekly lowering of -1,086 contracts from the previous week which had a total of 55,769 net contracts.
This week’s current strength score (the trader positioning range over the past three years, measured from 0 to 100) shows the speculators are currently Bearish with a score of 30.2 percent. The commercials are Bullish with a score of 77.3 percent and the small traders (not shown in chart) are Bearish with a score of 30.4 percent.
SOYBEANS Futures Statistics
SPECULATORS
COMMERCIALS
SMALL TRADERS
– Percent of Open Interest Longs:
18.5
54.5
7.1
– Percent of Open Interest Shorts:
10.8
58.8
10.5
– Net Position:
54,683
-30,595
-24,088
– Gross Longs:
132,144
389,695
50,829
– Gross Shorts:
77,461
420,290
74,917
– Long to Short Ratio:
1.7 to 1
0.9 to 1
0.7 to 1
NET POSITION TREND:
– Strength Index Score (3 Year Range Pct):
30.2
77.3
30.4
– Strength Index Reading (3 Year Range):
Bearish
Bullish
Bearish
NET POSITION MOVEMENT INDEX:
– 6-Week Change in Strength Index:
-8.2
6.3
10.7
SOYBEAN OIL Futures:
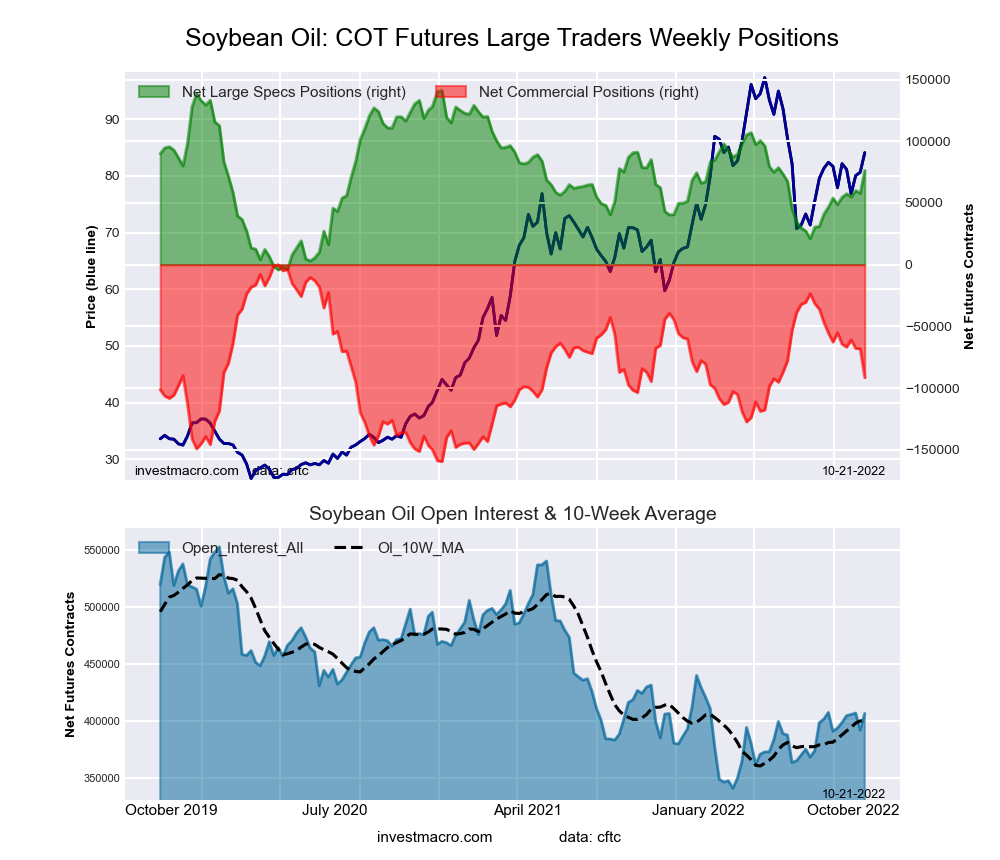
The SOYBEAN OIL large speculator standing this week came in at a net position of 76,323 contracts in the data reported through Tuesday. This was a weekly boost of 18,444 contracts from the previous week which had a total of 57,879 net contracts.
This week’s current strength score (the trader positioning range over the past three years, measured from 0 to 100) shows the speculators are currently Bullish with a score of 55.4 percent. The commercials are Bearish with a score of 42.7 percent and the small traders (not shown in chart) are Bullish with a score of 70.2 percent.
SOYBEAN OIL Futures Statistics
SPECULATORS
COMMERCIALS
SMALL TRADERS
– Percent of Open Interest Longs:
26.0
45.1
9.1
– Percent of Open Interest Shorts:
7.2
67.6
5.3
– Net Position:
76,323
-91,542
15,219
– Gross Longs:
105,679
183,264
36,918
– Gross Shorts:
29,356
274,806
21,699
– Long to Short Ratio:
3.6 to 1
0.7 to 1
1.7 to 1
NET POSITION TREND:
– Strength Index Score (3 Year Range Pct):
55.4
42.7
70.2
– Strength Index Reading (3 Year Range):
Bullish
Bearish
Bullish
NET POSITION MOVEMENT INDEX:
– 6-Week Change in Strength Index:
18.9
-22.8
33.0
SOYBEAN MEAL Futures:
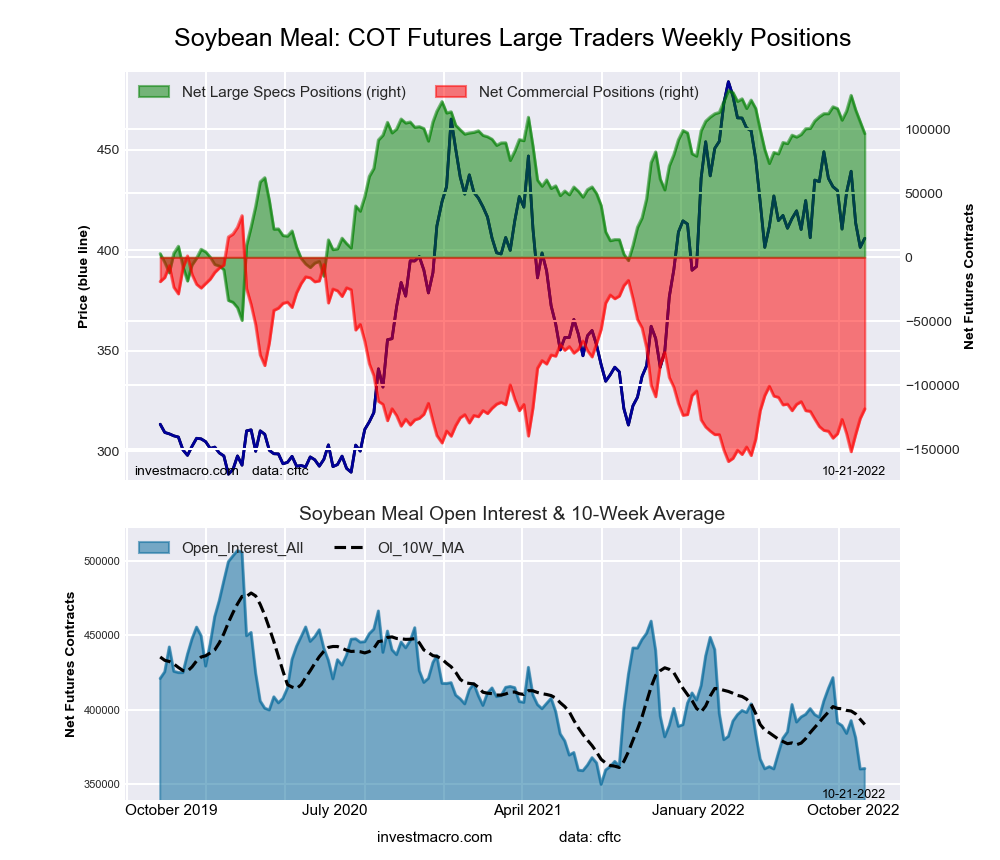
The SOYBEAN MEAL large speculator standing this week came in at a net position of 99,132 contracts in the data reported through Tuesday. This was a weekly boost of 2,531 contracts from the previous week which had a total of 96,601 net contracts.
This week’s current strength score (the trader positioning range over the past three years, measured from 0 to 100) shows the speculators are currently Bullish-Extreme with a score of 82.7 percent. The commercials are Bearish-Extreme with a score of 19.5 percent and the small traders (not shown in chart) are Bullish with a score of 52.0 percent.
SOYBEAN MEAL Futures Statistics
SPECULATORS
COMMERCIALS
SMALL TRADERS
– Percent of Open Interest Longs:
32.1
41.0
13.0
– Percent of Open Interest Shorts:
5.5
73.8
6.9
– Net Position:
99,132
-122,110
22,978
– Gross Longs:
119,484
152,664
48,567
– Gross Shorts:
20,352
274,774
25,589
– Long to Short Ratio:
5.9 to 1
0.6 to 1
1.9 to 1
NET POSITION TREND:
– Strength Index Score (3 Year Range Pct):
82.7
19.5
52.0
– Strength Index Reading (3 Year Range):
Bullish-Extreme
Bearish-Extreme
Bullish
NET POSITION MOVEMENT INDEX:
– 6-Week Change in Strength Index:
-4.5
2.4
17.9
LIVE CATTLE Futures:
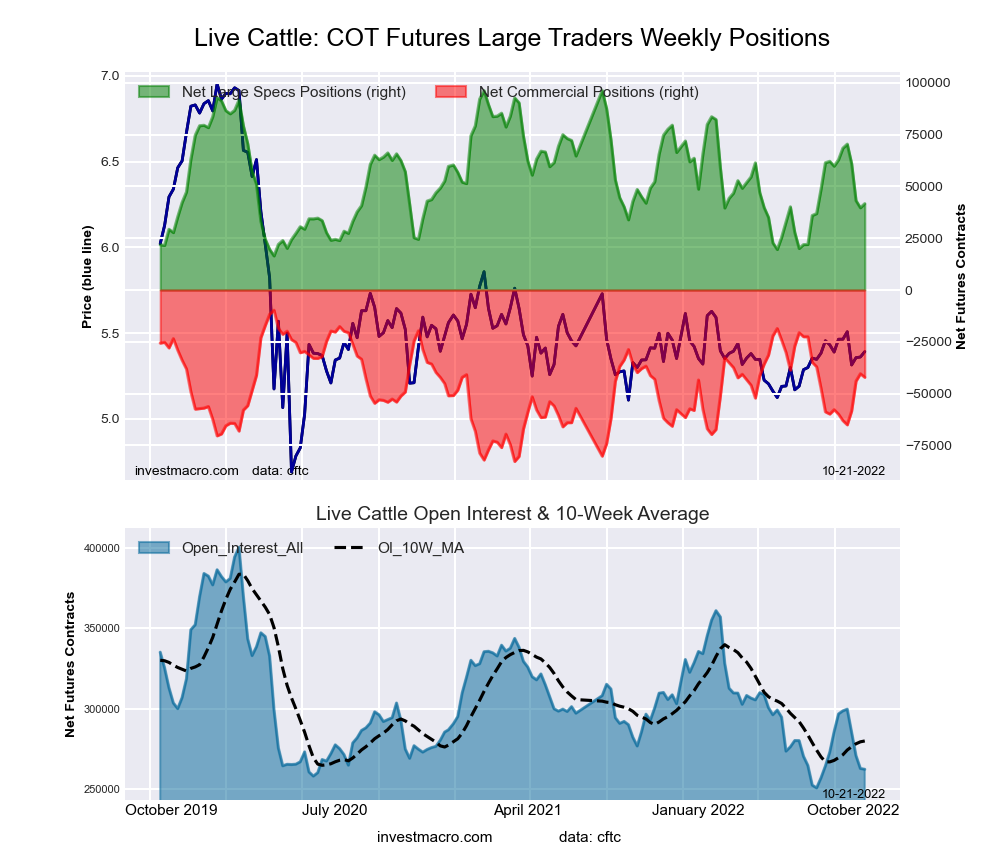
The LIVE CATTLE large speculator standing this week came in at a net position of 41,656 contracts in the data reported through Tuesday. This was a weekly gain of 1,991 contracts from the previous week which had a total of 39,665 net contracts.
This week’s current strength score (the trader positioning range over the past three years, measured from 0 to 100) shows the speculators are currently Bearish with a score of 31.6 percent. The commercials are Bullish with a score of 55.6 percent and the small traders (not shown in chart) are Bullish-Extreme with a score of 98.4 percent.
LIVE CATTLE Futures Statistics
SPECULATORS
COMMERCIALS
SMALL TRADERS
– Percent of Open Interest Longs:
32.4
36.3
12.7
– Percent of Open Interest Shorts:
16.5
52.4
12.5
– Net Position:
41,656
-42,115
459
– Gross Longs:
85,057
95,288
33,243
– Gross Shorts:
43,401
137,403
32,784
– Long to Short Ratio:
2.0 to 1
0.7 to 1
1.0 to 1
NET POSITION TREND:
– Strength Index Score (3 Year Range Pct):
31.6
55.6
98.4
– Strength Index Reading (3 Year Range):
Bearish
Bullish
Bullish-Extreme
NET POSITION MOVEMENT INDEX:
– 6-Week Change in Strength Index:
-26.5
24.4
13.9
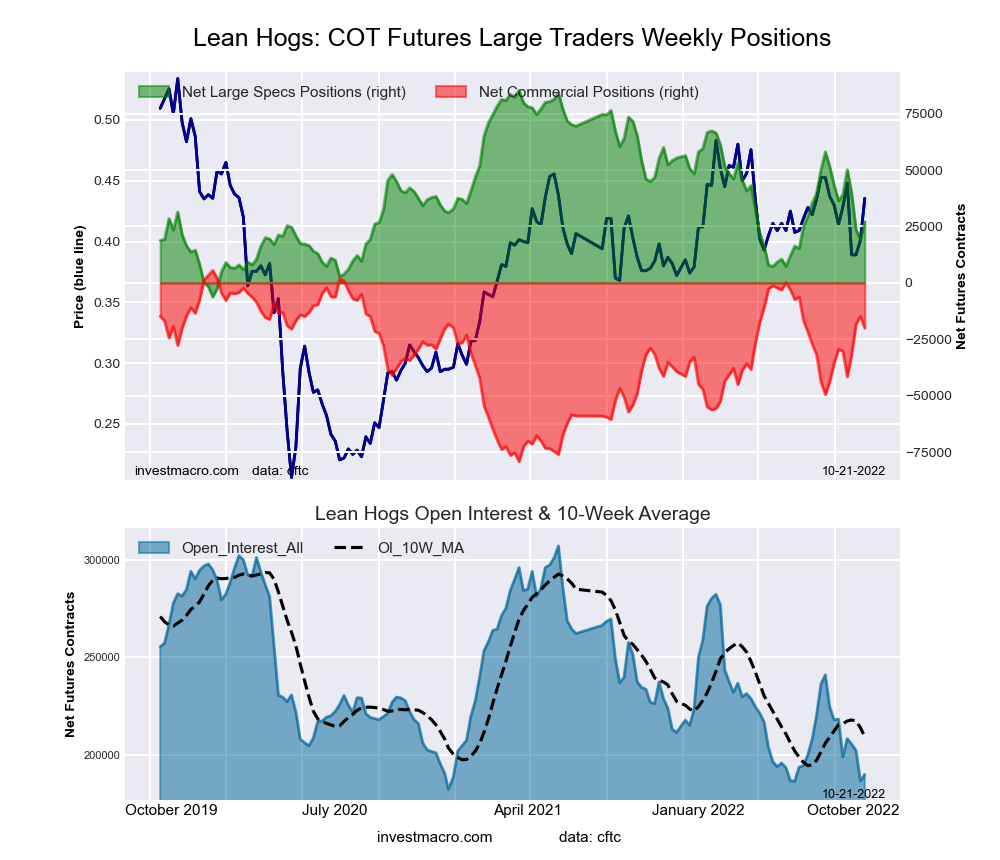
LEAN HOGS Futures:
The LEAN HOGS large speculator standing this week came in at a net position of 27,089 contracts in the data reported through Tuesday. This was a weekly advance of 7,948 contracts from the previous week which had a total of 19,141 net contracts.
This week’s current strength score (the trader positioning range over the past three years, measured from 0 to 100) shows the speculators are currently Bearish with a score of 36.3 percent. The commercials are Bullish with a score of 69.8 percent and the small traders (not shown in chart) are Bullish with a score of 59.7 percent.
LEAN HOGS Futures Statistics
SPECULATORS
COMMERCIALS
SMALL TRADERS
– Percent of Open Interest Longs:
37.4
36.6
10.0
– Percent of Open Interest Shorts:
23.1
47.2
13.7
– Net Position:
27,089
-19,993
-7,096
– Gross Longs:
70,919
69,501
18,957
– Gross Shorts:
43,830
89,494
26,053
– Long to Short Ratio:
1.6 to 1
0.8 to 1
0.7 to 1
NET POSITION TREND:
– Strength Index Score (3 Year Range Pct):
36.3
69.8
59.7
– Strength Index Reading (3 Year Range):
Bearish
Bullish
Bullish
NET POSITION MOVEMENT INDEX:
– 6-Week Change in Strength Index:
-10.1
11.1
-0.8
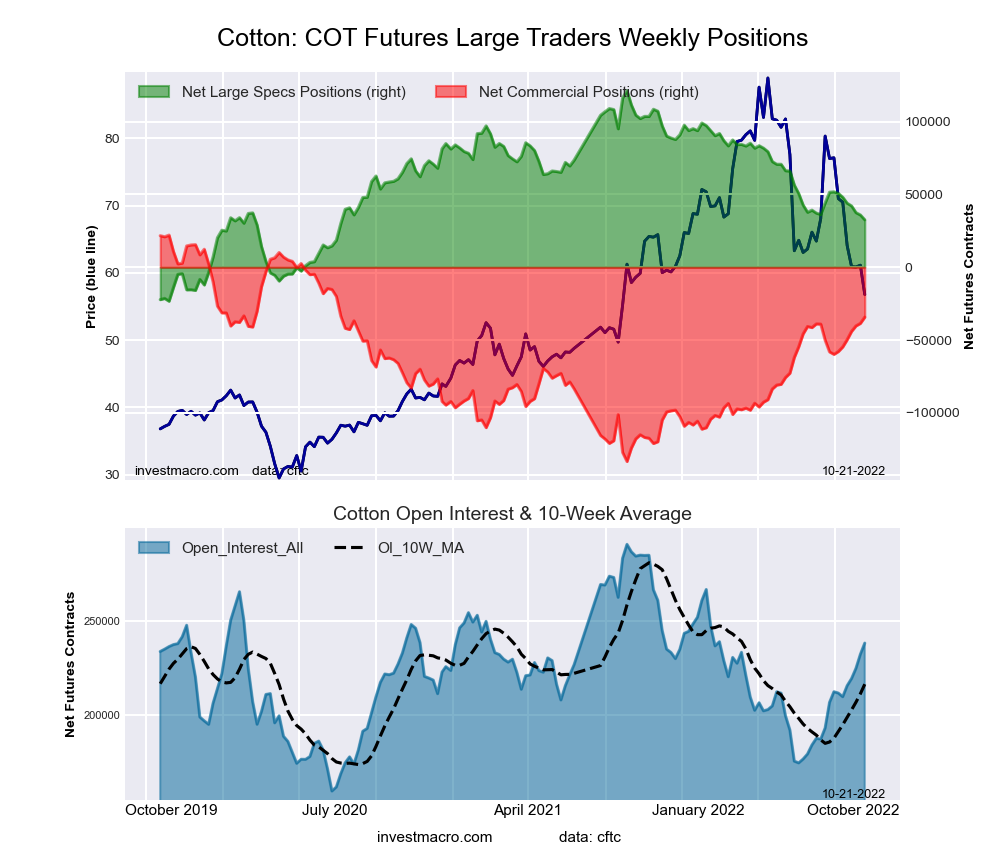
COTTON Futures:
The COTTON large speculator standing this week came in at a net position of 32,563 contracts in the data reported through Tuesday. This was a weekly reduction of -3,338 contracts from the previous week which had a total of 35,901 net contracts.
This week’s current strength score (the trader positioning range over the past three years, measured from 0 to 100) shows the speculators are currently Bearish with a score of 35.3 percent. The commercials are Bullish with a score of 66.6 percent and the small traders (not shown in chart) are Bearish with a score of 21.1 percent.
COTTON Futures Statistics
SPECULATORS
COMMERCIALS
SMALL TRADERS
– Percent of Open Interest Longs:
29.9
50.2
5.4
– Percent of Open Interest Shorts:
16.3
64.5
4.7
– Net Position:
32,563
-34,238
1,675
– Gross Longs:
71,299
119,480
12,911
– Gross Shorts:
38,736
153,718
11,236
– Long to Short Ratio:
1.8 to 1
0.8 to 1
1.1 to 1
NET POSITION TREND:
– Strength Index Score (3 Year Range Pct):
35.3
66.6
21.1
– Strength Index Reading (3 Year Range):
Bearish
Bullish
Bearish
NET POSITION MOVEMENT INDEX:
– 6-Week Change in Strength Index:
-13.2
15.9
-35.4
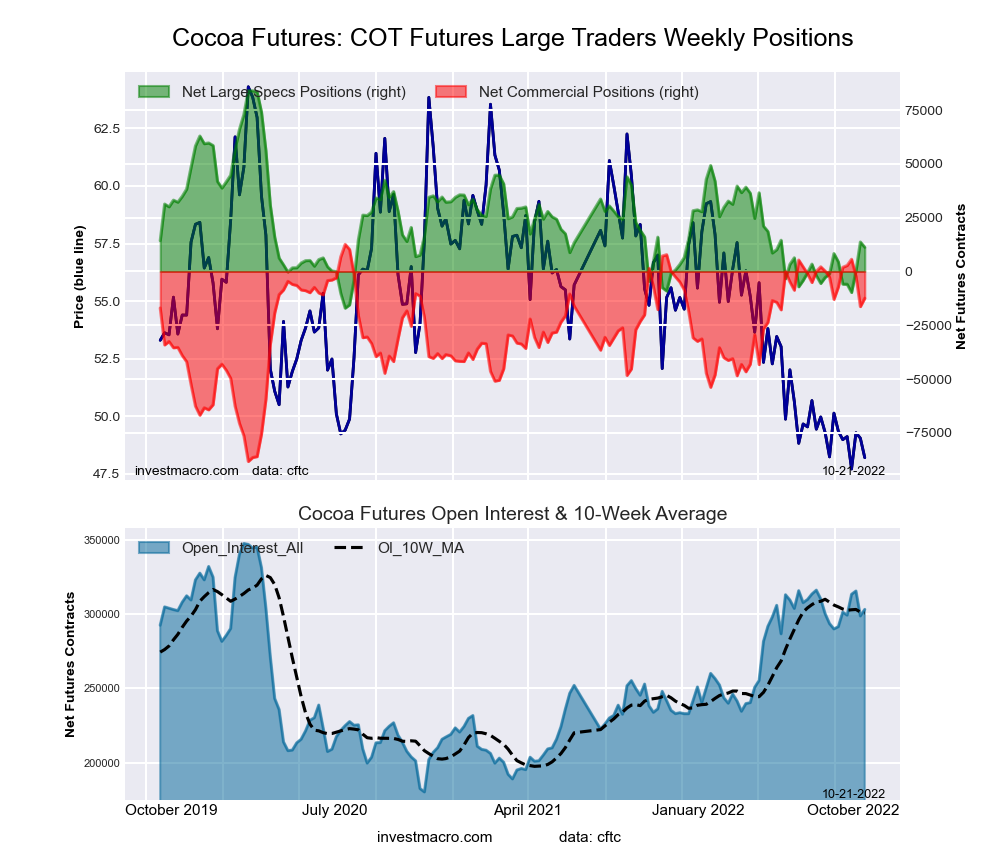
COCOA Futures:
The COCOA large speculator standing this week came in at a net position of 11,218 contracts in the data reported through Tuesday. This was a weekly fall of -2,468 contracts from the previous week which had a total of 13,686 net contracts.
This week’s current strength score (the trader positioning range over the past three years, measured from 0 to 100) shows the speculators are currently Bearish with a score of 27.9 percent. The commercials are Bullish with a score of 75.2 percent and the small traders (not shown in chart) are Bearish-Extreme with a score of 8.7 percent.
COCOA Futures Statistics
SPECULATORS
COMMERCIALS
SMALL TRADERS
– Percent of Open Interest Longs:
31.7
46.2
4.0
– Percent of Open Interest Shorts:
28.0
50.3
3.6
– Net Position:
11,218
-12,445
1,227
– Gross Longs:
95,953
140,015
12,138
– Gross Shorts:
84,735
152,460
10,911
– Long to Short Ratio:
1.1 to 1
0.9 to 1
1.1 to 1
NET POSITION TREND:
– Strength Index Score (3 Year Range Pct):
27.9
75.2
8.7
– Strength Index Reading (3 Year Range):
Bearish
Bullish
Bearish-Extreme
NET POSITION MOVEMENT INDEX:
– 6-Week Change in Strength Index:
6.7
-5.2
-15.4
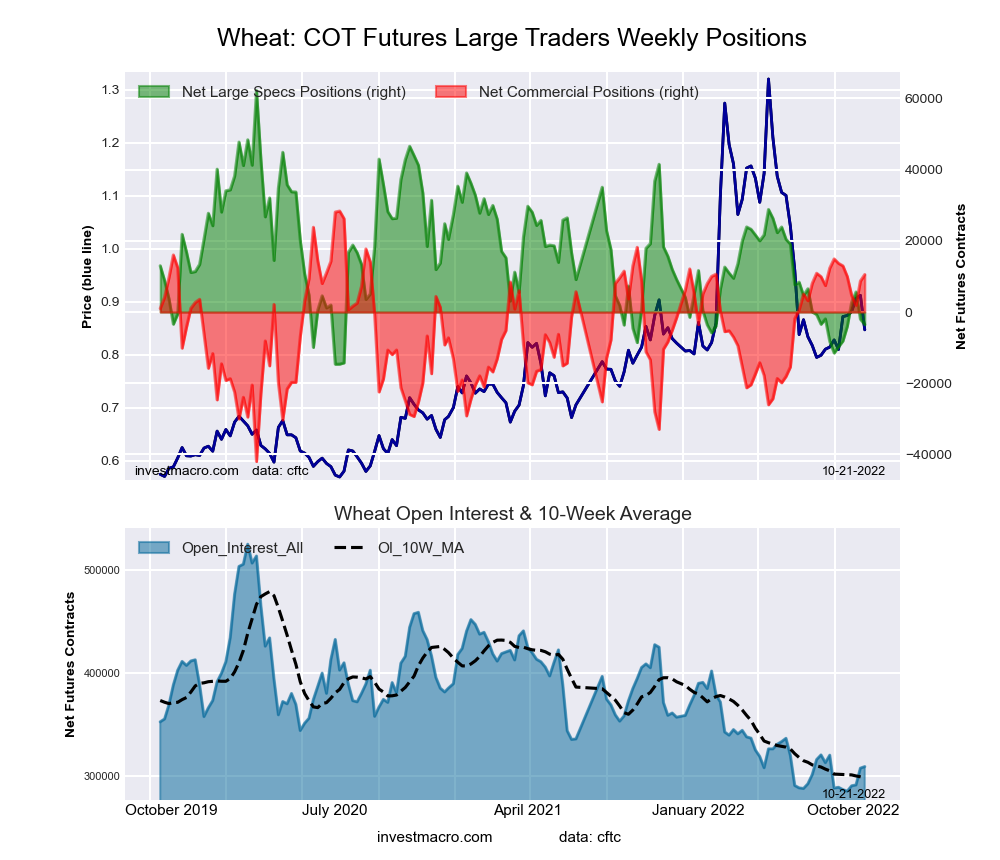
WHEAT Futures:
The WHEAT large speculator standing this week came in at a net position of -3,541 contracts in the data reported through Tuesday. This was a weekly reduction of -1,551 contracts from the previous week which had a total of -1,990 net contracts.
This week’s current strength score (the trader positioning range over the past three years, measured from 0 to 100) shows the speculators are currently Bearish-Extreme with a score of 14.4 percent. The commercials are Bullish with a score of 74.6 percent and the small traders (not shown in chart) are Bullish with a score of 74.1 percent.
WHEAT Futures Statistics
SPECULATORS
COMMERCIALS
SMALL TRADERS
– Percent of Open Interest Longs:
27.8
40.6
8.7
– Percent of Open Interest Shorts:
28.9
37.2
10.9
– Net Position:
-3,541
10,534
-6,993
– Gross Longs:
86,038
125,771
26,783
– Gross Shorts:
89,579
115,237
33,776
– Long to Short Ratio:
1.0 to 1
1.1 to 1
0.8 to 1
NET POSITION TREND:
– Strength Index Score (3 Year Range Pct):
14.4
74.6
74.1
– Strength Index Reading (3 Year Range):
Bearish-Extreme
Bullish
Bullish
NET POSITION MOVEMENT INDEX:
– 6-Week Change in Strength Index:
8.1
-4.5
-16.0
Article By InvestMacro – Receive our weekly COT Newsletter
*COT Report: The COT data, released weekly to the public each Friday, is updated through the most recent Tuesday (data is 3 days old) and shows a quick view of how large speculators or non-commercials (for-profit traders) were positioned in the futures markets.
The CFTC categorizes trader positions according to commercial hedgers (traders who use futures contracts for hedging as part of the business), non-commercials (large traders who speculate to realize trading profits) and nonreportable traders (usually small traders/speculators) as well as their open interest (contracts open in the market at time of reporting). See CFTC criteria here.
The latest COT data is updated through Tuesday October 18th and shows a quick view of how large traders (for-profit speculators and commercial hedgers) were positioned in the futures markets.
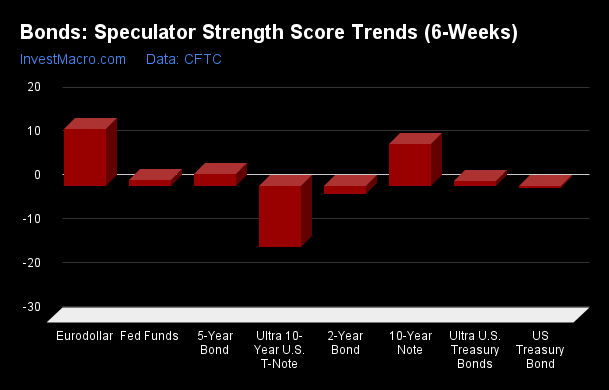
Eurodollar, Fed Funds & 10-Year lead Weekly Speculator Changes
The COTbond market speculator bets were evenly mixed this week as four out of the eight bond markets we cover had higher positioning this week while four markets had lower contracts.
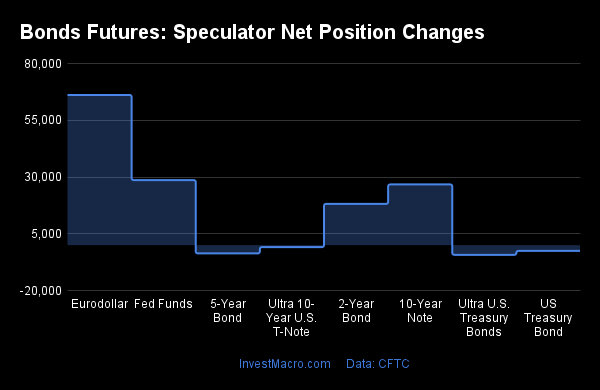
Leading the weekly gains for the bond markets was the Eurodollar (66,141 contracts) with the Fed Funds (28,633 contracts), the 10-Year Bond (26,725 contracts) and the 2-Year Bond (18,174 contracts) also showing a positive week.
The bond markets leading the weekly declines in speculator bets this week was the Ultra US Bond (-4,286 contracts) with the 5-Year Bond (-3,657 contracts), the Long US Bond (-2,547 contracts) and the Ultra 10-Year (-880 contracts) also registering lower bets on the week.
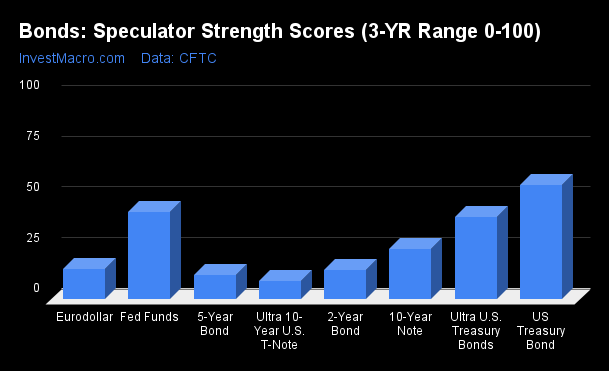
Strength Scores (a normalized measure of Speculator positions over a 3-Year range, from 0 to 100 where above 80 is extreme bullish and below 20 is extreme bearish) showed that the US Treasury Bond (56.5 percent) leads the bonds category for the week and is the only market above 50 percent or above the 3-Year midpoint.
On the downside, the Ultra 10-Year Bond (8.9 percent), 5-Year Bond (11.8 percent), 2-Year Bond (14.5 percent) and the Eurodollar (14.9 percent) came in at the lowest strength levels and are all in extreme bearish levels (below 20 percent).
Strength Statistics: Fed Funds (43.3 percent) vs Fed Funds previous week (39.7 percent) 2-Year Bond (14.5 percent) vs 2-Year Bond previous week (10.8 percent) 5-Year Bond (11.8 percent) vs 5-Year Bond previous week (12.3 percent) 10-Year Bond (24.8 percent) vs 10-Year Bond previous week (20.7 percent) Ultra 10-Year Bond (8.9 percent) vs Ultra 10-Year Bond previous week (9.1 percent) US Treasury Bond (56.5 percent) vs US Treasury Bond previous week (57.3 percent) Ultra US Treasury Bond (40.6 percent) vs Ultra US Treasury Bond previous week (42.3 percent) Eurodollar (14.9 percent) vs Eurodollar previous week (13.7 percent)
Eurodollar & 10-Year Bond top the Strength Trends
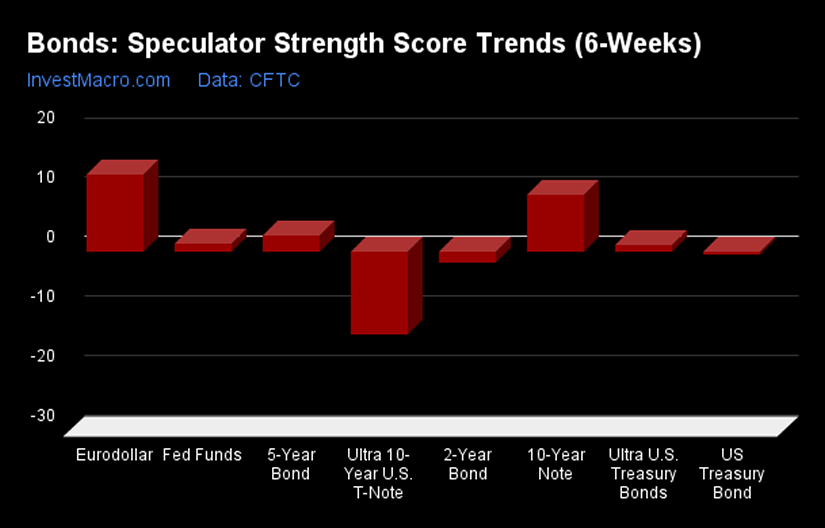
Strength Score Trends (or move index, calculates the 6-week changes in strength scores) showed that the Eurodollar (13.0 percent) leads the past six weeks trends for bonds this week. The 10-Year Bond (9.6 percent), the 5-Year Bond (2.8 percent), Fed Funds (1.3 percent) and the Ultra US Treasury Bond (1.2 percent) fill out the other positive movers in the latest trends data.
The Ultra 10-Year Bond (-14.0 percent) leads the downside trend scores currently while the next markets with lower trend scores were the 2-Year Bond (-1.8 percent) and the US Treasury Bond (-0.4 percent).
Strength Trend Statistics: Fed Funds (1.3 percent) vs Fed Funds previous week (-10.4 percent) 2-Year Bond (-1.8 percent) vs 2-Year Bond previous week (-14.6 percent) 5-Year Bond (2.8 percent) vs 5-Year Bond previous week (12.3 percent) 10-Year Bond (9.6 percent) vs 10-Year Bond previous week (15.2 percent) Ultra 10-Year Bond (-14.0 percent) vs Ultra 10-Year Bond previous week (-15.0 percent) US Treasury Bond (-0.4 percent) vs US Treasury Bond previous week (-4.9 percent) Ultra US Treasury Bond (1.2 percent) vs Ultra US Treasury Bond previous week (2.3 percent) Eurodollar (13.0 percent) vs Eurodollar previous week (13.2 percent)
Individual Bond Markets:
3-Month Eurodollars Futures:
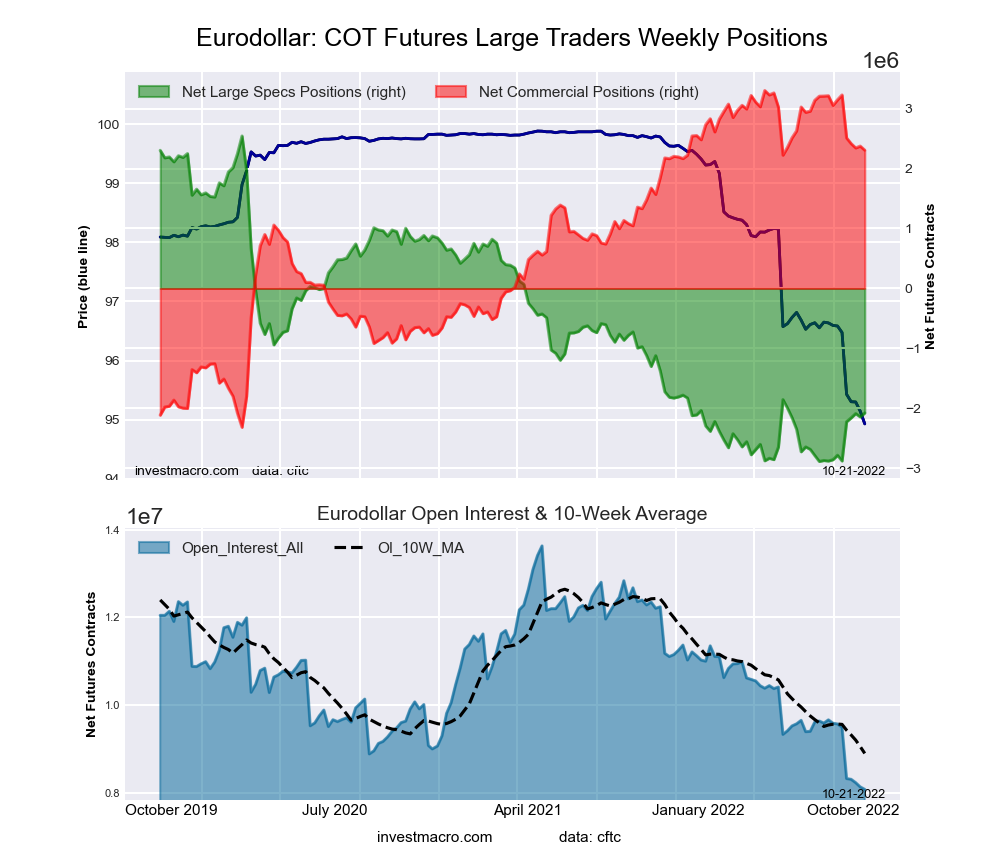
The 3-Month Eurodollars large speculator standing this week came in at a net position of -2,077,075 contracts in the data reported through Tuesday. This was a weekly lift of 66,141 contracts from the previous week which had a total of -2,143,216 net contracts.
This week’s current strength score (the trader positioning range over the past three years, measured from 0 to 100) shows the speculators are currently Bearish-Extreme with a score of 14.9 percent. The commercials are Bullish-Extreme with a score of 82.3 percent and the small traders (not shown in chart) are Bullish with a score of 54.1 percent.
3-Month Eurodollars Statistics
SPECULATORS
COMMERCIALS
SMALL TRADERS
– Percent of Open Interest Longs:
8.1
68.5
4.8
– Percent of Open Interest Shorts:
33.9
40.0
7.6
– Net Position:
-2,077,075
2,305,875
-228,800
– Gross Longs:
657,218
5,533,303
387,561
– Gross Shorts:
2,734,293
3,227,428
616,361
– Long to Short Ratio:
0.2 to 1
1.7 to 1
0.6 to 1
NET POSITION TREND:
– Strength Index Score (3 Year Range Pct):
14.9
82.3
54.1
– Strength Index Reading (3 Year Range):
Bearish-Extreme
Bullish-Extreme
Bullish
NET POSITION MOVEMENT INDEX:
– 6-Week Change in Strength Index:
13.0
-15.0
29.8
30-Day Federal Funds Futures:
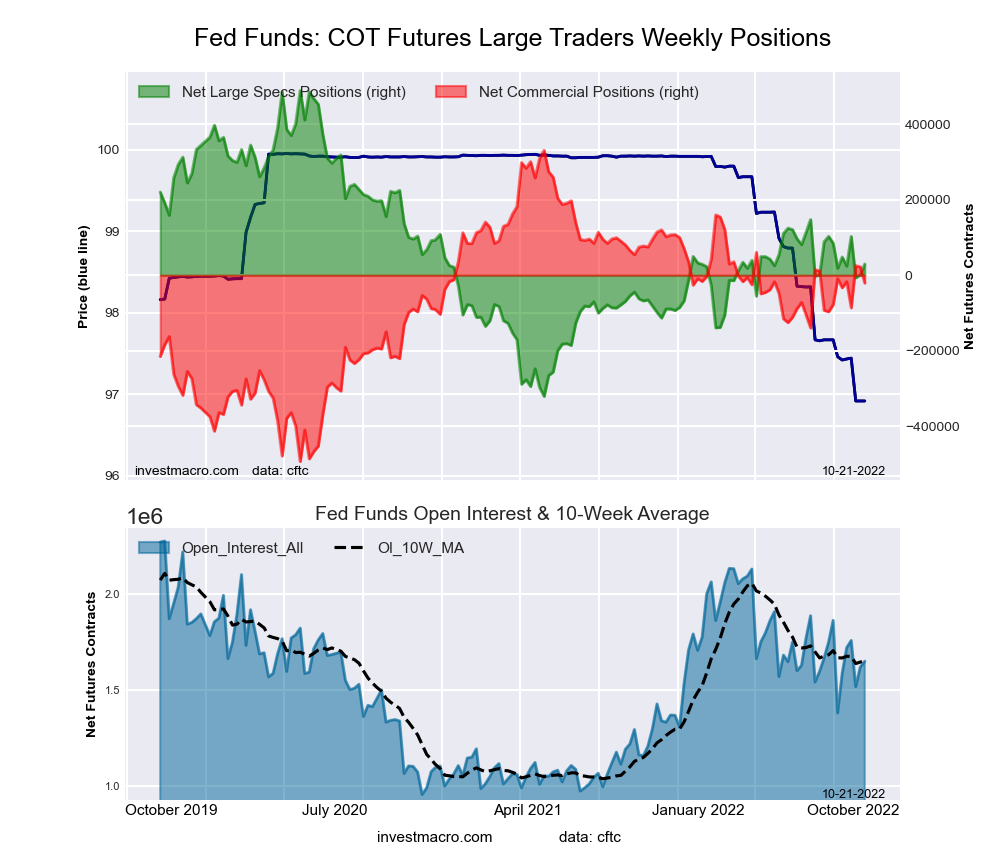
The 30-Day Federal Funds large speculator standing this week came in at a net position of 29,521 contracts in the data reported through Tuesday. This was a weekly lift of 28,633 contracts from the previous week which had a total of 888 net contracts.
This week’s current strength score (the trader positioning range over the past three years, measured from 0 to 100) shows the speculators are currently Bearish with a score of 43.3 percent. The commercials are Bullish with a score of 57.4 percent and the small traders (not shown in chart) are Bearish with a score of 37.5 percent.
30-Day Federal Funds Statistics
SPECULATORS
COMMERCIALS
SMALL TRADERS
– Percent of Open Interest Longs:
13.4
71.3
1.8
– Percent of Open Interest Shorts:
11.6
72.5
2.3
– Net Position:
29,521
-20,827
-8,694
– Gross Longs:
220,365
1,175,230
29,854
– Gross Shorts:
190,844
1,196,057
38,548
– Long to Short Ratio:
1.2 to 1
1.0 to 1
0.8 to 1
NET POSITION TREND:
– Strength Index Score (3 Year Range Pct):
43.3
57.4
37.5
– Strength Index Reading (3 Year Range):
Bearish
Bullish
Bearish
NET POSITION MOVEMENT INDEX:
– 6-Week Change in Strength Index:
1.3
-1.4
2.1
2-Year Treasury Note Futures:
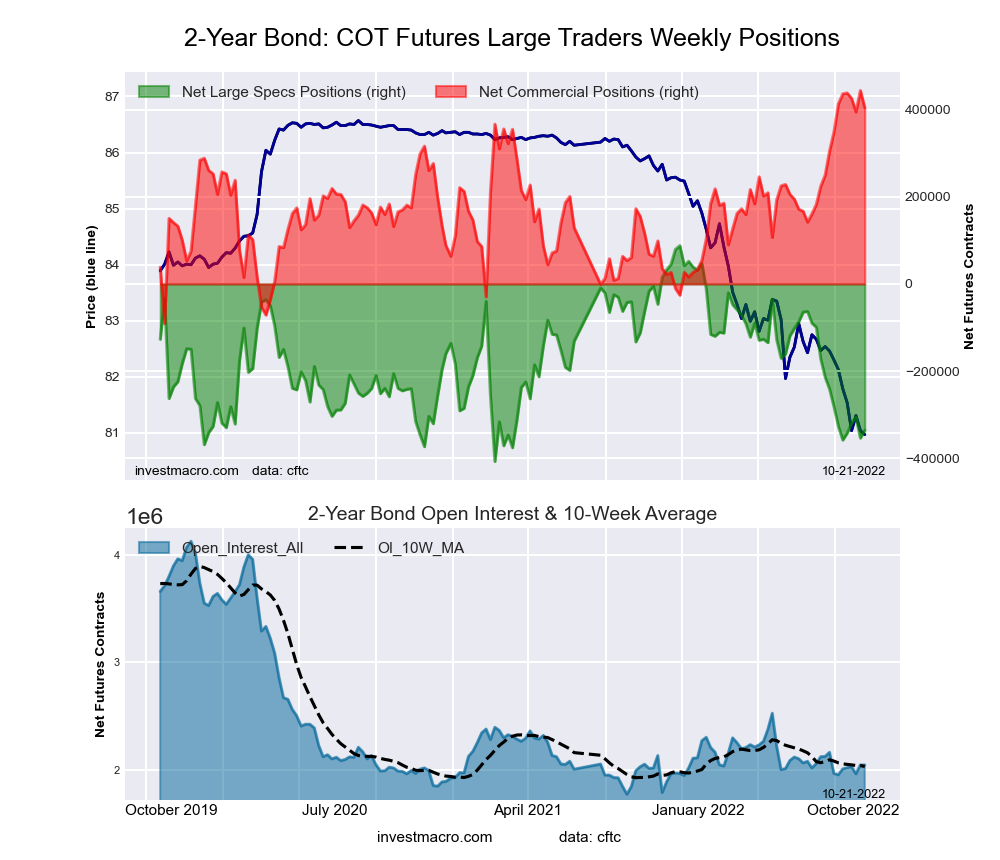
The 2-Year Treasury Note large speculator standing this week came in at a net position of -335,512 contracts in the data reported through Tuesday. This was a weekly gain of 18,174 contracts from the previous week which had a total of -353,686 net contracts.
This week’s current strength score (the trader positioning range over the past three years, measured from 0 to 100) shows the speculators are currently Bearish-Extreme with a score of 14.5 percent. The commercials are Bullish-Extreme with a score of 92.3 percent and the small traders (not shown in chart) are Bearish with a score of 21.4 percent.
2-Year Treasury Note Statistics
SPECULATORS
COMMERCIALS
SMALL TRADERS
– Percent of Open Interest Longs:
7.0
83.6
7.8
– Percent of Open Interest Shorts:
23.4
63.8
11.2
– Net Position:
-335,512
404,181
-68,669
– Gross Longs:
143,755
1,709,706
160,055
– Gross Shorts:
479,267
1,305,525
228,724
– Long to Short Ratio:
0.3 to 1
1.3 to 1
0.7 to 1
NET POSITION TREND:
– Strength Index Score (3 Year Range Pct):
14.5
92.3
21.4
– Strength Index Reading (3 Year Range):
Bearish-Extreme
Bullish-Extreme
Bearish
NET POSITION MOVEMENT INDEX:
– 6-Week Change in Strength Index:
-1.8
-1.7
7.9
5-Year Treasury Note Futures:
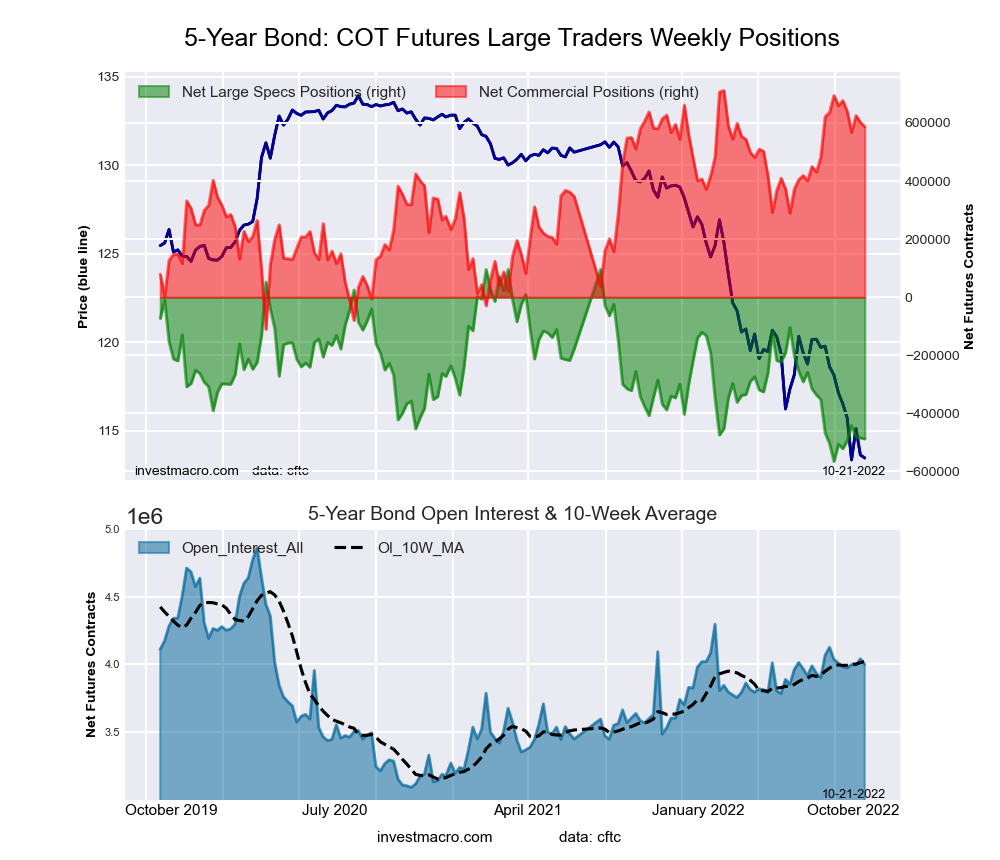
The 5-Year Treasury Note large speculator standing this week came in at a net position of -487,577 contracts in the data reported through Tuesday. This was a weekly fall of -3,657 contracts from the previous week which had a total of -483,920 net contracts.
This week’s current strength score (the trader positioning range over the past three years, measured from 0 to 100) shows the speculators are currently Bearish-Extreme with a score of 11.8 percent. The commercials are Bullish-Extreme with a score of 84.8 percent and the small traders (not shown in chart) are Bullish with a score of 53.8 percent.
5-Year Treasury Note Statistics
SPECULATORS
COMMERCIALS
SMALL TRADERS
– Percent of Open Interest Longs:
5.5
85.9
7.8
– Percent of Open Interest Shorts:
17.7
71.2
10.3
– Net Position:
-487,577
586,839
-99,262
– Gross Longs:
219,782
3,434,617
311,325
– Gross Shorts:
707,359
2,847,778
410,587
– Long to Short Ratio:
0.3 to 1
1.2 to 1
0.8 to 1
NET POSITION TREND:
– Strength Index Score (3 Year Range Pct):
11.8
84.8
53.8
– Strength Index Reading (3 Year Range):
Bearish-Extreme
Bullish-Extreme
Bullish
NET POSITION MOVEMENT INDEX:
– 6-Week Change in Strength Index:
2.8
-8.8
14.9
10-Year Treasury Note Futures:
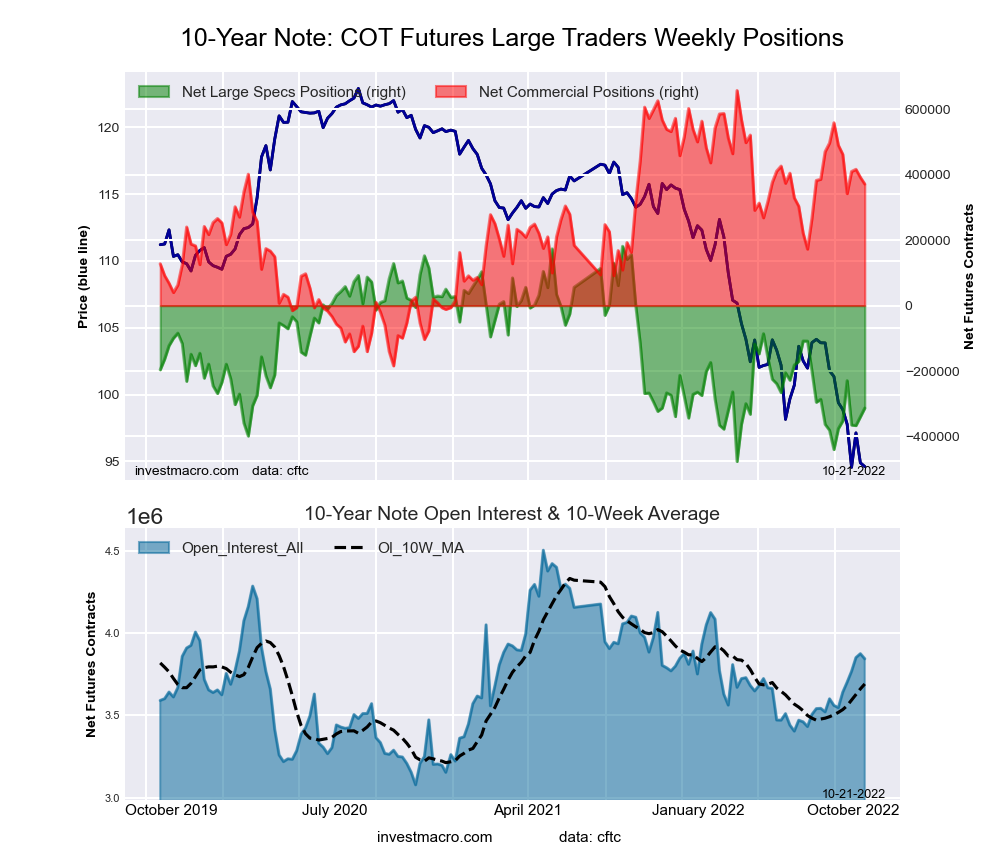
The 10-Year Treasury Note large speculator standing this week came in at a net position of -313,438 contracts in the data reported through Tuesday. This was a weekly increase of 26,725 contracts from the previous week which had a total of -340,163 net contracts.
This week’s current strength score (the trader positioning range over the past three years, measured from 0 to 100) shows the speculators are currently Bearish with a score of 24.8 percent. The commercials are Bullish with a score of 66.0 percent and the small traders (not shown in chart) are Bullish with a score of 66.3 percent.
10-Year Treasury Note Statistics
SPECULATORS
COMMERCIALS
SMALL TRADERS
– Percent of Open Interest Longs:
10.5
78.0
9.0
– Percent of Open Interest Shorts:
18.7
68.3
10.6
– Net Position:
-313,438
371,577
-58,139
– Gross Longs:
405,265
2,997,874
347,408
– Gross Shorts:
718,703
2,626,297
405,547
– Long to Short Ratio:
0.6 to 1
1.1 to 1
0.9 to 1
NET POSITION TREND:
– Strength Index Score (3 Year Range Pct):
24.8
66.0
66.3
– Strength Index Reading (3 Year Range):
Bearish
Bullish
Bullish
NET POSITION MOVEMENT INDEX:
– 6-Week Change in Strength Index:
9.6
-14.1
13.2
Ultra 10-Year Notes Futures:
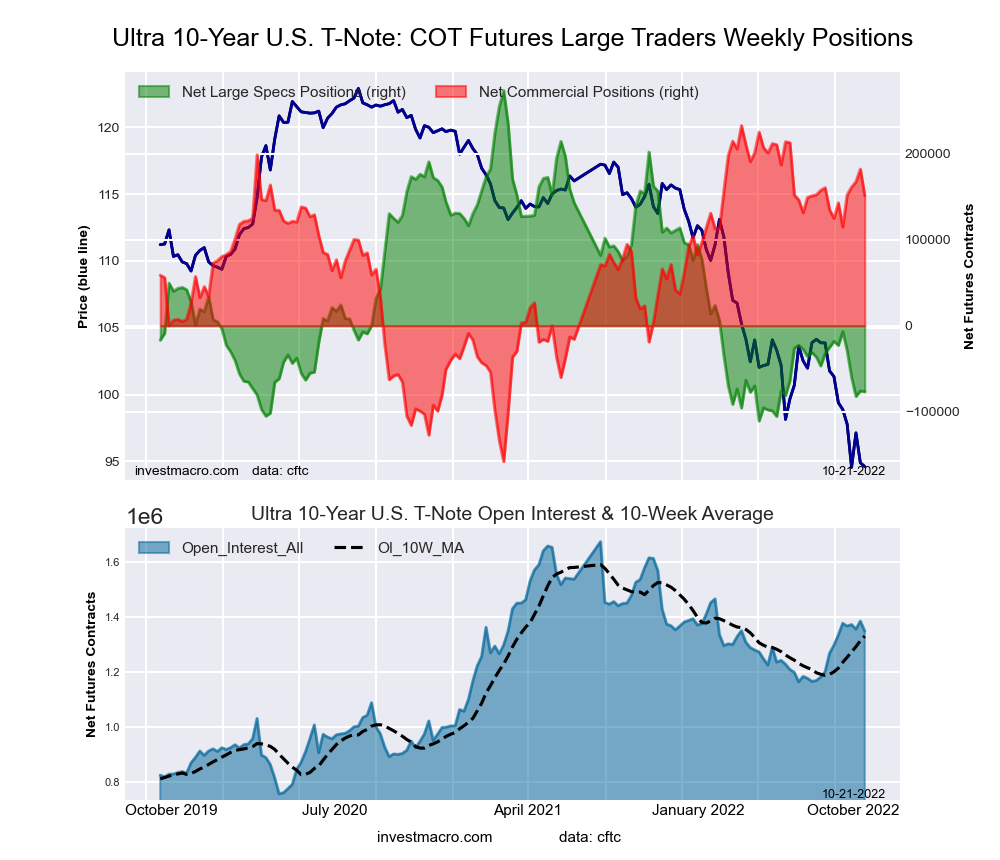
The Ultra 10-Year Notes large speculator standing this week came in at a net position of -76,651 contracts in the data reported through Tuesday. This was a weekly fall of -880 contracts from the previous week which had a total of -75,771 net contracts.
This week’s current strength score (the trader positioning range over the past three years, measured from 0 to 100) shows the speculators are currently Bearish-Extreme with a score of 8.9 percent. The commercials are Bullish with a score of 79.1 percent and the small traders (not shown in chart) are Bullish with a score of 77.4 percent.
Ultra 10-Year Notes Statistics
SPECULATORS
COMMERCIALS
SMALL TRADERS
– Percent of Open Interest Longs:
7.1
80.6
11.6
– Percent of Open Interest Shorts:
12.8
69.4
17.1
– Net Position:
-76,651
151,326
-74,675
– Gross Longs:
96,245
1,087,382
155,853
– Gross Shorts:
172,896
936,056
230,528
– Long to Short Ratio:
0.6 to 1
1.2 to 1
0.7 to 1
NET POSITION TREND:
– Strength Index Score (3 Year Range Pct):
8.9
79.1
77.4
– Strength Index Reading (3 Year Range):
Bearish-Extreme
Bullish
Bullish
NET POSITION MOVEMENT INDEX:
– 6-Week Change in Strength Index:
-14.0
2.1
30.1
US Treasury Bonds Futures:
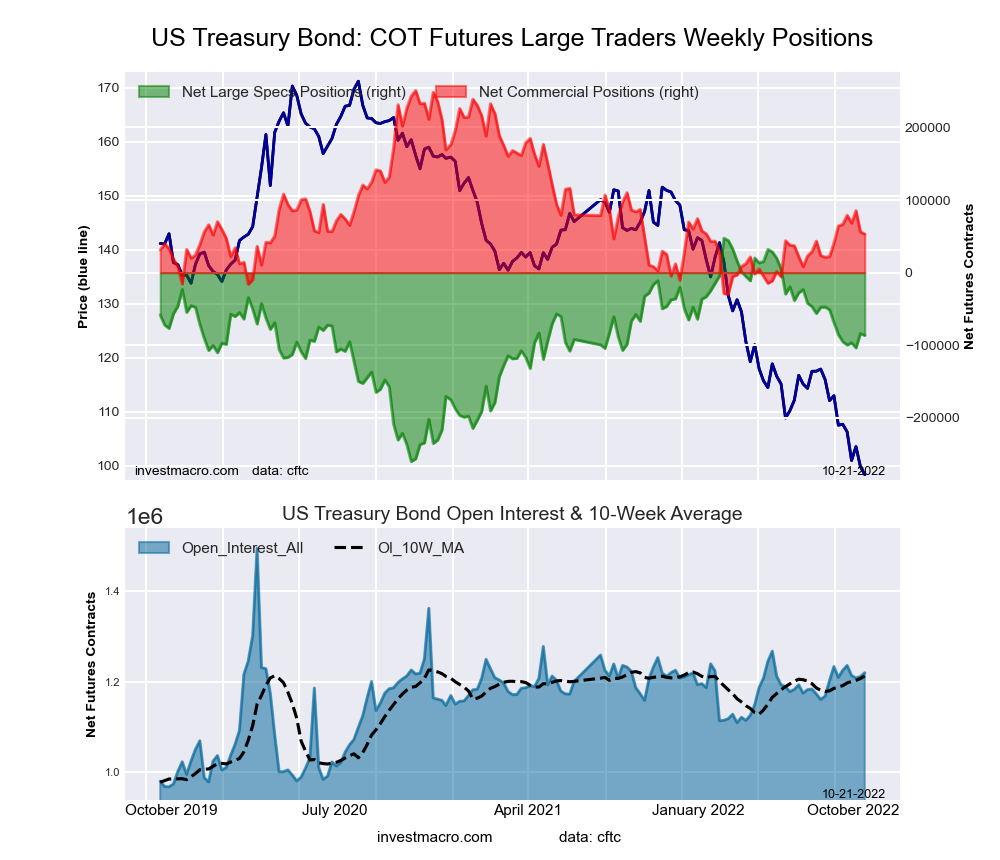
The US Treasury Bonds large speculator standing this week came in at a net position of -86,339 contracts in the data reported through Tuesday. This was a weekly reduction of -2,547 contracts from the previous week which had a total of -83,792 net contracts.
This week’s current strength score (the trader positioning range over the past three years, measured from 0 to 100) shows the speculators are currently Bullish with a score of 56.5 percent. The commercials are Bearish with a score of 29.6 percent and the small traders (not shown in chart) are Bullish with a score of 78.9 percent.
US Treasury Bonds Statistics
SPECULATORS
COMMERCIALS
SMALL TRADERS
– Percent of Open Interest Longs:
6.4
78.0
14.5
– Percent of Open Interest Shorts:
13.5
73.6
11.8
– Net Position:
-86,339
53,148
33,191
– Gross Longs:
78,416
951,261
176,693
– Gross Shorts:
164,755
898,113
143,502
– Long to Short Ratio:
0.5 to 1
1.1 to 1
1.2 to 1
NET POSITION TREND:
– Strength Index Score (3 Year Range Pct):
56.5
29.6
78.9
– Strength Index Reading (3 Year Range):
Bullish
Bearish
Bullish
NET POSITION MOVEMENT INDEX:
– 6-Week Change in Strength Index:
-0.4
-3.9
9.6
Ultra US Treasury Bonds Futures:
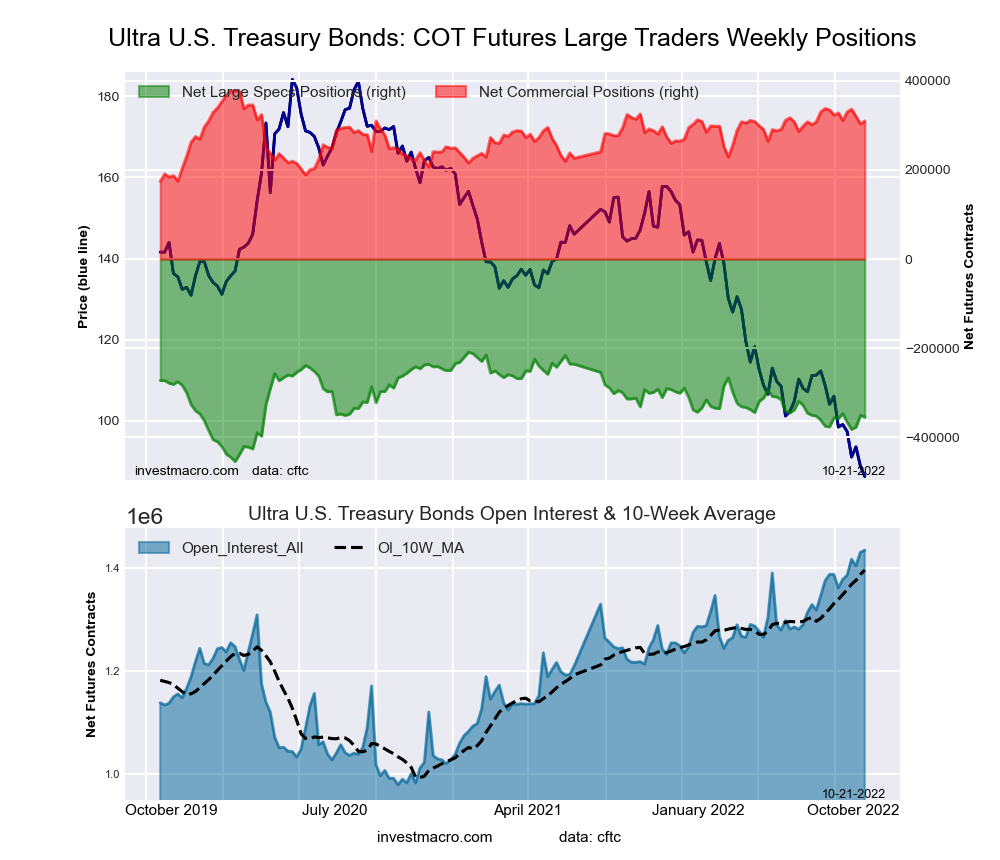
The Ultra US Treasury Bonds large speculator standing this week came in at a net position of -354,518 contracts in the data reported through Tuesday. This was a weekly lowering of -4,286 contracts from the previous week which had a total of -350,232 net contracts.
This week’s current strength score (the trader positioning range over the past three years, measured from 0 to 100) shows the speculators are currently Bearish with a score of 40.6 percent. The commercials are Bullish with a score of 63.9 percent and the small traders (not shown in chart) are Bullish with a score of 68.7 percent.
Ultra US Treasury Bonds Statistics
SPECULATORS
COMMERCIALS
SMALL TRADERS
– Percent of Open Interest Longs:
6.3
82.3
11.1
– Percent of Open Interest Shorts:
31.0
60.7
7.9
– Net Position:
-354,518
309,624
44,894
– Gross Longs:
90,476
1,179,562
158,799
– Gross Shorts:
444,994
869,938
113,905
– Long to Short Ratio:
0.2 to 1
1.4 to 1
1.4 to 1
NET POSITION TREND:
– Strength Index Score (3 Year Range Pct):
40.6
63.9
68.7
– Strength Index Reading (3 Year Range):
Bearish
Bullish
Bullish
NET POSITION MOVEMENT INDEX:
– 6-Week Change in Strength Index:
1.2
-9.6
12.4
Article By InvestMacro – Receive our weekly COT Newsletter
*COT Report: The COT data, released weekly to the public each Friday, is updated through the most recent Tuesday (data is 3 days old) and shows a quick view of how large speculators or non-commercials (for-profit traders) were positioned in the futures markets.
The CFTC categorizes trader positions according to commercial hedgers (traders who use futures contracts for hedging as part of the business), non-commercials (large traders who speculate to realize trading profits) and nonreportable traders (usually small traders/speculators) as well as their open interest (contracts open in the market at time of reporting). See CFTC criteria here.
“The primary value of the Wave Principle is that it provides a context for market analysis”
By Elliott Wave International
Elliott waves reflect the repetitive patterns of mass psychology — so they are ideally suited for analyzing the widely traded main stock indexes.
On the other hand, thinly traded individual stocks may not trace out Elliott wave price patterns nearly as well.
That said, there are many individual stocks which are widely traded — like most of the big and well-known companies (and others which have captured the interest of investors).
Consider the stock of the largest bank in the U.S. Back in March, our Global Market Perspective showed this chart and said:
This chart shows the five-wave pattern of JPMorgan Chase’s rise from March 2009 to September 2021.
Of course, the completion of a five-wave up pattern means a downtrend is next. When that analysis published, the share price was $134.40. As of this intraday writing on Oct.3, it’s $106.79.
Let’s go back in time to review another example of how Elliott wave analysis can be applied to an individual stock.
This case-in-point involves GE. The September Elliott Wave Theorist was discussing wave analysis with individual stocks and showed these side-by-side charts and said:
The October 27, 2000 [Global Market Perspective] published the chart on the left, showing a completed Elliott wave in GE stock. This quarter-century pattern portended a major reversal. The chart on the right shows what happened thereafter.
Not every forecast based on the Elliott wave model works out perfectly. At the same time, keep in mind these words from Frost & Prechter’s Wall Street classic, Elliott Wave Principle: Key to Market Behavior:
The primary value of the Wave Principle is that it provides a context for market analysis. This context provides both a basis for disciplined thinking and a perspective on the market’s general position and outlook. At times, its accuracy in identifying, and even anticipating changes in direction is almost unbelievable.
If you’d like to read the entire online version of the book for free, you may do so once you become a member of Club EWI, the world’s largest Elliott wave educational community (approximately 500,000 worldwide members).
A Club EWI membership also opens the door to free access to a wealth of other Elliott wave resources — such as videos and articles from Elliott Wave International’s analysts.
We all have to make hard decisions from time to time. The hardest of my life was whether or not to change research fields after my PhD, from fundamental physics to climate physics. I had job offers that could have taken me in either direction – one to join Stephen Hawking’s Relativity and Gravitation Group at Cambridge University, another to join the Met Office as a scientific civil servant.
I wrote down the pros and cons of both options as one is supposed to do, but then couldn’t make up my mind at all. Like Buridan’s donkey, I was unable to move to either the bale of hay or the pail of water. It was a classic case of paralysis by analysis.
Since it was doing my head in, I decided to try to forget about the problem for a couple of weeks and get on with my life. In that intervening time, my unconscious brain decided for me. I simply walked into my office one day and the answer had somehow become obvious: I would make the change to studying the weather and climate.
More than four decades on, I’d make the same decision again. My fulfilling career has included developing a new, probabilistic way of forecasting weather and climate which is helping humanitarian and disaster relief agencies make better decisions ahead of extreme weather events. (This and many other aspects are described in my new book, The Primacy of Doubt.)
But I remain fascinated by what was going on in my head back then, which led my subconscious to make a life-changing decision that my conscious could not. Is there something to be understood here not only about how to make difficult decisions, but about how humans make the leaps of imagination that characterise us as such a creative species? I believe the answer to both questions lies in a better understanding of the extraordinary power of noise.
Imprecise supercomputers
I went from the pencil-and-paper mathematics of Einstein’s theory of general relativity to running complex climate models on some of the world’s biggest supercomputers. Yet big as they were, they were never big enough – the real climate system is, after all, very complex.
In the early days of my research, one only had to wait a couple of years and top-of-the-range supercomputers would get twice as powerful. This was the era where transistors were getting smaller and smaller, allowing more to be crammed on to each microchip. The consequent doubling of computer performance for the same power every couple of years was known as Moore’s Law.
This story is part of Conversation Insights
The Insights team generates long-form journalism and is working with academics from different backgrounds who have been engaged in projects to tackle societal and scientific challenges.
There is, however, only so much miniaturisation you can do before the transistor starts becoming unreliable in its key role as an on-off switch. Today, with transistors starting to approach atomic size, we have pretty much reached the limit of Moore’s Law. To achieve more number-crunching capability, computer manufacturers must bolt together more and more computing cabinets, each one crammed full of chips.
But there’s a problem. Increasing number-crunching capability this way requires a lot more electric power – modern supercomputers the size of tennis courts consume tens of megawatts. I find it something of an embarrassment that we need so much energy to try to accurately predict the effects of climate change.
That’s why I became interested in how to construct a more accurate climate model without consuming more energy. And at the heart of this is an idea that sounds counterintuitive: by adding random numbers, or “noise”, to a climate model, we can actually make it more accurate in predicting the weather.
A constructive role for noise
Noise is usually seen as a nuisance – something to be minimised wherever possible. In telecommunications, we speak about trying to maximise the “signal-to-noise ratio” by boosting the signal or reducing the background noise as much as possible. However, in nonlinear systems, noise can be your friend and actually contribute to boosting a signal. (A nonlinear system is one whose output does not vary in direct proportion to the input. You will likely be very happy to win £100 million on the lottery, but probably not twice as happy to win £200 million.)
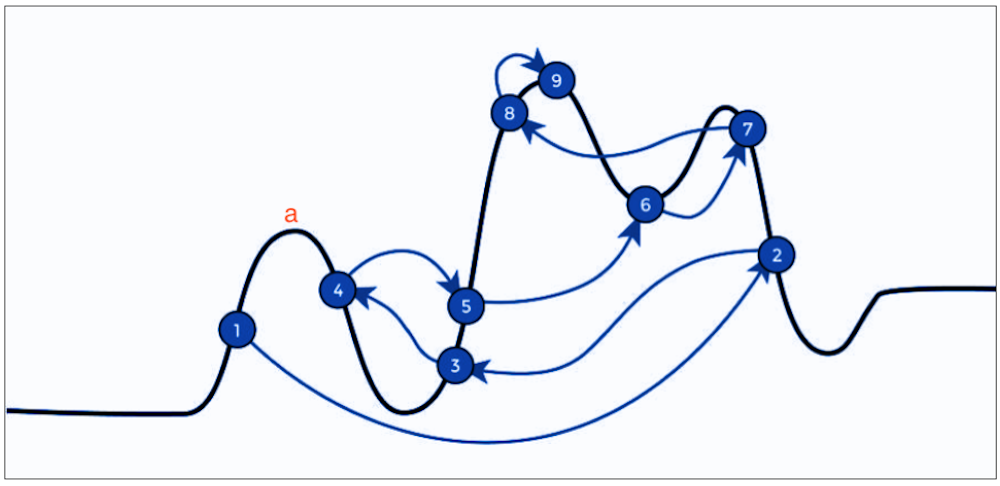
Noise can, for example, help us find the maximum value of a complicated curve such as in Figure 1, below. There are many situations in the physical, biological and social sciences as well as in engineering where we might need to find such a maximum. In my field of meteorology, the process of finding the best initial conditions for a global weather forecast involves identifying the maximum point of a very complicated meteorological function.
Figure 1
A curve with multiple local peaks and troughs. Author provided
However, employing a “deterministic algorithm” to locate the global maximum doesn’t usually work. This type of algorithm will typically get stuck at a local peak (for example at point a) because the curve moves downwards in both directions from there.
An answer is to use a technique called “simulated annealing” – so called because of its similarities with (annealing), the heat treatment process that changes the properties of metals. Simulated annealing, which employs noise to get round the issue of getting stuck at local peaks, has been used to solve many problems including the classic travelling salesman puzzle of finding the shortest path between a large number of cities on a map.
Figure 1 shows a possible route to locating the curve’s global maximum (point 9) by using the following criteria:
If a randomly chosen point is higher than the current position on the curve, then the new point is always moved to.
If it is lower than the current position, the suggested point isn’t necessarily rejected. It depends whether the new point is a lot lower or just a little lower.
However, the decision to move to a new point also depends on how long the analysis has been running. Whereas in the early stages, random points quite a bit lower than the current position may be accepted, in later stages only those that are higher or just a tiny bit lower are accepted.
The technique is known as simulated annealing because early on – like hot metal in the early phase of cooling – the system is pliable and changeable. Later in the process – like cold metal in the late phase of cooling – it is almost rigid and unchangeable.
How noise can help climate models
Noise was introduced into comprehensive weather and climate models around 20 years ago. A key reason was to represent model uncertainty in our ensemble weather forecasts – but it turned out that adding noise also reduced some of the biases the models had, making them more accurate simulators of weather and climate.
Unfortunately, these models require huge supercomputers and a lot of energy to run them. They divide the world into small gridboxes, with the atmosphere and ocean within each assumed to be constant – which, of course, it isn’t. The horizontal scale of a typical gridbox is around 100km – so one way of making a model more accurate is to reduce this distance to 50km, or 10km or 1km. However, halving the volume of a gridbox increases the computational cost of running the model by up to a factor of 16, meaning it consumes a lot more energy.
Here again, noise offered an appealing alternative. The proposal was to use it to represent the unpredictable (and unmodellable) variations in small-scale climatic processes like turbulence, cloud systems, ocean eddies and so on. I argued that adding noise could be a way of boosting accuracy without having to incur the enormous computational cost of reducing the size of the gridboxes. For example, as has now been verified, adding noise to a climate model increases the likelihood of producing extreme hurricanes – reflecting the potential reality of a world whose weather is growing more extreme due to climate change.
The computer hardware we use for this modelling is inherently noisy – electrons travelling along wires in a computer move in partly random ways due to its warm environment. Such randomness is called “thermal noise”. Could we save even more energy by tapping into it, rather than having to use software to generate pseudo-random numbers? To me, low-energy “imprecise” supercomputers that are inherently noisy looked like a win-win proposal.
But not all of my colleagues were convinced. They were uncomfortable that computers might not give the same answers from one day to the next. To try to persuade them, I began to think about other real-world systems that, because of limited energy availability, also use noise that is generated within their hardware. And I stumbled on the human brain.
Noise in the brain
Every second of the waking day, our eyes alone send gigabytes of data to the brain. That’s not much different to the amount of data a climate model produces each time it outputs data to memory.
The brain has to process this data and somehow make sense of it. If it did this using the power of a supercomputer, that would be impressive enough. But it does it using one millionth of that power, about 20W instead of 20MW – what it takes to power a lightbulb. Such energy efficiency is mind-bogglingly impressive. How on Earth does the brain do it?
An adult brain contains some 80 billion neurons. Each neuron has a long slender biological cable – the axon – along which electrical impulses are transmitted from one set of neurons to the next. But these impulses, which collectively describe information in the brain, have to be boosted by protein “transistors” positioned at regular intervals along the axons. Without them, the signal would dissipate and be lost.
The energy for these boosts ultimately comes from an organic compound in the blood called ATP (adenosine triphosphate). This enables electrically charged atoms of sodium and potassium (ions) to be pushed through small channels in the neuron walls, creating electrical voltages which, much like those in silicon transistors, amplify the neuronal electric signals as they travel along the axons.
With 20W of power spread across tens of billions of neurons, the voltages involved are tiny, as are the axon cables. And there is evidence that axons with a diameter less than about 1 micron (which most in the brain are) are susceptible to noise. In other words, the brain is a noisy system.
If this noise simply created unhelpful “brain fog”, one might wonder why we evolved to have so many slender axons in our heads. Indeed, there are benefits to having fatter axons: the signals propagate along them faster. If we still needed fast reaction times to escape predators, then slender axons would be disadvantageous. However, developing communal ways of defending ourselves against enemies may have reduced the need for fast reaction times, leading to an evolutionary trend towards thinner axons.
Perhaps, serendipitously, evolutionary mutations that further increased neuron numbers and reduced axon sizes, keeping overall energy consumption the same, made the brain’s neurons more susceptible to noise. And there is mounting evidence that this had another remarkable effect: it encouraged in humans the ability to solve problems that required leaps in imagination and creativity.
Perhaps we only truly became Homo Sapiens when significant noise began to appear in our brains?
Putting noise in the brain to good use
Many animals have developed creative approaches to solving problems, but there is nothing to compare with a Shakespeare, a Bach or an Einstein in the animal world.
How do creative geniuses come up with their ideas? Here’s a quote from Andrew Wiles, perhaps the most famous mathematician alive today, about the time leading up to his celebrated proof of the maths problem (misleadingly) known as Fermat’s Last Theorem:
When you reach a real impasse, then routine mathematical thinking is of no use to you. Leading up to that kind of new idea, there has to be a long period of tremendous focus on the problem without any distraction. You have to really think about nothing but that problem – just concentrate on it. And then you stop. [At this point] there seems to be a period of relaxation during which the subconscious appears to take over – and it’s during this time that some new insight comes.
BBC’s Horizon unpicks Andrew Wiles’s novel approach to solving Fermat’s Theorem.
This notion seems universal. Physics Nobel Laureate Roger Penrose has spoken about his “Eureka moment” when crossing a busy street with a colleague (perhaps reflecting on their conversation while also looking out for oncoming traffic). For the father of chaos theory Henri Poincaré, it was catching a bus.
And it’s not just creativity in mathematics and physics. Comedian John Cleese, of Monty Python fame, makes much the same point about artistic creativity – it occurs not when you are focusing hard on your trade, but when you relax and let your unconscious mind wander.
Of course, not all the ideas that bubble up from your subconscious are going to be Eureka moments. Physicist Michael Berry talks about these subconscious ideas as if they are elementary particles called “claritons”:
Actually, I do have a contribution to particle physics … the elementary particle of sudden understanding: the “clariton”. Any scientist will recognise the “aha!” moment when this particle is created. But there is a problem: all too frequently, today’s clariton is annihilated by tomorrow’s “anticlariton”. So many of our scribblings disappear beneath a rubble of anticlaritons.
Here is something we can all relate to: that in the cold light of day, most of our “brilliant” subconscious ideas get annihilated by logical thinking. Only a very, very, very small number of claritons remain after this process. But the ones that do are likely to be gems.
In his renowned book Thinking Fast and Slow, the Nobel prize-winning psychologist Daniel Kahneman describes the brain in a binary way. Most of the time when walking, chatting and looking around (in other words when multitasking), it operates in a mode Kahneman calls “system 1” – a rather fast, automatic, effortless mode of operation.
By contrast, when we are thinking hard about a specific problem (unitasking), the brain is in the slower, more deliberative and logical “system 2”. To perform a calculation like 37×13, we have to stop walking, stop talking, close our eyes and even put our hands over our ears. No chance for significant multitasking in system 2.
My 2015 paper with computational neuroscientist Michael O’Shea interpreted system 1 as a mode where available energy is spread across a large number of active neurons, and system 2 as where energy is focused on a smaller number of active neurons. The amount of energy per active neuron is therefore much smaller when in the system 1 mode, and it would seem plausible that the brain is more susceptible to noise when in this state. That is, in situations when we are multitasking, the operation of any one of the neurons will be most susceptible to the effects of noise in the brain.
Berry’s picture of clariton-anticlariton interaction seems to suggest a model of the brain where the noisy system 1 and the deterministic system 2 act in synergy. The anticlariton is the logical analysis that we perform in system 2 which, most of the time, leads us to reject our crazy system 1 ideas.
But sometimes one of these ideas turns out to be not so crazy.
This is reminiscent of how our simulated annealing analysis (Figure 1) works. Initially, we might find many “crazy” ideas appealing. But as we get closer to locating the optimal solution, the criteria for accepting a new suggestion becomes more stringent and discerning. Now, system 2 anticlaritons are annihilating almost everything the system 1 claritons can throw at them – but not quite everything, as Wiles found to his great relief.
The key to creativity
If the key to creativity is the synergy between noisy and deterministic thinking, what are some consequences of this?
On the one hand, if you do not have the necessary background information then your analytic powers will be depleted. That’s why Wiles says that leading up to the moment of insight, you have to immerse yourself in your subject. You aren’t going to have brilliant ideas which will revolutionise quantum physics unless you have a pretty good grasp of quantum physics in the first place.
But you also need to leave yourself enough time each day to do nothing much at all, to relax and let your mind wander. I tell my research students that if they want to be successful in their careers, they shouldn’t spend every waking hour in front of their laptop or desktop. And swapping it for social media probably doesn’t help either, since you still aren’t really multitasking – each moment you are on social media, your attention is still fixed on a specific issue.
But going for a walk or bike ride or painting a shed probably does help. Personally, I find that driving a car is a useful activity for coming up with new ideas and thoughts – provided you don’t turn the radio on.
When making difficult decisions, this suggests that, having listed all the pros and cons, it can be helpful not to actively think about the problem for a while. I think this explains how, years ago, I finally made the decision to change my research direction – not that I knew it at the time.
Because the brain’s system 1 is so energy efficient, we use it to make the vast majority of the many decisions in our daily lives (some say as many as 35,000) – most of which aren’t that important, like whether to continue putting one leg in front of the other as we walk down to the shops. (I could alternatively stop after each step, survey my surroundings to make sure a predator was not going to jump out and attack me, and on that basis decide whether to take the next step.)
However, this system 1 thinking can sometimes lead us to make bad decisions, because we have simply defaulted to this low-energy mode and not engaged system 2 when we should have. How many times do we say to ourselves in hindsight: “Why didn’t I give such and such a decision more thought?”
Of course, if instead we engaged system 2 for every decision we had to make, then we wouldn’t have enough time or energy to do all the other important things we have to do in our daily lives (so the shops may have shut by the time we reach them).
From this point of view, we should not view giving wrong answers to unimportant questions as evidence of irrationality. Kahneman cites the fact that more than 50% of students at MIT, Harvard and Princeton gave the incorrect answer to this simple question – a bat and ball costs $1.10; the bat costs one dollar more than the ball; how much does the ball cost? – as evidence of our irrationality. The correct answer, if you think about it, is 5 cents. But system 1 screams out ten cents.
If we were asked this question on pain of death, one would hope we would spend enough thought to come up with the correct answer. But if we were asked the question as part of an anonymous after-class test, when we had much more important things to spend time and energy doing, then I’d be inclined to think of it as irrational to give the right answer.
If we had 20MW to run the brain, we could spend part of it solving unimportant problems. But we only have 20W and we need to use it carefully. Perhaps it’s the 50% of MIT, Harvard and Princeton students who gave the wrong answer who are really the clever ones.
Just as a climate model with noise can produce types of weather that a model without noise can’t, so a brain with noise can produce ideas that a brain without noise can’t. And just as these types of weather can be exceptional hurricanes, so the idea could end up winning you a Nobel Prize.
So, if you want to increase your chances of achieving something extraordinary, I’d recommend going for that walk in the countryside, looking up at the clouds, listening to the birds cheeping, and thinking about what you might eat for dinner.
So could computers be creative?
Will computers, one day, be as creative as Shakespeare, Bach or Einstein? Will they understand the world around us as we do? Stephen Hawking famously warned that AI will eventually take over and replace mankind.
However, the best-known advocate of the idea that computers will never understand as we do is Hawking’s old colleague, Roger Penrose. In making his claim, Penrose invokes an important “meta” theorem in mathematics known as Gödel’s theorem, which says there are mathematical truths that can’t be proven by deterministic algorithms.
There is a simple way of illustrating Gödel’s theorem. Suppose we make a list of all the most important mathematical theorems that have been proven since the time of the ancient Greeks. First on the list would be Euclid’s proof that there are an infinite number of prime numbers, which requires one really creative step (multiply the supposedly finite number of primes together and add one). Mathematicians would call this a “trick” – shorthand for a clever and succinct mathematical construction.
But is this trick useful for proving important theorems further down the list, like Pythagoras’s proof that the square root of two cannot be expressed as the ratio of two whole numbers? It’s clearly not; we need another trick for that theorem. Indeed, as you go down the list, you’ll find that a new trick is typically needed to prove each new theorem. It seems there is no end to the number of tricks that mathematicians will need to prove their theorems. Simply loading a given set of tricks on a computer won’t necessarily make the computer creative.
Does this mean mathematicians can breathe easily, knowing their jobs are not going to be taken over by computers? Well maybe not.
I have been arguing that we need computers to be noisy rather than entirely deterministic, “bit-reproducible” machines. And noise, especially if it comes from quantum mechanical processes, would break the assumptions of Gödel’s theorem: a noisy computer is not an algorithmic machine in the usual sense of the word.
Does this imply that a noisy computer can be creative? Alan Turing, pioneer of the general-purpose computing machine, believed this was possible, suggesting that “if a machine is expected to be infallible then it cannot also be intelligent”. That is to say, if we want the machine to be intelligent then it had better be capable of making mistakes.
Others may argue there is no evidence that simply adding noise will make an otherwise stupid machine into an intelligent one – and I agree, as it stands. Adding noise to a climate model doesn’t automatically make it an intelligent climate model.
However, the type of synergistic interplay between noise and determinism – the kind that sorts the wheat from the chaff of random ideas – has hardly yet been developed in computer codes. Perhaps we could develop a new type of AI model where the AI is trained by getting it to solve simple mathematical theorems using the clariton-anticlariton model; by making guesses and seeing if any of these have value.
For this to be at all tractable, the AI system would need to be trained to focus on “educated random guesses”. (If the machine’s guesses are all uneducated ones, it will take forever to make progress – like waiting for a group of monkeys to type the first few lines of Hamlet.)
For example, in the context of Euclid’s proof that there are an unlimited number of primes, could we train an AI system in such a way that a random idea like “multiply the assumed finite number of primes together and add one” becomes much more likely than the completely useless random idea “add the assumed finite number of primes together and subtract six”? And if a particular guess turns out to be especially helpful, can we train the AI system so that the next guess is a refinement of the last one?
If we can somehow find a way to do this, it could open up modelling to a completely new level that is relevant to all fields of study. And in so doing, we might yet reach the so-called “singularity” when machines take over from humans. But only when AI developers fully embrace the constructive role of noise – as it seems the brain did many thousands of years ago.
For now, I feel the need for another walk in the countryside. To blow away some fusty old cobwebs – and perhaps sow the seeds for some exciting new ones.
Frontier Lithium Inc. announced the latest group of drill results from its Spark Deposit in northwestern Ontario. The firm reported it intersected 326.6m of pegmatite averaging 1.92% lithium oxide (Li2O), which included a 50m high-grade zone of 2.98% Li2O. Canaccord Genuity Corp. (Canada) advised in a research update that the positive results achieved in Frontier’s Phase XII drill program once again demonstrate grades that are well above the current mineral resource estimate of 1.38% Li2O.
The firm’s 100%-owned PAK Lithium Project contains two delineated premium spodumene-bearing lithium deposits known as the Spark and the PAK deposits. The company stated that through September 11, 2022, it has drilled a total of 11,150 meters (m) across 34 holes during its Phase XII delineation and infill drilling program and indicated that the data it just released pertains to results from four holes drilled at Spark.
Canaccord Genuity Corp. (Canada) Analyst Katie Lachapelle, CPA, commented, “We continue to be impressed by the positive results from the Phase XII drill program.”
The firm said that these four additional drill holes targeting the Spark Deposit were designed to “convert inferred material to the indicated category for the planned open pit.”
Frontier highlighted that Hole DDH PL-065-22 intersected 171.5m of pegmatite averaging 1.57% lithium oxide (Li2O), and Hole PL-062-22 returned 19.2m of 2.88% Li2O, 2.23% cesium oxide (Cs2O) and 513 ppm (parts per million) tantalum pentoxide (Ta2O5).
The firm indicated that Hole DDH PL-067-22, which was drilled with the goal of converting inferred material at depth, intercepted 326.6m of pegmatite averaging 1.92% Li2O, including a section of 50m averaging 2.98% Li2O.
Two other holes, DDH PL-069-22 and DDH PL-072-22, intersected 275.3m of pegmatite, averaging 1.74% Li2O, and 124.1m of pegmatite, averaging 1.55% Li2O, respectively.
The company’s V.P. of Exploration Garth Drever remarked, “After tripling the meters drilled since the Resource update in March 2021 and targeting the Inferred, it is safe to say that the model remains robust and there will be substantial new Inferred.”
Drever noted that “the Spark deposit remains open in all directions with predictable grades and widths” and added that he is “extremely pleased with the drilling results to date.”
Lachappel commented, “The consistency of Frontier’s high-grade hits leads us to believe that there is a strong likelihood that the company will report an indicated resource with a higher overall grade. We also expect the updated mineral resource to include new inferred material, with drilling indicating that the Spark deposit is still open in all directions.”
In an October 11, 2022 research note, Canaccord Genuity Corp. (Canada) Analyst Katie Lachapelle, CPA, commented, “We continue to be impressed by the positive results from the Phase XII drill program, which continue to demonstrate grades well above the current mineral resource estimate (1.38% Li2O).”
The analyst emphasized this is evidenced by these latest results, which all returned significant widths averaging 1.55%, 1.57%, 1.74%, and 1.92% Li2O.
The report mentioned that the PAK Lithium Project encompasses nearly 27,000 ha (hectares) and “contains North America’s highest grade lithium resource that is top three in size on the continent and is considered premium quality globally as a result of its rare low-iron spodumene.” The PAK Project hosts a Measured and Indicated resource of 21.64 Mt (million tonnes) averaging 1.56% Li2O and an Inferred resource of 20.87 Mt averaging 1.42% Li2O.
As outlined in an N-43-101 compliant technical report issued on April 5, 2021, the plans for the Pak Project include “a fully integrated lithium operation from the resource to achieve downstream conversion plan for [the] production of battery-quality lithium salts.” The report estimated that the property had an after-tax net present value (NPV) of US$974M (million) with an internal rate of return (IRR) of 21%.
In addition, two other spodumene-bearing discoveries have been made within the confines of the PAK property, including the Bolt pegmatite and Pennock pegmatite areas.
The Catalyst
Frontier Lithium advised in its most recent news release that it is currently utilizing a phased approach to preparing a Preliminary Feasibility Study (PFS), which should be ready in Q1/23. The company indicated that during Phase 1, it will focus on mine advancement and mill development with the objective of producing premium-grade spodumene concentrates.
Canaccord presently maintains a “Speculative Buy” rating and a CA$4.75 per share target price for Frontier Lithium Inc. This target price is a 114.932% increase from the current price of CA$2.21.
During Phase 2, the firm said it will concentrate its efforts on raising mine and mill production volumes in order to supply its downstream refinery with materials needed to produce lithium chemicals intended for use in the energy storage and electric vehicle (EV) battery market.
The completion and delivery of the PFS may prove to be a positive catalyst going forward. In the October 11, 2022 research note, Canaccord Analyst Lachapelle stated that strong existing and future demand for concentrate provides a solid basis for a phased approach to development.
Lachappel commented, “The consistency of Frontier’s high-grade hits leads us to believe that there is a strong likelihood that the company will report an indicated resource with a higher overall grade. We also expect the updated mineral resource to include new inferred material, with drilling indicating that the Spark deposit is still open in all directions.”
Lachapelle noted that “Frontier Lithium currently trades at 0.48x NAV (net asset value), which we believe is an attractive discount to peers at 0.64x NAV.” Canaccord presently maintains a “Speculative Buy” rating and a CA$4.75 per share target price for Frontier Lithium Inc. This target price is a 114.932% increase from the current price of CA$2.21.
Resource Expansion Potential
Recent drill results show room for further resource growth at the company’s Electric Avenue District property.
Frontier Lithium’s V.P. of Exploration Garth Drever commented, “Our modeling beneath the central indicated resource appears solid, and drilling to the west continues to intersect significant pegmatite zones, and the Spark deposit remains open in all directions and zones of elevated tantalum and cesium along with lithium are being delineated.”
Lachapelle pointed out that Canaccord’s valuation for Frontier was predicated upon the extraction and processing of material produced by only a 23Mt resource, which is far below the firm’s total current resource, which has grown to 42Mt grading 1.54% Li2O and “is among the largest in North America and highest grade.”
Lachapelle continued, “Based on the consistency of infill drilling to date, we expect the majority of Frontier’s existing mineral resource at Spark to be upgraded and included in the mine plan in the future, which could result in a mine life extension of ~14-18 years (18Mt currently included in our mine plan; 32Mt current resource, ~1Mtpa processing).”
Company Operations
Frontier Lithium is a lithium exploration and development company based in Sudbury, Ont., Canada. The company is focused on the development and production of battery-grade lithium hydroxide and lithium salts for the North American EV battery and energy storage markets. Its wholly owned PAK Lithium Project is located in the premier Electric Avenue lithium mining district in northwestern Ontario.
The PAK project includes the PAK Deposit, which has a Measured, Indicated, and Inferred resource of 9.3 MT averaging 2.06% Li2O, and the larger Spark Deposit, which is located just 2.3 km away from PAK and has an estimated Indicated resource of 14.4 MT averaging 1.40% Li2O and an Inferred resource of 18.1 MT averaging 1.37% Li2O.
The property hosts what is believed to be one of the highest-grade large-tonnage hard rock lithium resources in North America. The company’s plans call for “a fully integrated operation from open pit mining through to chemical production (LiOH, 23kt per year).”
Share Structure, Ownership, and Coverage
Frontier Lithium has a diversified investor base. In aggregate, the firm’s management, directors, and advisors own about 25% of the company’s total outstanding shares. Institutional and private investors together account for about 20%, and the remaining 55% is owned by public shareholders.
The company has a market cap of CA$462.26 million with 213.02 million shares outstanding, and the firm’s shares trade in a 52-week range between CA$0.88 and CA$3.89.
Currently, Frontier Lithium is covered by Analyst Katie Lachapelle of Canaccord Genuity and newsletter writers Christ Temple and Clive Maund. Please click “See More Live Data” in the data box above to view more coverage.
Frontier Lithium Inc.’s shares trade on the TSX Venture Exchange under the symbol “FL” and last closed for trading at CA$2.17/share on October 18, 2022. The company’s shares are also listed in the U.S. on the OTCQX under the symbol “LITOF” and under the designation “HL2” on the Frankfort Stock Exchange in Germany.
Disclosures: 1) Stephen Hytha wrote this article for Streetwise Reports LLC and provides services to Streetwise Reports as an independent contractor. He or members of his household own securities of the following companies mentioned in the article: None. He or members of his household are paid by the following companies mentioned in this article: None.
2) The following companies mentioned in this article are billboard sponsors of Streetwise Reports: Frontier Lithium Inc. Click here for important disclosures about sponsor fees. As of the date of this article, an affiliate of Streetwise Reports has a consulting relationship with None. Please click here for more information. The information provided above is for informational purposes only and is not a recommendation to buy or sell any security.
3) Comments and opinions expressed are those of the specific experts and not of Streetwise Reports or its officers. The information provided above is for informational purposes only and is not a recommendation to buy or sell any security.
4) This article does not constitute investment advice. Each reader is encouraged to consult with his or her individual financial professional and any action a reader takes as a result of information presented here is his or her own responsibility. By opening this page, each reader accepts and agrees to Streetwise Reports’ terms of use and full legal disclaimer. This article is not a solicitation for investment. Streetwise Reports does not render general or specific investment advice and the information on Streetwise Reports should not be considered a recommendation to buy or sell any security. Streetwise Reports does not endorse or recommend the business, products, services or securities of any company mentioned on Streetwise Reports.
5) From time to time, Streetwise Reports LLC and its directors, officers, employees or members of their families, as well as persons interviewed for articles and interviews on the site, may have a long or short position in securities mentioned. Directors, officers, employees or members of their immediate families are prohibited from making purchases and/or sales of those securities in the open market or otherwise from the time of the decision to publish an article until three business days after the publication of the article. The foregoing prohibition does not apply to articles that in substance only restate previously published company releases. As of the date of this article, officers and/or employees of Streetwise Reports LLC (including members of their household) own securities of Frontier Lithium Inc., a company mentioned in this article.
EURUSD worked off a downward wave to 0.9752 and a correction to 0.9844. Today the market is forming another wave of decline to the level of 0.9733. After its breakdown, we expect the formation of the consolidation range around this level. Upon release from the range down, we will consider continuation of the trend towards 0.9622. The target is local.
GBPUSD, “Great Britain Pound vs US Dollar”
GBPUSD has worked off a decline wave to the level of 1.1170 and correction to 1.1330. Today we expect the development of the next decline wave to the level of 1.1150. After its breakdown, we will consider the formation of the consolidation range around this level. With the exit from it downwards, the potential for the next downward wave to 1.0970 will open. The target is local.
USDJPY, “US Dollar vs Japanese Yen”
USDJPY formed a consolidation range around the 149.80 level. With the upside exit, the market opened up the potential for trend continuation to 151.51. Today, we expect this level to work out and start a correction to 149.80.
USDCHF, “US Dollar vs Swiss Franc”
USDCHF continues to form a rising wave towards the 1.0099 level. The target is local. After its accomplishment, we will consider the probability of correction to the level of 0.9911. Further, the growth is to the level of 1.0350.
AUDUSD, “Australian Dollar vs US Dollar”
AUDUSD worked off an upside wave to 0.6353. Today the market is forming another wave of decline to 0.6190 (at least). Further, the correction to the level of 0.6277. Then a decline to 0.6170.
BRENT
Brent continues to form a consolidation range above 92.12. An upside exit would open up the potential for a rise to 95.30. The target is the first one. After this level is reached, the correction to 92.00 is expected.
XAUUSD, “Gold vs US Dollar”
Gold has worked off a correction wave to 1640.00. Today, the market continues a downward wave towards 1610.00. After working out this level, a correction link to 1630.00 is not excluded. Further – decrease to the level of 1600.00.
S&P 500
The S&P index worked off a correction to 3647.0. Today the market is forming a consolidation range above it. With the exit from it upwards we will consider the development of the next growth wave to 3861.4. Then – continuation of the trend downwards, to the level of 3494.0.
Attention! Forecasts presented in this section only reflect the author’s private opinion and should not be considered as guidance for trading. RoboForex LP bears no responsibility for trading results based on trading recommendations described in these analytical reviews.
The British pound sterling is down against the US dollar on Friday. The current quote in GBPUSD is 1.1190. So, another political intrigue in the UK has been resolved. Prime Minister Liz Truss has resigned over the consequences of the economic programme she was promoting. “A ‘split’ in the ranks of the Conservative Party is unusual in itself. But when you remember that Truss proposed to reduce taxes by increasing the national debt and at the same time reducing confidence in the British economy in general, everything falls into place.
Truss’ resignation came a day after the minister of the interior stepped down. Earlier, the finance minister had left their post.
For now the political debate and the search for a new head of government will remain the “focus” of market attention.
At the same time, it is worth keeping an eye on what the Bank of England will do now. Earlier comments were made by its representatives that rates might not rise as quickly as the markets would like them to. The English regulator is facing a fantastically difficult task in reducing inflationary pressures. The consumer price index has reached double digits and for conservative England this is a huge “stress”.
Attention! Forecasts presented in this section only reflect the author’s private opinion and should not be considered as guidance for trading. RoboForex LP bears no responsibility for trading results based on trading recommendations described in these analytical reviews.
Philadelphia Fed President Patrick Harker said Thursday that the central bank has not yet ended its cycle of raising interest rates amid very high inflation, adding that the Central Bank will likely only pause the tightening process next year. Analysts believe that until the difference between US Federal Reserve and ECB interest rates begins to narrow, it is premature to look for a reversal in the euro.
From the technical point of view, the trend on the EUR/USD currency pair on the hourly time frame is bullish. But the price is trading below the moving averages. Indicator MACD has become negative, and the buyers’ pressure is weakening, but active sellers are not observed. Buy trades should be considered from the support level of 0.9752, but with additional confirmation in the form of reverse initiative. Sells may be considered from the resistance level of 0.9848, but also with confirmation.
Alternative scenario: if the price breaks down through the support level of 0.9666 and fixes below it, the downtrend will likely resume.
News feed for 2022.10.21:
– Eurozone EU Leaders Summit (m/m) at 13:00 (GMT+3);
– US FOMC Member Williams Speaks (m/m) at 16:10 (GMT+3).
The GBP/USD currency pair
Technical indicators of the currency pair:
Prev Open: 1.1211
Prev Close: 1.1229
% chg. over the last day: +0.16 %
Unexpected events took place in the UK. Liz Truss announced her resignation as Prime Minister after just 45 days in office, the shortest term ever. Truss faced calls to leave because of the disastrous effects of her mini-budget. The prime minister’s departure provoked a struggle among conservative lawmakers to find a successor. Because of the uncertainty, investors are now advised to avoid speculating about the British pound.
From the technical point of view, the GBP/USD currency pair trend on the hourly time frame is bullish. But the price is trading below the moving averages. The MACD indicator has become negative, indicating a weakness of the buyers. Under such market conditions, buy trades can be considered from the support level of 1.1186, but better after confirmation. It is better to look for sell trades on the intraday time frames, and the nearest resistance level is 1.1311.
Alternative scenario: if the price breaks down of the 1.1094 support level and fixes below it, the downtrend will likely resume.
News feed for 2022.10.21:
– UK Retail Sales (m/m) at 09:00 (GMT+3).
The USD/JPY currency pair
Technical indicators of the currency pair:
Prev Open: 149.87
Prev Close: 150.12
% chg. over the last day: +0.17 %
On Thursday, the yen broke above the key psychological level of 150 to the dollar for the first time since 1990, despite repeated threats by Japanese policymakers to intervene to eliminate excessive volatility in the currency market. The dollar/yen pair’s break above the key level increases pressure on Tokyo to re-enter the foreign exchange market to curb the national currency’s inevitable decline. Especially given that Japan’s consumer inflation has reached a 31-year high.
Trading recommendations
Support levels: 149.47, 147.67, 146.44, 145.93, 144.91, 144.16, 143.00
Resistance levels: 150.00
From the technical point of view, the medium-term trend on the currency pair USD/JPY is bullish. The price is trading above the moving levels. The price is trading above the moving average lines. The MACD indicator is in the positive zone, the buyer’s pressure remains, but the divergence is increasing, which indicates a soon corrective movement. Under such market conditions, buy trades can be searched for on intraday time frames from the support level of 149.47, but with confirmation. Sell deals can be searched from the resistance level of 150.00, but only with additional confirmation in the form of a reverse initiative or a false breakout.
Alternative scenario: If the price fixes below 147.67, the downtrend will likely resume.
News feed for 2022.10.21:
– Japan National Consumer Price Index (m/m) at 02:30 (GMT+3).
The USD/CAD currency pair
Technical indicators of the currency pair:
Prev Open: : 1.3759
Prev Close: 1.3766
% chg. over the last day: +0.05 %
Economists expect the Bank of Canada to continue its aggressive campaign to raise rates after higher-than-expected inflation data. Bank of Montreal’s chief economist expects 75 basis points (bps) increase next week. The move will raise the overnight rate to 4%. In addition, he predicts a 25 basis point hike in December. The deputy chief economist at CIBC also predicts a 0.75% rate hike.
Trading recommendations
Support levels: 1.3677, 1.3619, 1.3583, 1.3535, 1.3454
Resistance levels: 1.3786, 1.3855, 1.3968
From the point of view of technical analysis, the trend on the USD/CAD currency pair is bullish. The price is trading at the level of moving averages. The MACD indicator has become inactive, forming a wide sideways. Under such market conditions, buy trades should be considered on the lower time frames from the support level of 1.3677 but better after confirmation. For selling, it is better to consider the resistance level of 1.3786, but only after an additional confirmation in the form of a reverse initiative.
Alternative scenario: if the price breaks down and consolidates below the support level of 1.3677, the downtrend will likely resume.
This article reflects a personal opinion and should not be interpreted as an investment advice, and/or offer, and/or a persistent request for carrying out financial transactions, and/or a guarantee, and/or a forecast of future events.