By Analytical Department RoboForex
GBP/USD declined to 1.3352 on Wednesday amid a general deterioration in the external environment and a decline in risk appetite. The escalation of tensions in the Strait of Hormuz and Iran’s attacks on facilities in Kuwait and Bahrain have prompted investors to move away from riskier assets.
Earlier, the pound had appeared more resilient, supported by oil prices rising above 72 USD per barrel and the associated inflationary risks. Market participants are currently pricing in approximately a 76% probability of a Bank of England rate hike before year-end, with the likelihood of tightening as early as November exceeding 50%.
Bank of England Governor Andrew Bailey recently confirmed that inflation remains on a path towards the 2% target but acknowledged that this process will take longer than previously expected. At the same time, the regulator does not see scope for reducing interest rates in the near future.
Political uncertainty in the UK has had a limited impact on the market so far. The favourite for the post of Prime Minister, Andy Burnham, has yet to announce his candidate for Chancellor of the Exchequer. However, investors believe that much of the domestic political risk has already been priced into the pound’s exchange rate.
Technical Analysis
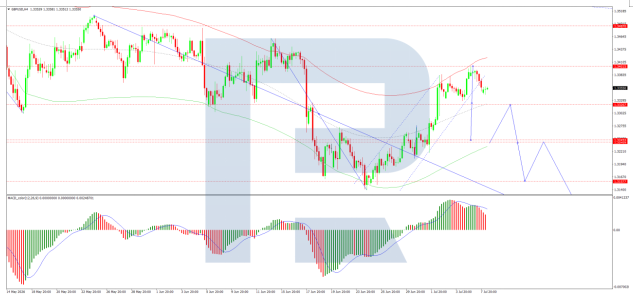
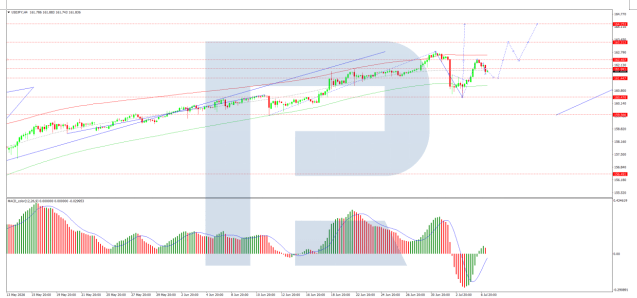
On the H4 GBP/USD chart, the market is moving lower towards 1.3240. A wide consolidation range is forming around this level. An upside breakout from this range would open the way for a move towards 1.3480, while a downside breakout would suggest a decline towards 1.3290, with scope for the trend to extend to 1.3090. The MACD indicator supports this scenario, with its signal line above zero and pointing firmly downwards, reflecting continued bearish momentum.
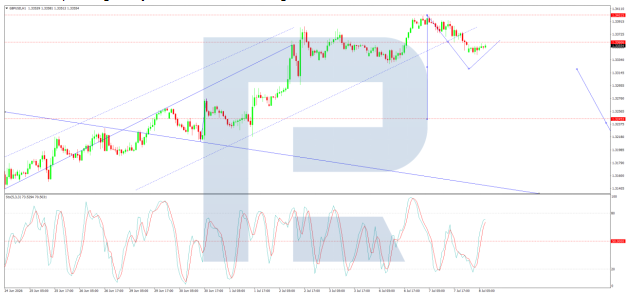
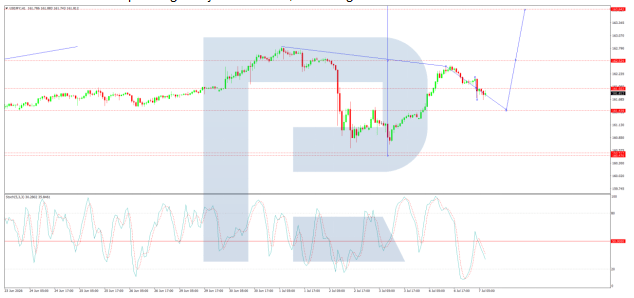
On the H1 chart, the market has formed a compact consolidation range around the 1.3360 level, currently extending down to 1.3340. A move higher towards 1.3360 is expected, followed by a decline to 1.3320. The Stochastic oscillator confirms this scenario, with its signal line below 80 and pointing downwards towards 20, indicating increasing short-term downside pressure.
Conclusion
Sterling has retreated as deteriorating geopolitical conditions in the Middle East – including attacks on Gulf states and heightened tensions in the Strait of Hormuz – have dampened risk appetite. The pound had previously found support from rising oil prices and market expectations of further Bank of England tightening, with a 76% probability of a rate hike priced in by year-end. Governor Bailey’s confirmation that inflation remains above target and that rate cuts are not imminent has reinforced the hawkish outlook. While domestic political uncertainty appears largely priced in, the pound’s near-term trajectory will depend on how geopolitical risks evolve. Technically, further downside towards 1.3240 and potentially 1.3090 appears likely in the medium term.
Disclaimer
Any forecasts contained herein are based on the author’s particular opinion. This analysis may not be treated as trading advice. RoboForex bears no responsibility for trading results based on trading recommendations and reviews contained herein.