By JustMarkets
By the end of the day, the Dow Jones Index (US30) fell by 0.03%. The S&P 500 Index (US500) declined by 0.22%. The Technology‑heavy NASDAQ Index (US100) closed lower by 1.54%. Investors began to doubt the justification for high investments in AI, which led to a collapse in Micron Technology shares by -10.6%, AMD fell by -6.9%, and Intel by -9%. Meanwhile, the Dow Jones remained almost unchanged, as companies from “non‑tech” sectors limited the overall market decline.
Speaking at the ECB forum in Sintra, Fed Chair Kevin Warsh reaffirmed the regulator’s commitment to achieving the 2% inflation target despite the recent stabilization of price pressures. The head of the regulator emphasized the preservation of the Fed’s institutional independence and announced the final abandonment of the “forward guidance” practice, shifting to a fully data‑dependent decision‑making model. Considering that at the June meeting the Fed adopted a hawkish stance with an emphasis on potential rate hikes before the end of the year, the abandonment of preliminary guidance increases volatility in expectations and underscores the institution’s determination to maintain restrictive conditions until the downward inflation trend becomes sustainable.
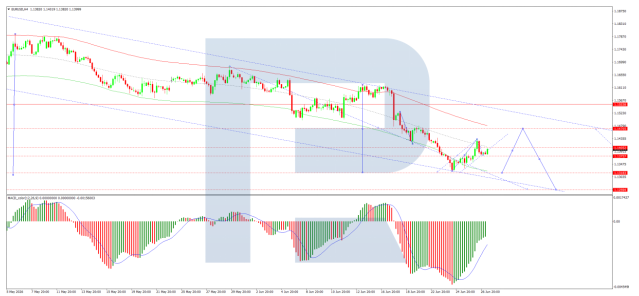
European indices closed mixed on Wednesday. By the end of the day, Germany’s DAX (DE40) rose by 0.18%, France’s CAC 40 (FR40) closed down 0.79%, Spain’s IBEX 35 (ES35) declined by 0.34%, and the UK’s FTSE 100 (UK100) finished the trading session lower by 0.18%. Preliminary data for June 2026 indicated a significant slowdown in Eurozone inflation to 2.8% from 3.2% in May, which was noticeably below market expectations of 3.0%. This is the lowest reading since February, achieved thanks to a substantial decline in energy price growth to 8.7%, as well as cooling inflationary pressure in services to 3.2% and food to 1.6%. The core Index, excluding volatile energy and food components, also fell to 2.4%, indicating a gradual weakening of overall price pressure. Positive dynamics were observed in almost all major economies of the bloc, with indicators in Germany, France, and Italy declining significantly, while Spain maintained inflation at 3.6%.
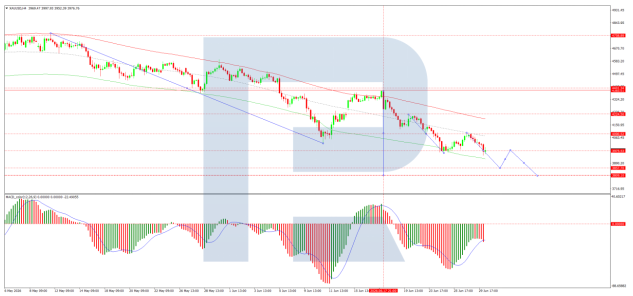
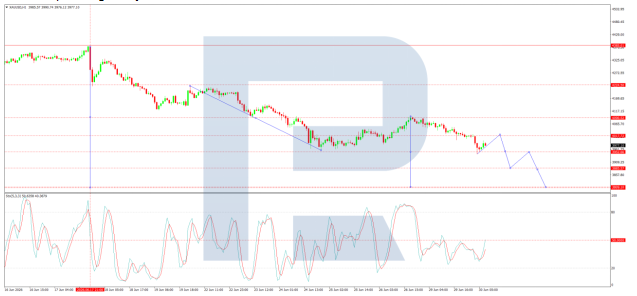
On Wednesday, crude oil prices fell below the psychological mark of 68 dollars per barrel, updating to a four‑month low amid signs of de‑escalation in the Strait of Hormuz. The resumption of shipping and constructive indirect negotiations between the US and Iran in Qatar reduced the geopolitical premium in energy prices, triggering a wave of selling in the markets. Pressure on prices is also being exerted by the fundamental factor of oversupply. Despite Tehran maintaining claims to administrative control over the strait, the partial restoration of tanker flows has significantly eased market participants’ concerns about the stability of global supplies, forcing investors to revise their positions toward a bearish scenario.
On Wednesday, Japan’s Nikkei 225 (JP225) rose by 0.59%, China’s FTSE China A50 closed lower by 1.15%, Hong Kong’s Hang Seng (HK50) did not trade yesterday, and Australia’s ASX 200 (AU200) closed lower yesterday by 0.64%.
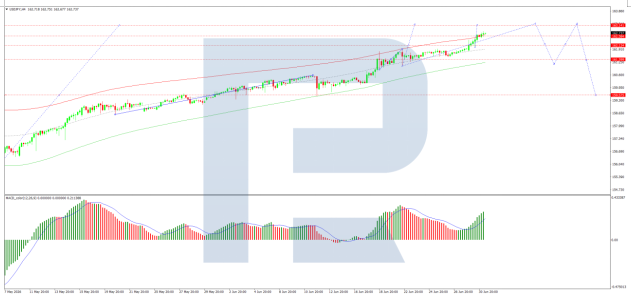
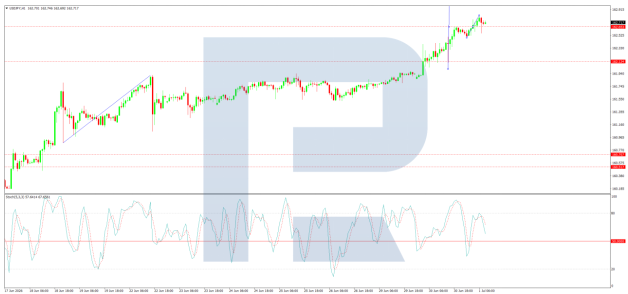
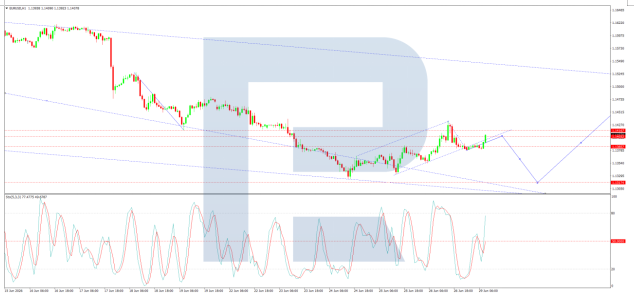
The Australian dollar continues to consolidate near a three‑month low below 0.690 USD under pressure from weak macroeconomic data and revised market expectations for monetary policy. The unexpected trade deficit for May of 3.02 billion Australian dollars, the worst figure since late 2015, resulted from a decline in export shipments alongside a record high in imports, which significantly worsened investor sentiment. As a result, markets sharply reduced the probability of an August rate hike by the Reserve Bank of Australia to 15%, with every second market participant now expecting the tightening cycle to end.
S&P 500 (US500) 7,483.23 -16.13 (-0.22%)
Dow Jones (US30) 52,305.24 -13.96 (-0.03%)
DAX (DE40) 25,040.28 +44.47 (+0.18%)
FTSE 100 (UK100) 10,497.12 -18.78 (-0.18%)
USD Index 101.42 +0.23 (+0.23%)
News feed for: 2026.07.02
- Australia Trade Balance (m/m) at 04:30 (GMT+3) – AUD (MED)
- Switzerland Inflation Rate (m/m) at 09:30 (GMT+3) – CHF (HIGH)
- Eurozone Unemployment Rate (m/m) at 12:00 (GMT+3) – EUR (MED)
- US Initial Jobless Claims (m/m) at 15:30 (GMT+3) – USD (MED)
- US Nonfarm Payrolls (m/m) at 15:30 (GMT+3) – USD (HIGH)
- US Unemployment Rate (m/m) at 15:30 (GMT+3) – USD (HIGH)
- US Average Hourly Earnings (m/m) at 15:30 (GMT+3) – USD (HIGH)
- Canada Manufacturing PMI (m/m) at 16:30 (GMT+3) – CAD (MED)
- US Natural Gas Storage (w/w) at 17:30 (GMT+3) – XNG (HIGH)
By JustMarkets
This article reflects a personal opinion and should not be interpreted as an investment advice, and/or offer, and/or a persistent request for carrying out financial transactions, and/or a guarantee, and/or a forecast of future events.