
By RoboForex Analytical Department
Brent crude oil prices fell to a four-week low of 86.50 USD on Monday, influenced by several contributing factors. The primary cause of the decline was a reduction in geopolitical tensions as Iran’s rhetoric toward Israel showed signs of de-escalation. This change is significant given that Iran is the third-largest OPEC oil producer, with substantial exports to China and other countries, making stability in the region crucial for global oil markets.
On the demand side, US crude oil inventories rose 2.7 million barrels for the week, nearly double what was anticipated. This unexpected increase has put additional pressure on oil prices.
Furthermore, global economic uncertainties and concerns that the Federal Reserve may maintain elevated interest rates for an extended period also impact the outlook for oil demand. Heightened interest rates tend to strengthen the US dollar, making oil, priced in dollars, more expensive for holders of other currencies. However, the current stability of the US dollar is providing some support, preventing even steeper declines in oil prices.
Technical analysis of Brent
Free Reports:
 Get our Weekly Commitment of Traders Reports - See where the biggest traders (Hedge Funds and Commercial Hedgers) are positioned in the futures markets on a weekly basis.
 Download Our Metatrader 4 Indicators – Put Our Free MetaTrader 4 Custom Indicators on your charts when you join our Weekly Newsletter
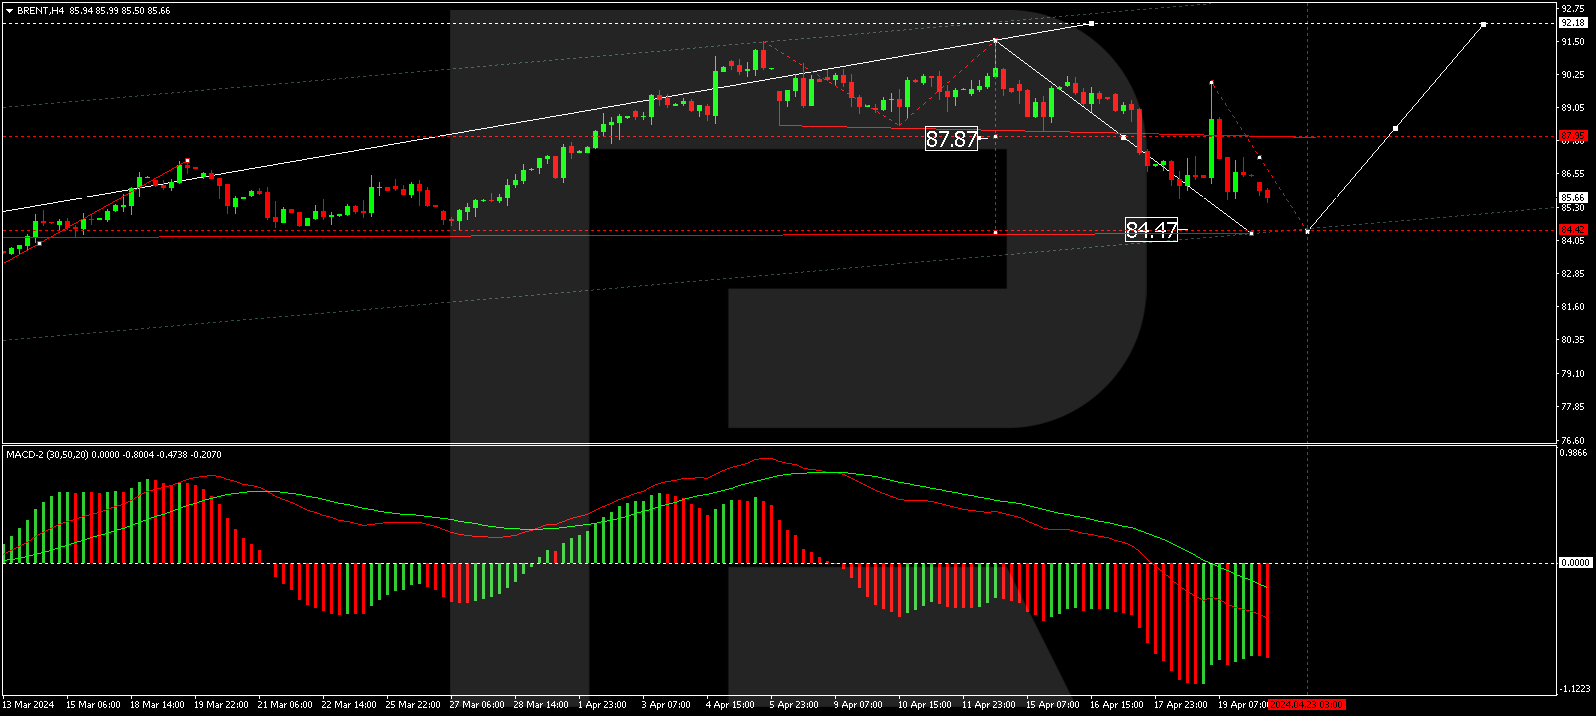
On the H4 chart, Brent established a consolidation range at around 87.87. The downward breakout from this range initiated a correction wave to 84.48. After reaching this target, the market may see a rebound towards 92.00, potentially continuing towards 95.00. This bullish scenario is supported by the MACD indicator, currently below zero, suggesting that the lows may soon be updated.
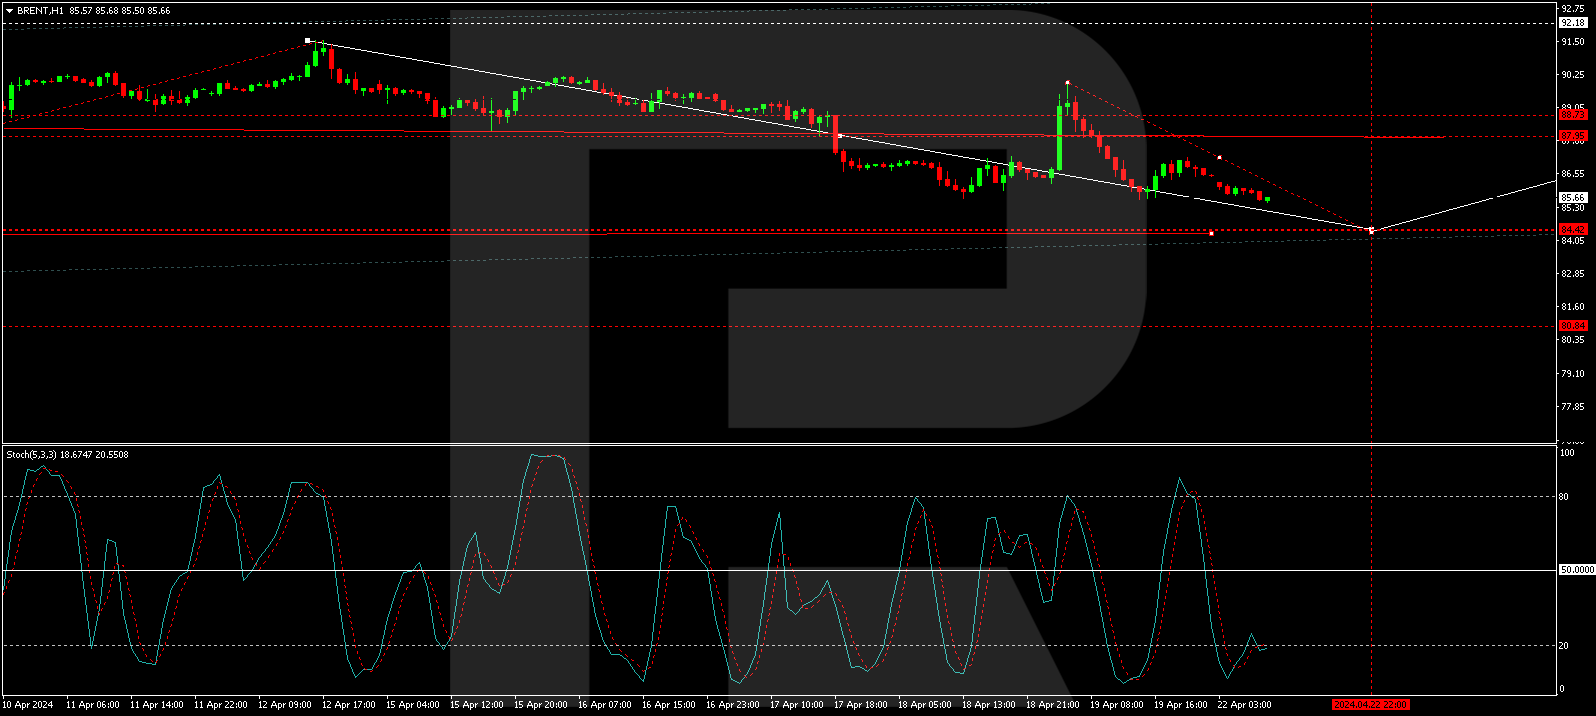
The H1 chart shows that Brent is forming the fifth correction structure towards 84.48. Once this level is reached, there may be potential for a rebound to 87.87 (testing from below). A successful breakout from this range upward could lead to further growth towards 90.50, with a possible continuation to 92.00. The Stochastic oscillator, currently below 20, indicates readiness to initiate a new growth structure towards higher levels, supporting the possibility of an upward trend resuming after the correction.
Disclaimer
Any forecasts contained herein are based on the author’s particular opinion. This analysis may not be treated as trading advice. RoboForex bears no responsibility for trading results based on trading recommendations and reviews contained herein.

- Geopolitical and macroeconomic conditions continue to pressure market sentiment Jul 20, 2026
- USD/JPY Poised to Continue Gains as Expensive Oil and Lack of Support Weigh on Yen Jul 20, 2026
- COT Metals Charts: Weekly Speculator Bets led by Copper & Steel Jul 18, 2026
- COT Bonds Charts: Weekly Speculator Bets led by 2-Year, SOFR 3M & 5-Year Bonds Jul 18, 2026
- COT Energy Charts: Weekly Speculator Bets led by Brent Oil & Heating Oil Jul 18, 2026
- COT Soft Commodities Charts: Weekly Speculator Bets led by Wheat, Corn & Soybean Meal Jul 18, 2026
- The Bank of Canada kept its interest rate unchanged. Platinum prices reached a three‑week high Jul 16, 2026
- Stock indices rose after the release of US inflation data. China’s GDP slowed sharply Jul 15, 2026
- GBP/USD Awaits Political News: What Will Happen Next Jul 15, 2026
- USD/JPY Holds at Highs: Pressure Lingers on Yen Jul 14, 2026
