By InvestMacro
Here are the latest charts and statistics for the Commitment of Traders (COT) reports data published by the Commodities Futures Trading Commission (CFTC).
The latest COT data is updated through Tuesday October 31st and shows a quick view of how large traders (for-profit speculators and commercial entities) were positioned in the futures markets.
Weekly Speculator Changes led by Soybean Meal & Coffee
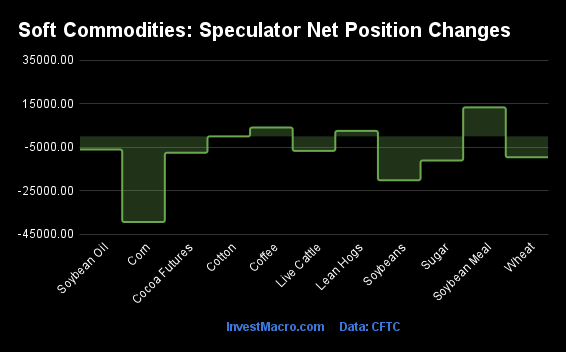
The COT soft commodities markets speculator bets were lower this week as just three out of the eleven softs markets we cover had higher positioning while the other eight markets had lower speculator contracts.
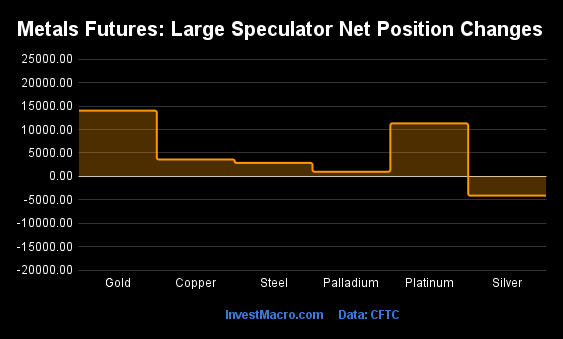
Leading the gains for the softs markets was Soybean Meal (13,342 contracts) with Coffee (4,071 contracts) and Lean Hogs (2,532 contracts) also recording a positive week.
The markets with declines in speculator bets this week were Corn (-39,416 contracts), Soybeans (-20,194 contracts), Sugar (-11,106 contracts), Wheat (-9,620 contracts), Cocoa (-7,543 contracts), Live Cattle (-6,671 contracts), Soybean Oil (-6,037 contracts) and Cotton (-16 contracts) also seeing lower bets on the week.
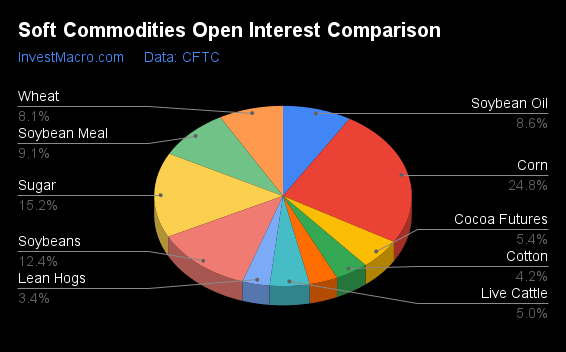
| Oct-31-2023 | OI | OI-Index | Spec-Net | Spec-Index | Com-Net | COM-Index | Smalls-Net | Smalls-Index |
|---|
| WTI Crude | 1,671,255 | 24 | 262,258 | 31 | -308,767 | 67 | 46,509 | 73 |
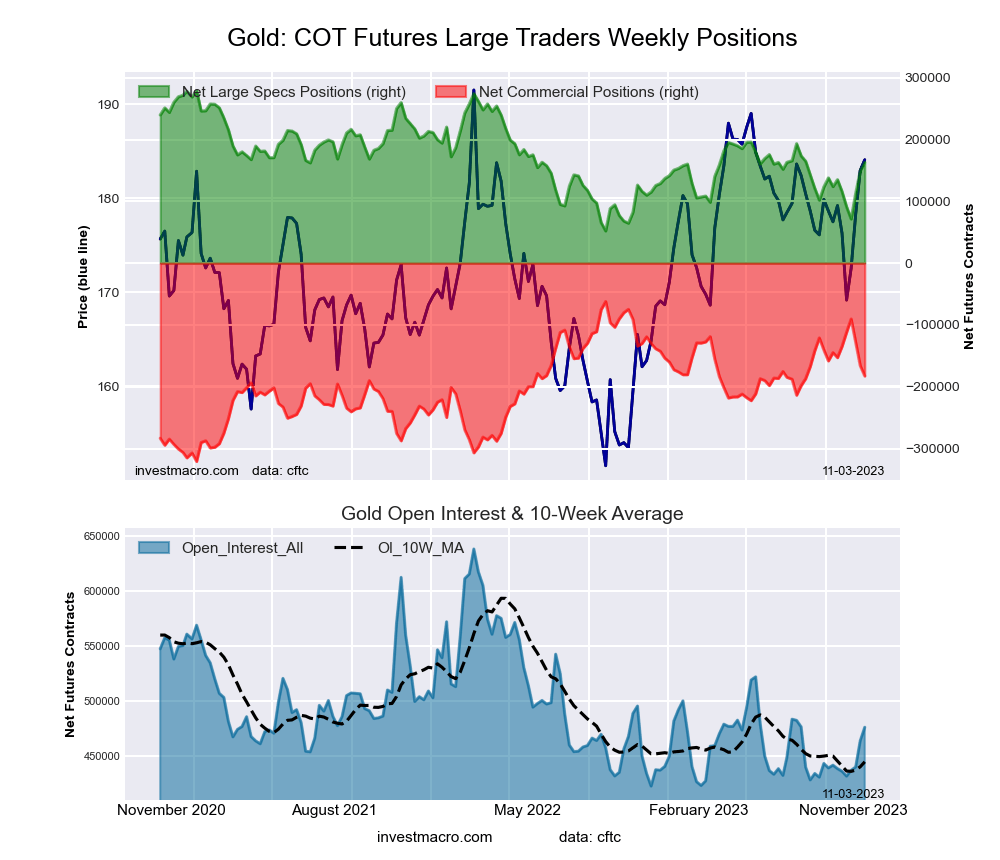
| Gold | 475,808 | 25 | 163,425 | 49 | -182,707 | 53 | 19,282 | 31 |
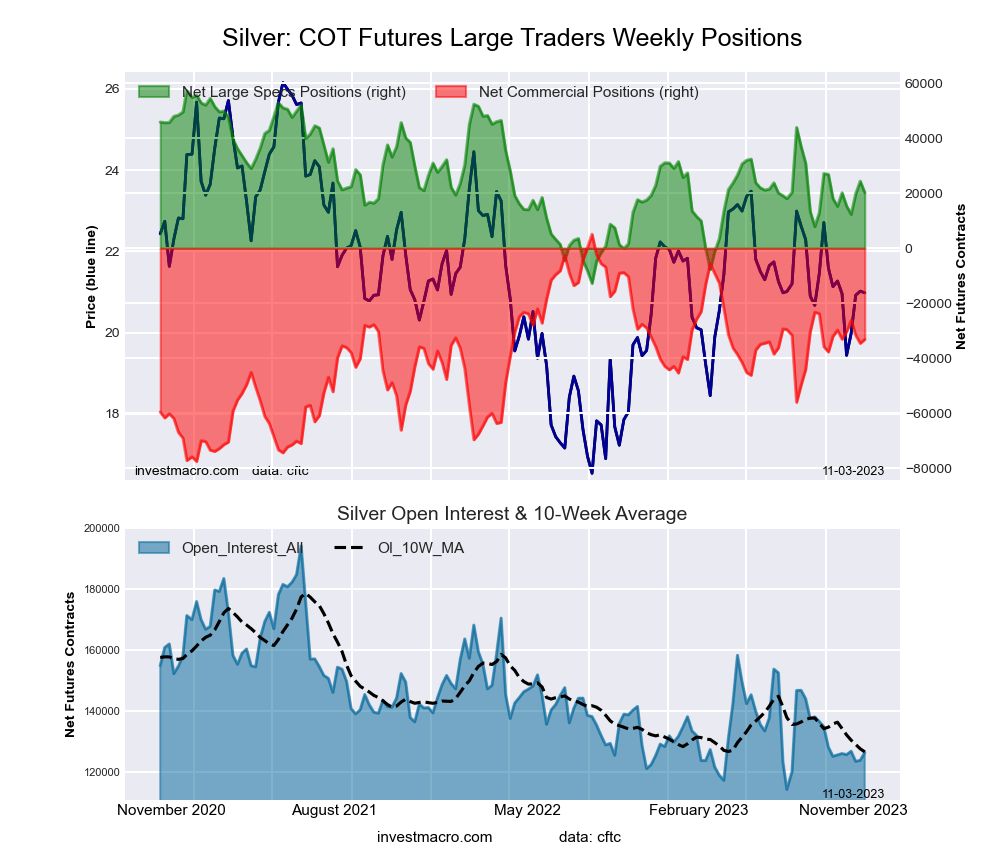
| Silver | 126,549 | 15 | 20,211 | 47 | -33,139 | 54 | 12,928 | 38 |
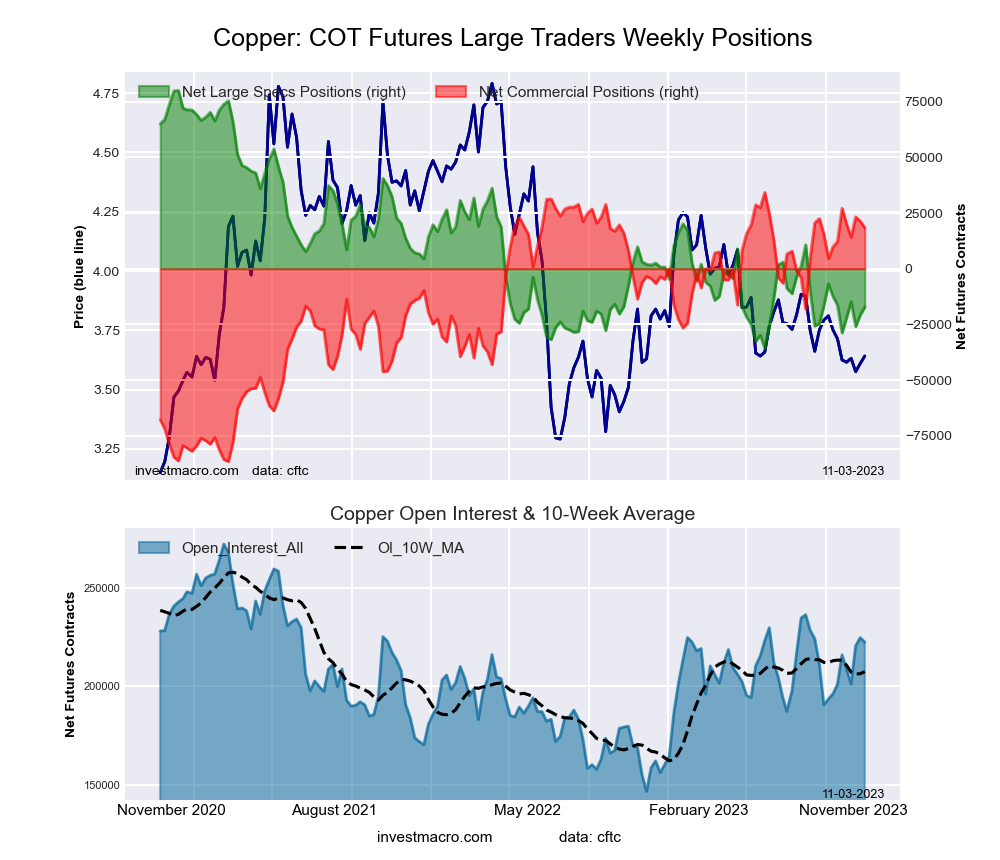
| Copper | 222,566 | 60 | -17,161 | 16 | 18,395 | 87 | -1,234 | 11 |
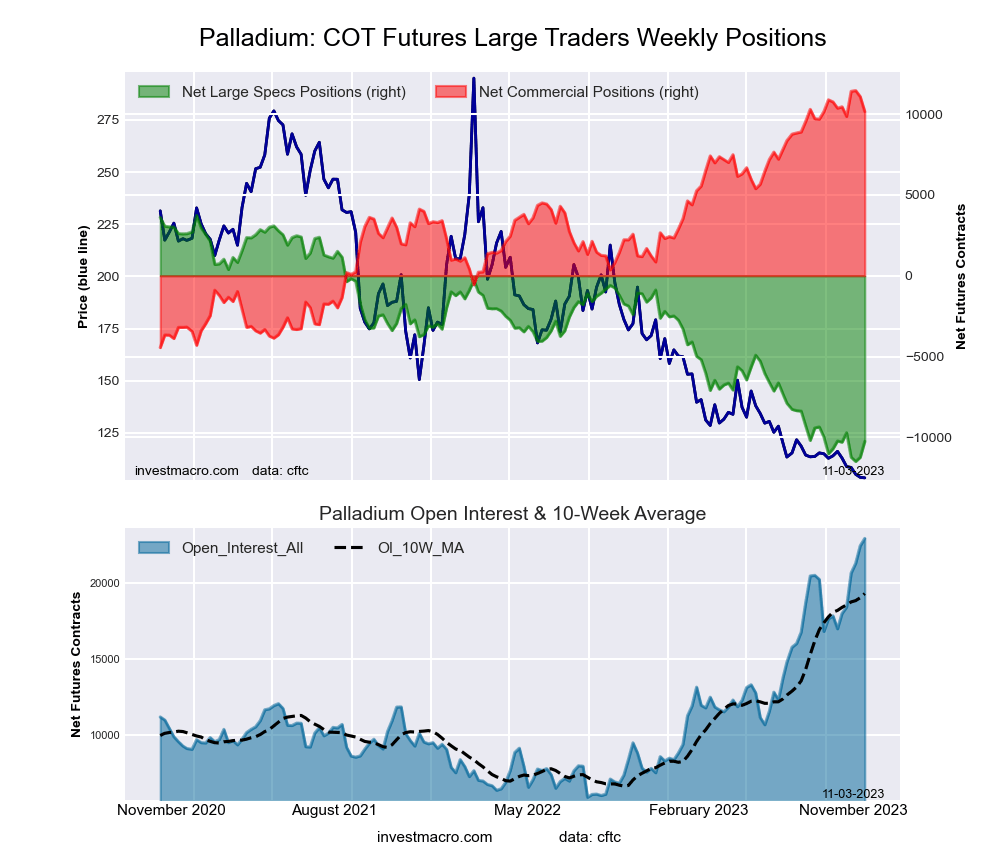
| Palladium | 22,943 | 100 | -10,253 | 8 | 10,163 | 92 | 90 | 47 |
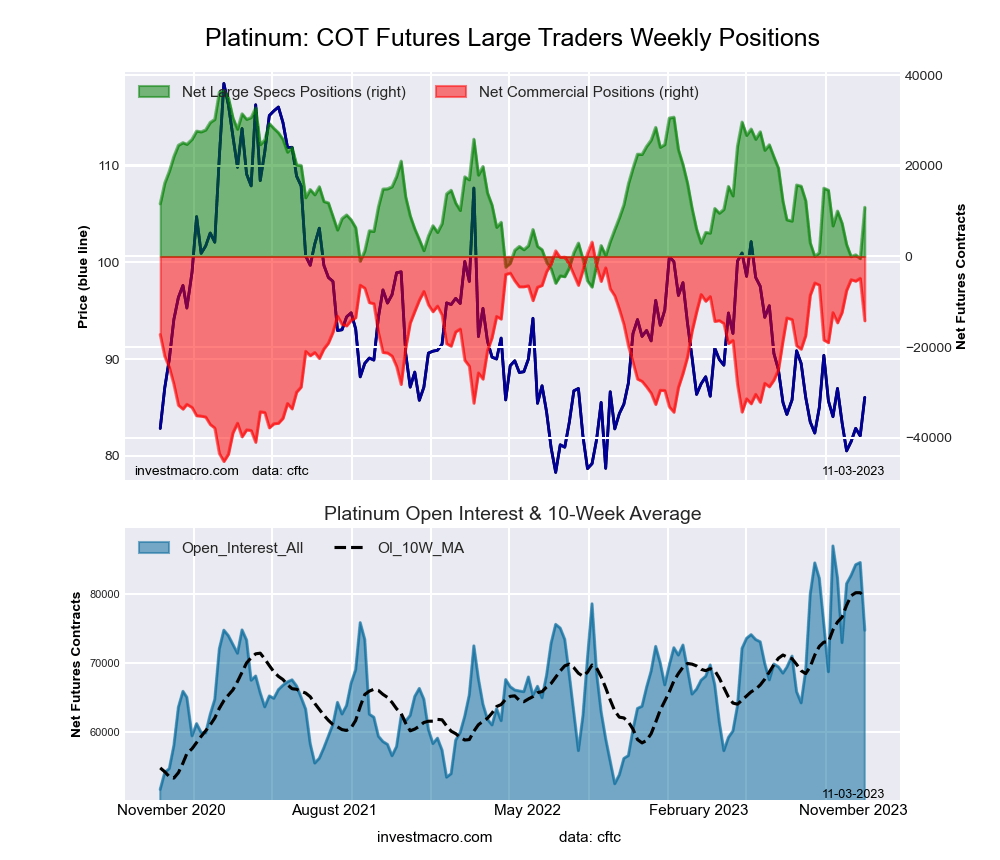
| Platinum | 74,768 | 65 | 10,826 | 41 | -14,186 | 64 | 3,360 | 13 |
| Natural Gas | 1,186,140 | 46 | -54,652 | 53 | 39,924 | 52 | 14,728 | 15 |
| Brent | 139,933 | 19 | -31,488 | 51 | 28,628 | 51 | 2,860 | 50 |
| Heating Oil | 299,928 | 36 | 31,391 | 80 | -52,127 | 27 | 20,736 | 66 |
| Soybeans | 706,923 | 35 | 16,260 | 0 | -1,813 | 96 | -14,447 | 69 |
| Corn | 1,412,108 | 29 | -87,696 | 5 | 114,053 | 94 | -26,357 | 98 |
| Coffee | 203,130 | 20 | 22,279 | 50 | -21,876 | 54 | -403 | 8 |
| Sugar | 865,859 | 40 | 213,589 | 68 | -258,587 | 30 | 44,998 | 61 |
| Wheat | 460,210 | 100 | -69,567 | 17 | 68,593 | 84 | 974 | 72 |
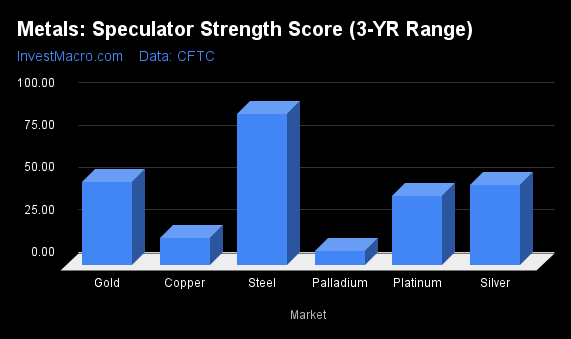
Strength Scores led by Cocoa & Sugar
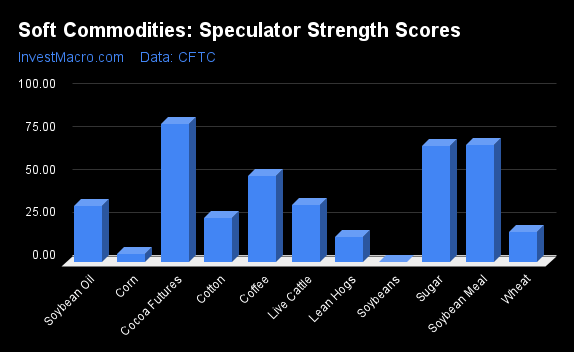
COT Strength Scores (a normalized measure of Speculator positions over a 3-Year range, from 0 to 100 where above 80 is Extreme-Bullish and below 20 is Extreme-Bearish) showed that Cocoa (81 percent) and Sugar (68 percent) led the softs markets this week. Soybean Meal (68 percent) and Coffee (50 percent) come in as the next highest with strength scores above 50 percent.
On the downside, Soybeans (0 percent), Corn (5 percent), Lean Hogs (15 percent) and the Wheat (17 percent) come in at the lowest strength levels currently and are in Extreme-Bearish territory (below 20 percent).
Strength Statistics:
Corn (4.6 percent) vs Corn previous week (10.5 percent)
Sugar (67.9 percent) vs Sugar previous week (71.9 percent)
Coffee (50.3 percent) vs Coffee previous week (46.1 percent)
Soybeans (0.0 percent) vs Soybeans previous week (7.6 percent)
Soybean Oil (32.7 percent) vs Soybean Oil previous week (36.2 percent)
Soybean Meal (68.1 percent) vs Soybean Meal previous week (60.6 percent)
Live Cattle (33.1 percent) vs Live Cattle previous week (40.3 percent)
Lean Hogs (14.7 percent) vs Lean Hogs previous week (12.6 percent)
Cotton (25.8 percent) vs Cotton previous week (25.8 percent)
Cocoa (80.8 percent) vs Cocoa previous week (88.5 percent)
Wheat (17.4 percent) vs Wheat previous week (24.2 percent)
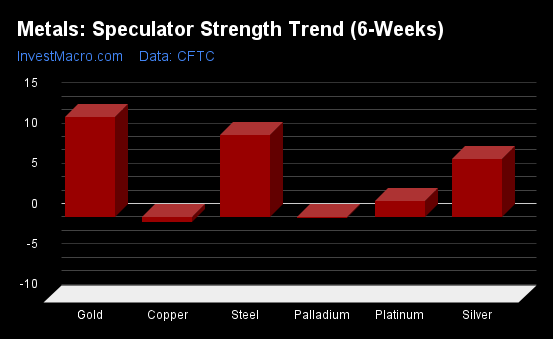
Coffee & Soybean Meal top the 6-Week Strength Trends
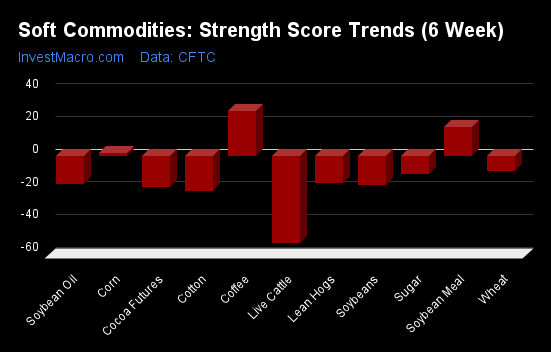
COT Strength Score Trends (or move index, calculates the 6-week changes in strength scores) showed that Coffee (27 percent) and Soybean Meal (18 percent) lead the past six weeks trends for soft commodities. Corn (2 percent) is the only other positive mover in the latest trends data.
Live Cattle (-53 percent) leads the downside trend scores currently with Cotton (-21 percent), Cocoa (-19 percent), Soybeans (-18 percent) and Soybean Oil (-17 percent) following next with lower trend scores.
Strength Trend Statistics:
Corn (2.0 percent) vs Corn previous week (6.0 percent)
Sugar (-11.1 percent) vs Sugar previous week (-7.1 percent)
Coffee (27.4 percent) vs Coffee previous week (35.7 percent)
Soybeans (-17.5 percent) vs Soybeans previous week (-18.3 percent)
Soybean Oil (-17.1 percent) vs Soybean Oil previous week (-8.6 percent)
Soybean Meal (18.1 percent) vs Soybean Meal previous week (10.0 percent)
Live Cattle (-53.2 percent) vs Live Cattle previous week (-38.5 percent)
Lean Hogs (-16.2 percent) vs Lean Hogs previous week (-16.4 percent)
Cotton (-21.4 percent) vs Cotton previous week (-21.6 percent)
Cocoa (-19.2 percent) vs Cocoa previous week (-10.8 percent)
Wheat (-9.0 percent) vs Wheat previous week (-7.3 percent)
Individual Soft Commodities Markets:
CORN Futures:
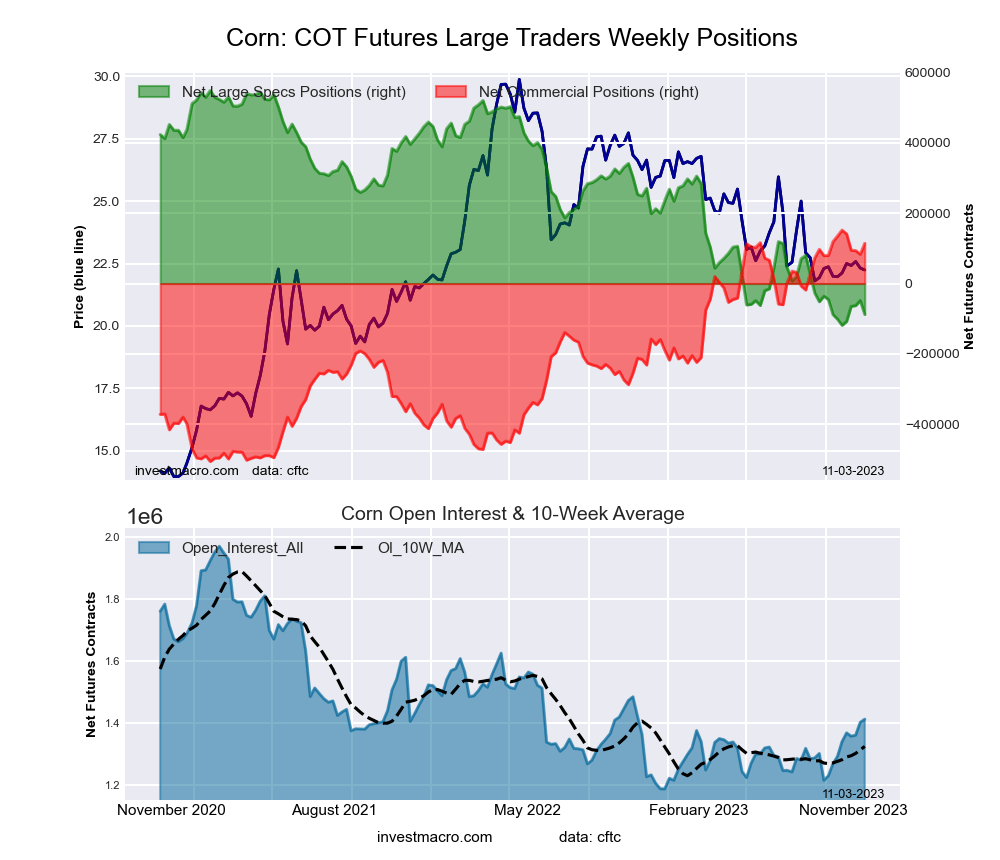 The CORN large speculator standing this week recorded a net position of -87,696 contracts in the data reported through Tuesday. This was a weekly decrease of -39,416 contracts from the previous week which had a total of -48,280 net contracts.
This week’s current strength score (the trader positioning range over the past three years, measured from 0 to 100) shows the speculators are currently Bearish-Extreme with a score of 4.6 percent. The commercials are Bullish-Extreme with a score of 94.3 percent and the small traders (not shown in chart) are Bullish-Extreme with a score of 97.9 percent.
Price Trend-Following Model: Downtrend
Our weekly trend-following model classifies the current market price position as: Downtrend. The current action for the model is considered to be: Hold – Maintain Short Position.
| CORN Futures Statistics | SPECULATORS | COMMERCIALS | SMALL TRADERS |
| – Percent of Open Interest Longs: | 19.8 | 46.7 | 10.2 |
| – Percent of Open Interest Shorts: | 26.0 | 38.6 | 12.1 |
| – Net Position: | -87,696 | 114,053 | -26,357 |
| – Gross Longs: | 278,919 | 659,639 | 144,375 |
| – Gross Shorts: | 366,615 | 545,586 | 170,732 |
| – Long to Short Ratio: | 0.8 to 1 | 1.2 to 1 | 0.8 to 1 |
| NET POSITION TREND: | | | |
| – Strength Index Score (3 Year Range Pct): | 4.6 | 94.3 | 97.9 |
| – Strength Index Reading (3 Year Range): | Bearish-Extreme | Bullish-Extreme | Bullish-Extreme |
| NET POSITION MOVEMENT INDEX: | | | |
| – 6-Week Change in Strength Index: | 2.0 | -3.2 | 12.8 |
SUGAR Futures:
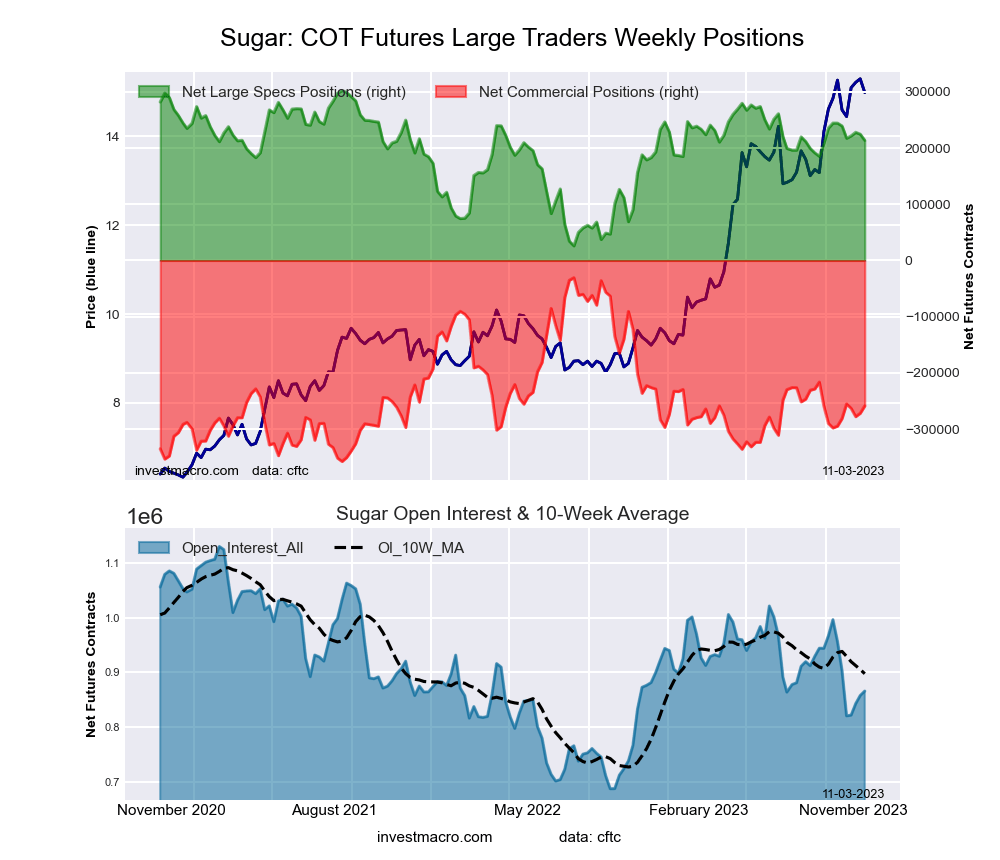 The SUGAR large speculator standing this week recorded a net position of 213,589 contracts in the data reported through Tuesday. This was a weekly decrease of -11,106 contracts from the previous week which had a total of 224,695 net contracts.
This week’s current strength score (the trader positioning range over the past three years, measured from 0 to 100) shows the speculators are currently Bullish with a score of 67.9 percent. The commercials are Bearish with a score of 30.2 percent and the small traders (not shown in chart) are Bullish with a score of 61.1 percent.
Price Trend-Following Model: Uptrend
Our weekly trend-following model classifies the current market price position as: Uptrend. The current action for the model is considered to be: Hold – Maintain Long Position.
| SUGAR Futures Statistics | SPECULATORS | COMMERCIALS | SMALL TRADERS |
| – Percent of Open Interest Longs: | 35.9 | 38.8 | 10.0 |
| – Percent of Open Interest Shorts: | 11.2 | 68.7 | 4.8 |
| – Net Position: | 213,589 | -258,587 | 44,998 |
| – Gross Longs: | 310,643 | 336,357 | 86,511 |
| – Gross Shorts: | 97,054 | 594,944 | 41,513 |
| – Long to Short Ratio: | 3.2 to 1 | 0.6 to 1 | 2.1 to 1 |
| NET POSITION TREND: | | | |
| – Strength Index Score (3 Year Range Pct): | 67.9 | 30.2 | 61.1 |
| – Strength Index Reading (3 Year Range): | Bullish | Bearish | Bullish |
| NET POSITION MOVEMENT INDEX: | | | |
| – 6-Week Change in Strength Index: | -11.1 | 11.0 | -7.0 |
COFFEE Futures:
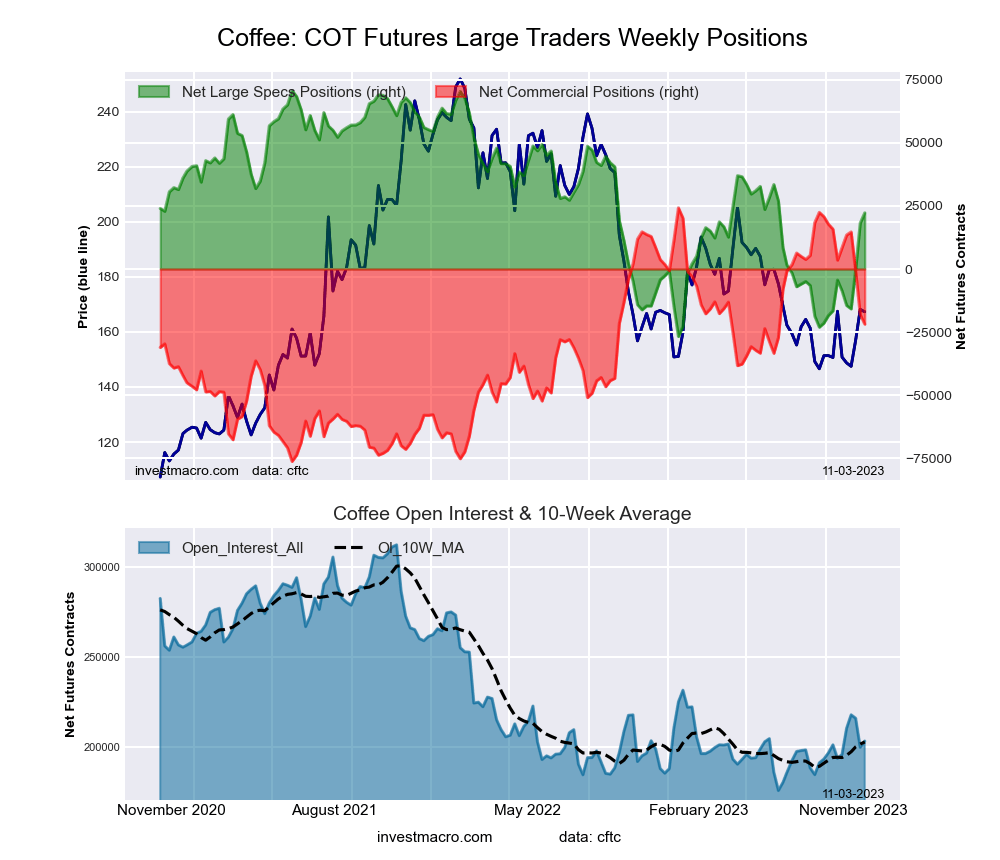 The COFFEE large speculator standing this week recorded a net position of 22,279 contracts in the data reported through Tuesday. This was a weekly gain of 4,071 contracts from the previous week which had a total of 18,208 net contracts.
This week’s current strength score (the trader positioning range over the past three years, measured from 0 to 100) shows the speculators are currently Bullish with a score of 50.3 percent. The commercials are Bullish with a score of 54.1 percent and the small traders (not shown in chart) are Bearish-Extreme with a score of 7.7 percent.
Price Trend-Following Model: Weak Downtrend (Possible Trend Change)
Our weekly trend-following model classifies the current market price position as: Weak Downtrend. The current action for the model is considered to be: Hold – Maintain Short Position.
| COFFEE Futures Statistics | SPECULATORS | COMMERCIALS | SMALL TRADERS |
| – Percent of Open Interest Longs: | 26.9 | 41.9 | 4.8 |
| – Percent of Open Interest Shorts: | 16.0 | 52.6 | 5.0 |
| – Net Position: | 22,279 | -21,876 | -403 |
| – Gross Longs: | 54,727 | 85,014 | 9,706 |
| – Gross Shorts: | 32,448 | 106,890 | 10,109 |
| – Long to Short Ratio: | 1.7 to 1 | 0.8 to 1 | 1.0 to 1 |
| NET POSITION TREND: | | | |
| – Strength Index Score (3 Year Range Pct): | 50.3 | 54.1 | 7.7 |
| – Strength Index Reading (3 Year Range): | Bullish | Bullish | Bearish-Extreme |
| NET POSITION MOVEMENT INDEX: | | | |
| – 6-Week Change in Strength Index: | 27.4 | -25.3 | -15.6 |
SOYBEANS Futures:
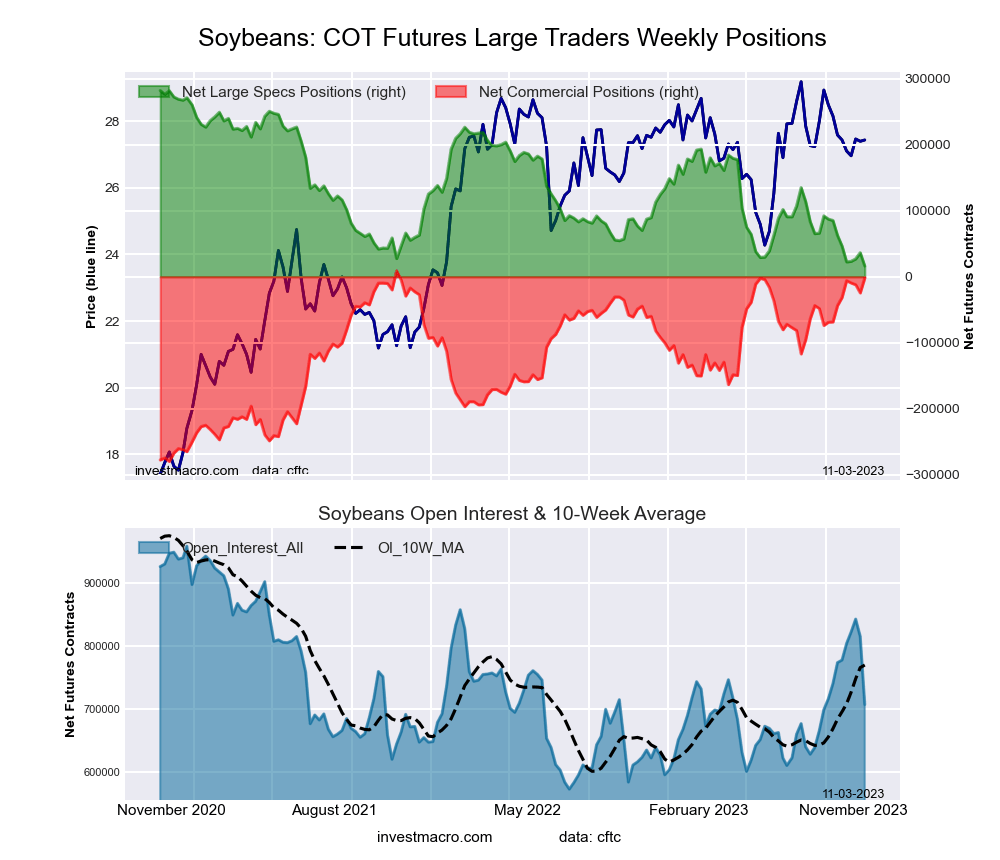 The SOYBEANS large speculator standing this week recorded a net position of 16,260 contracts in the data reported through Tuesday. This was a weekly fall of -20,194 contracts from the previous week which had a total of 36,454 net contracts.
This week’s current strength score (the trader positioning range over the past three years, measured from 0 to 100) shows the speculators are currently Bearish-Extreme with a score of 0.0 percent. The commercials are Bullish-Extreme with a score of 96.2 percent and the small traders (not shown in chart) are Bullish with a score of 69.3 percent.
Price Trend-Following Model: Weak Downtrend (Possible Trend Change)
Our weekly trend-following model classifies the current market price position as: Weak Downtrend. The current action for the model is considered to be: New Sell – Short Position.
| SOYBEANS Futures Statistics | SPECULATORS | COMMERCIALS | SMALL TRADERS |
| – Percent of Open Interest Longs: | 14.7 | 57.2 | 7.0 |
| – Percent of Open Interest Shorts: | 12.4 | 57.4 | 9.0 |
| – Net Position: | 16,260 | -1,813 | -14,447 |
| – Gross Longs: | 103,628 | 404,124 | 49,384 |
| – Gross Shorts: | 87,368 | 405,937 | 63,831 |
| – Long to Short Ratio: | 1.2 to 1 | 1.0 to 1 | 0.8 to 1 |
| NET POSITION TREND: | | | |
| – Strength Index Score (3 Year Range Pct): | 0.0 | 96.2 | 69.3 |
| – Strength Index Reading (3 Year Range): | Bearish-Extreme | Bullish-Extreme | Bullish |
| NET POSITION MOVEMENT INDEX: | | | |
| – 6-Week Change in Strength Index: | -17.5 | 14.5 | 10.8 |
SOYBEAN OIL Futures:
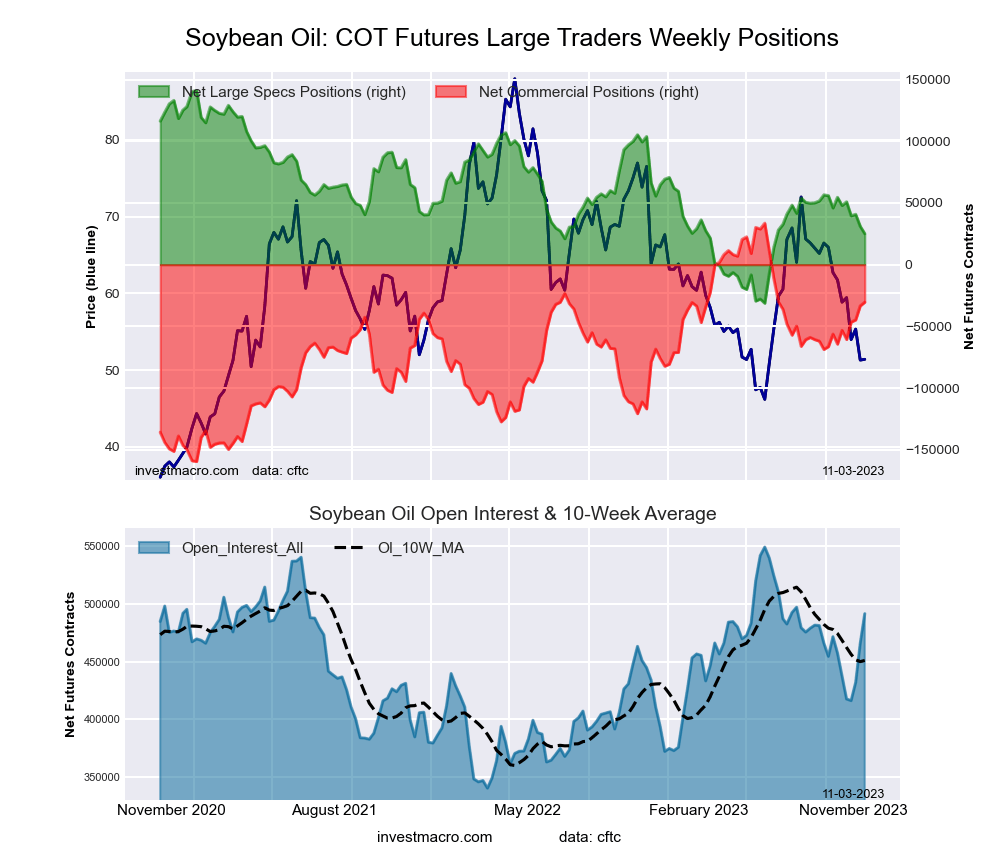 The SOYBEAN OIL large speculator standing this week recorded a net position of 25,102 contracts in the data reported through Tuesday. This was a weekly lowering of -6,037 contracts from the previous week which had a total of 31,139 net contracts.
This week’s current strength score (the trader positioning range over the past three years, measured from 0 to 100) shows the speculators are currently Bearish with a score of 32.7 percent. The commercials are Bullish with a score of 66.8 percent and the small traders (not shown in chart) are Bearish with a score of 33.4 percent.
Price Trend-Following Model: Strong Downtrend
Our weekly trend-following model classifies the current market price position as: Strong Downtrend. The current action for the model is considered to be: Hold – Maintain Short Position.
| SOYBEAN OIL Futures Statistics | SPECULATORS | COMMERCIALS | SMALL TRADERS |
| – Percent of Open Interest Longs: | 21.1 | 49.1 | 6.5 |
| – Percent of Open Interest Shorts: | 16.0 | 55.3 | 5.5 |
| – Net Position: | 25,102 | -30,434 | 5,332 |
| – Gross Longs: | 103,802 | 241,470 | 32,168 |
| – Gross Shorts: | 78,700 | 271,904 | 26,836 |
| – Long to Short Ratio: | 1.3 to 1 | 0.9 to 1 | 1.2 to 1 |
| NET POSITION TREND: | | | |
| – Strength Index Score (3 Year Range Pct): | 32.7 | 66.8 | 33.4 |
| – Strength Index Reading (3 Year Range): | Bearish | Bullish | Bearish |
| NET POSITION MOVEMENT INDEX: | | | |
| – 6-Week Change in Strength Index: | -17.1 | 17.6 | -16.8 |
SOYBEAN MEAL Futures:
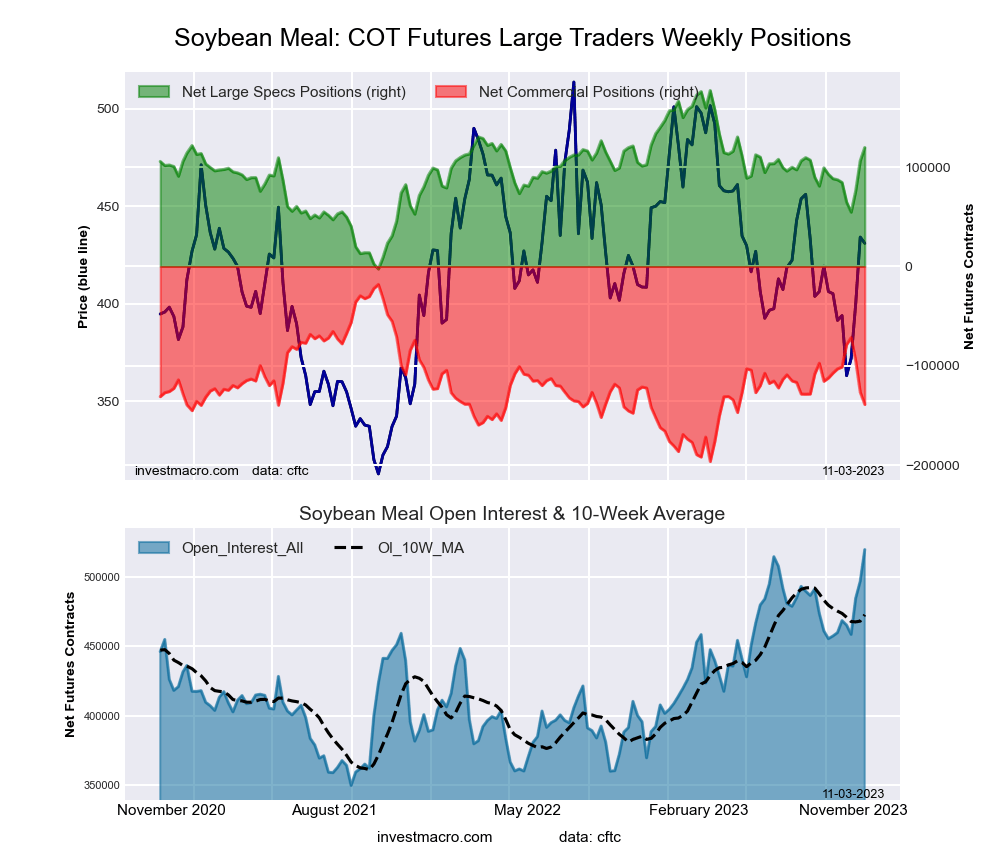 The SOYBEAN MEAL large speculator standing this week recorded a net position of 119,668 contracts in the data reported through Tuesday. This was a weekly gain of 13,342 contracts from the previous week which had a total of 106,326 net contracts.
This week’s current strength score (the trader positioning range over the past three years, measured from 0 to 100) shows the speculators are currently Bullish with a score of 68.1 percent. The commercials are Bearish with a score of 32.2 percent and the small traders (not shown in chart) are Bearish with a score of 41.5 percent.
Price Trend-Following Model: Weak Downtrend (Possible Trend Change)
Our weekly trend-following model classifies the current market price position as: Weak Downtrend. The current action for the model is considered to be: Hold – Maintain Short Position.
| SOYBEAN MEAL Futures Statistics | SPECULATORS | COMMERCIALS | SMALL TRADERS |
| – Percent of Open Interest Longs: | 28.8 | 36.8 | 9.8 |
| – Percent of Open Interest Shorts: | 5.8 | 63.5 | 6.1 |
| – Net Position: | 119,668 | -138,842 | 19,174 |
| – Gross Longs: | 149,649 | 191,134 | 51,015 |
| – Gross Shorts: | 29,981 | 329,976 | 31,841 |
| – Long to Short Ratio: | 5.0 to 1 | 0.6 to 1 | 1.6 to 1 |
| NET POSITION TREND: | | | |
| – Strength Index Score (3 Year Range Pct): | 68.1 | 32.2 | 41.5 |
| – Strength Index Reading (3 Year Range): | Bullish | Bearish | Bearish |
| NET POSITION MOVEMENT INDEX: | | | |
| – 6-Week Change in Strength Index: | 18.1 | -20.1 | 14.8 |
LIVE CATTLE Futures:
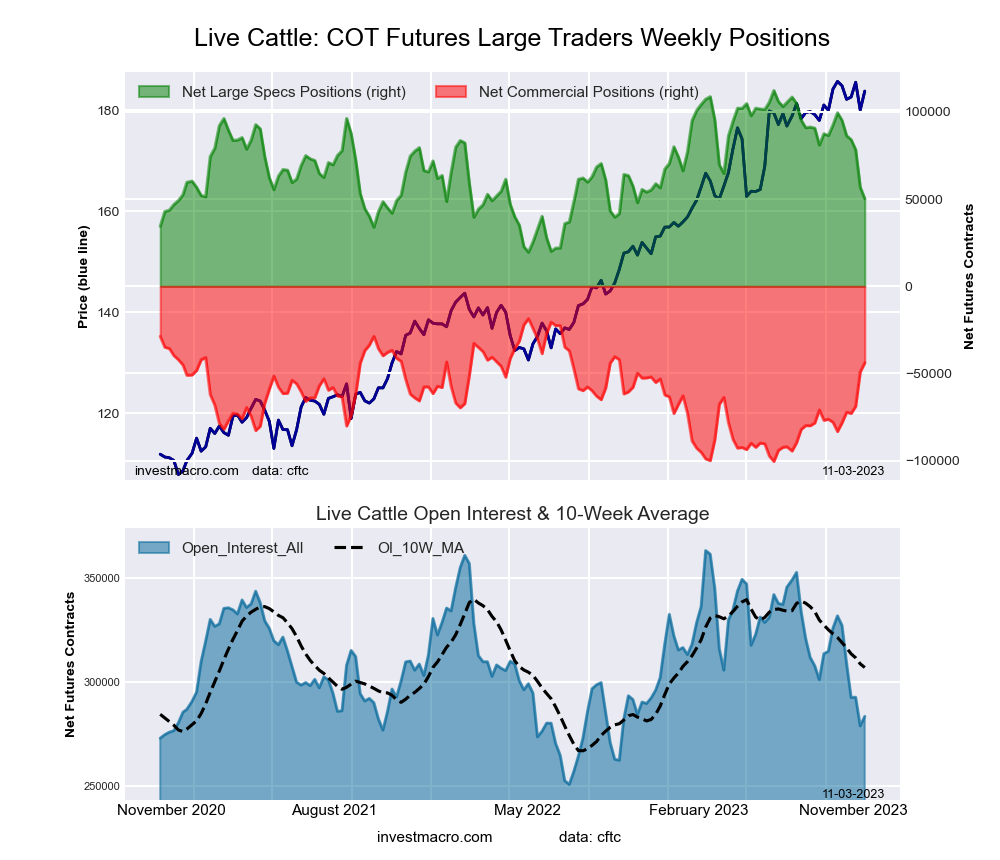 The LIVE CATTLE large speculator standing this week recorded a net position of 50,186 contracts in the data reported through Tuesday. This was a weekly reduction of -6,671 contracts from the previous week which had a total of 56,857 net contracts.
This week’s current strength score (the trader positioning range over the past three years, measured from 0 to 100) shows the speculators are currently Bearish with a score of 33.1 percent. The commercials are Bullish with a score of 69.1 percent and the small traders (not shown in chart) are Bullish with a score of 55.9 percent.
Price Trend-Following Model: Uptrend
Our weekly trend-following model classifies the current market price position as: Uptrend. The current action for the model is considered to be: Hold – Maintain Long Position.
| LIVE CATTLE Futures Statistics | SPECULATORS | COMMERCIALS | SMALL TRADERS |
| – Percent of Open Interest Longs: | 34.0 | 35.4 | 9.8 |
| – Percent of Open Interest Shorts: | 16.3 | 50.9 | 12.0 |
| – Net Position: | 50,186 | -43,839 | -6,347 |
| – Gross Longs: | 96,331 | 100,461 | 27,680 |
| – Gross Shorts: | 46,145 | 144,300 | 34,027 |
| – Long to Short Ratio: | 2.1 to 1 | 0.7 to 1 | 0.8 to 1 |
| NET POSITION TREND: | | | |
| – Strength Index Score (3 Year Range Pct): | 33.1 | 69.1 | 55.9 |
| – Strength Index Reading (3 Year Range): | Bearish | Bullish | Bullish |
| NET POSITION MOVEMENT INDEX: | | | |
| – 6-Week Change in Strength Index: | -53.2 | 48.2 | 52.3 |
LEAN HOGS Futures:
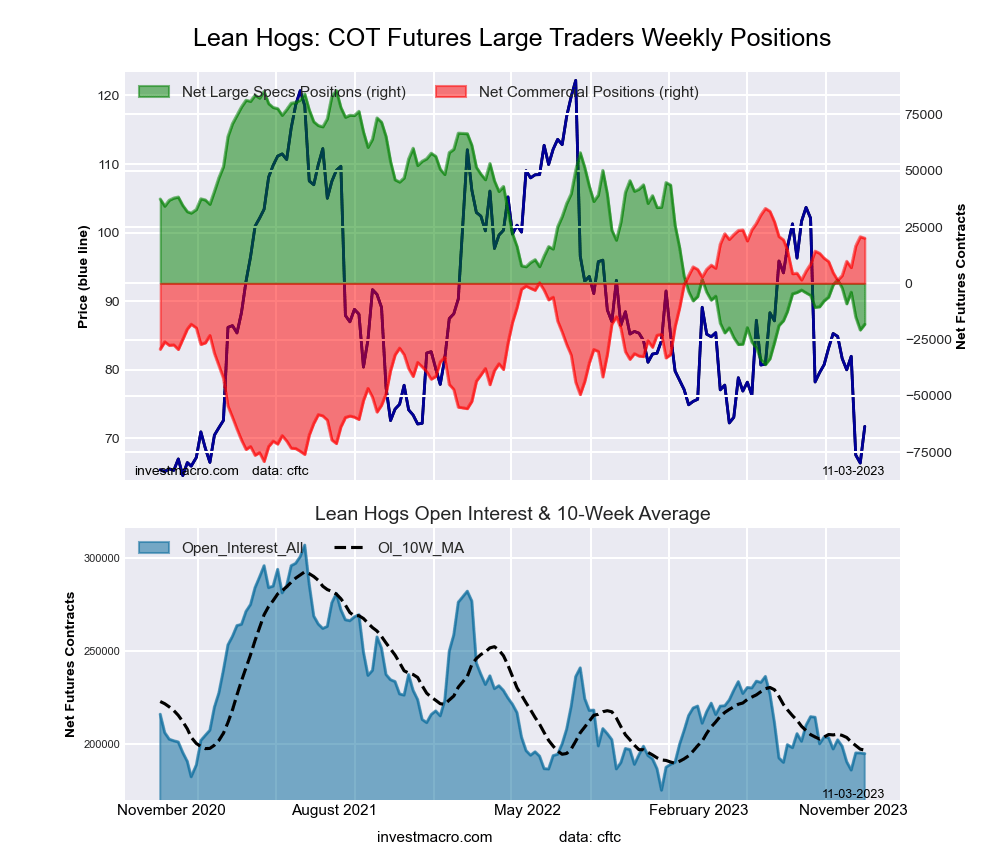 The LEAN HOGS large speculator standing this week recorded a net position of -18,189 contracts in the data reported through Tuesday. This was a weekly increase of 2,532 contracts from the previous week which had a total of -20,721 net contracts.
This week’s current strength score (the trader positioning range over the past three years, measured from 0 to 100) shows the speculators are currently Bearish-Extreme with a score of 14.7 percent. The commercials are Bullish-Extreme with a score of 88.2 percent and the small traders (not shown in chart) are Bullish with a score of 75.2 percent.
Price Trend-Following Model: Downtrend
Our weekly trend-following model classifies the current market price position as: Downtrend. The current action for the model is considered to be: Hold – Maintain Short Position.
| LEAN HOGS Futures Statistics | SPECULATORS | COMMERCIALS | SMALL TRADERS |
| – Percent of Open Interest Longs: | 28.0 | 39.4 | 9.4 |
| – Percent of Open Interest Shorts: | 37.4 | 29.1 | 10.3 |
| – Net Position: | -18,189 | 20,010 | -1,821 |
| – Gross Longs: | 54,521 | 76,620 | 18,275 |
| – Gross Shorts: | 72,710 | 56,610 | 20,096 |
| – Long to Short Ratio: | 0.7 to 1 | 1.4 to 1 | 0.9 to 1 |
| NET POSITION TREND: | | | |
| – Strength Index Score (3 Year Range Pct): | 14.7 | 88.2 | 75.2 |
| – Strength Index Reading (3 Year Range): | Bearish-Extreme | Bullish-Extreme | Bullish |
| NET POSITION MOVEMENT INDEX: | | | |
| – 6-Week Change in Strength Index: | -16.2 | 16.7 | 4.8 |
COTTON Futures:
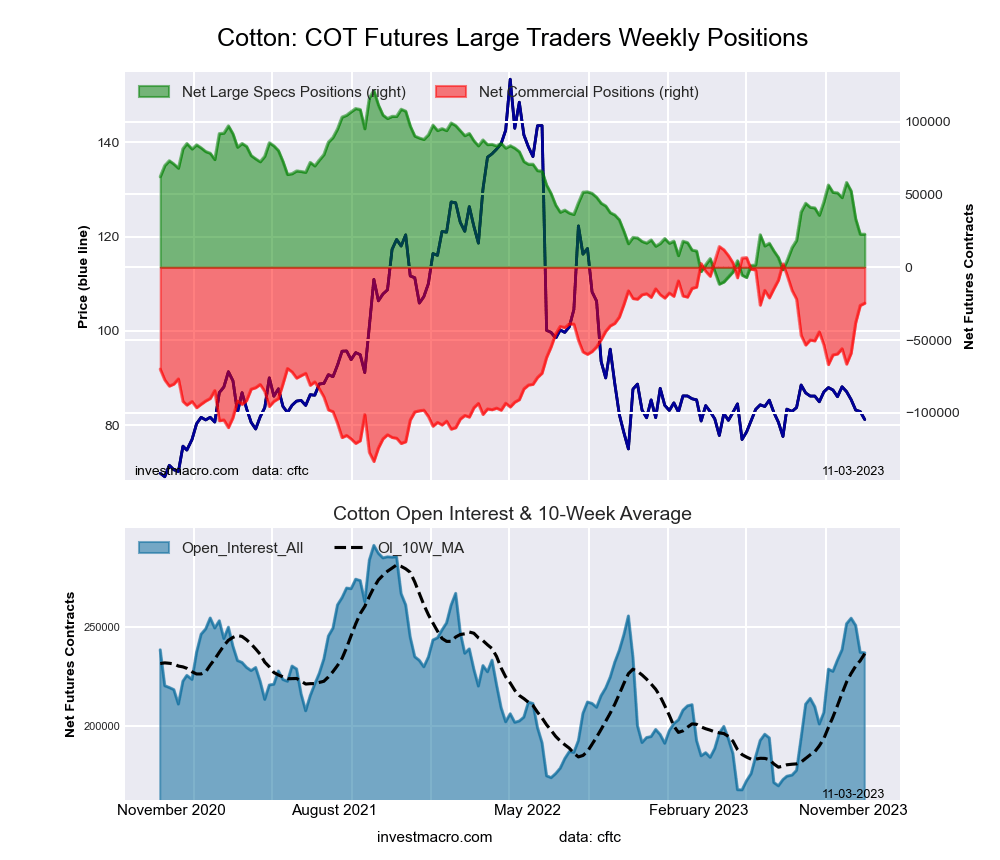 The COTTON large speculator standing this week recorded a net position of 22,664 contracts in the data reported through Tuesday. This was a weekly lowering of -16 contracts from the previous week which had a total of 22,680 net contracts.
This week’s current strength score (the trader positioning range over the past three years, measured from 0 to 100) shows the speculators are currently Bearish with a score of 25.8 percent. The commercials are Bullish with a score of 73.6 percent and the small traders (not shown in chart) are Bearish with a score of 28.3 percent.
Price Trend-Following Model: Weak Uptrend (Possible Trend Change)
Our weekly trend-following model classifies the current market price position as: Weak Uptrend. The current action for the model is considered to be: Hold – Maintain Long Position.
| COTTON Futures Statistics | SPECULATORS | COMMERCIALS | SMALL TRADERS |
| – Percent of Open Interest Longs: | 26.9 | 47.4 | 5.7 |
| – Percent of Open Interest Shorts: | 17.3 | 57.8 | 4.9 |
| – Net Position: | 22,664 | -24,680 | 2,016 |
| – Gross Longs: | 63,750 | 112,247 | 13,608 |
| – Gross Shorts: | 41,086 | 136,927 | 11,592 |
| – Long to Short Ratio: | 1.6 to 1 | 0.8 to 1 | 1.2 to 1 |
| NET POSITION TREND: | | | |
| – Strength Index Score (3 Year Range Pct): | 25.8 | 73.6 | 28.3 |
| – Strength Index Reading (3 Year Range): | Bearish | Bullish | Bearish |
| NET POSITION MOVEMENT INDEX: | | | |
| – 6-Week Change in Strength Index: | -21.4 | 23.6 | -39.2 |
COCOA Futures:
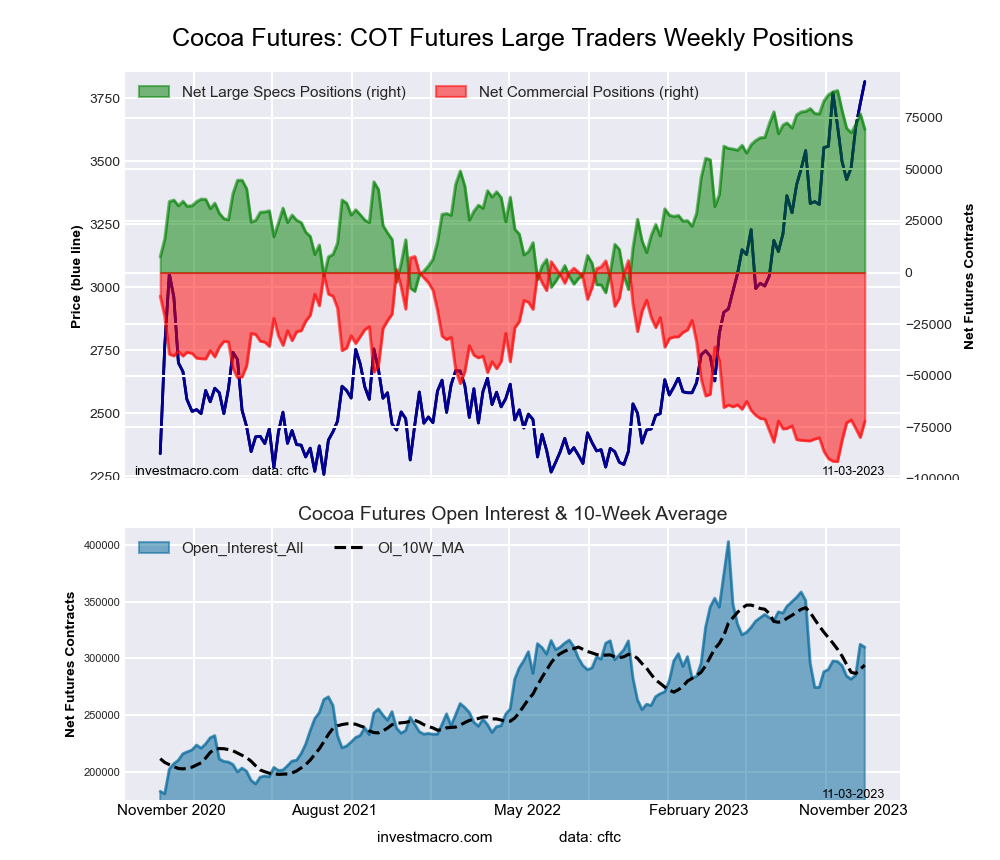 The COCOA large speculator standing this week recorded a net position of 69,477 contracts in the data reported through Tuesday. This was a weekly decline of -7,543 contracts from the previous week which had a total of 77,020 net contracts.
This week’s current strength score (the trader positioning range over the past three years, measured from 0 to 100) shows the speculators are currently Bullish-Extreme with a score of 80.8 percent. The commercials are Bearish-Extreme with a score of 19.6 percent and the small traders (not shown in chart) are Bearish with a score of 22.8 percent.
Price Trend-Following Model: Strong Uptrend
Our weekly trend-following model classifies the current market price position as: Strong Uptrend. The current action for the model is considered to be: Hold – Maintain Long Position.
| COCOA Futures Statistics | SPECULATORS | COMMERCIALS | SMALL TRADERS |
| – Percent of Open Interest Longs: | 41.4 | 26.7 | 4.7 |
| – Percent of Open Interest Shorts: | 18.9 | 50.0 | 3.9 |
| – Net Position: | 69,477 | -72,106 | 2,629 |
| – Gross Longs: | 128,136 | 82,848 | 14,576 |
| – Gross Shorts: | 58,659 | 154,954 | 11,947 |
| – Long to Short Ratio: | 2.2 to 1 | 0.5 to 1 | 1.2 to 1 |
| NET POSITION TREND: | | | |
| – Strength Index Score (3 Year Range Pct): | 80.8 | 19.6 | 22.8 |
| – Strength Index Reading (3 Year Range): | Bullish-Extreme | Bearish-Extreme | Bearish |
| NET POSITION MOVEMENT INDEX: | | | |
| – 6-Week Change in Strength Index: | -19.2 | 19.6 | -7.3 |
WHEAT Futures:
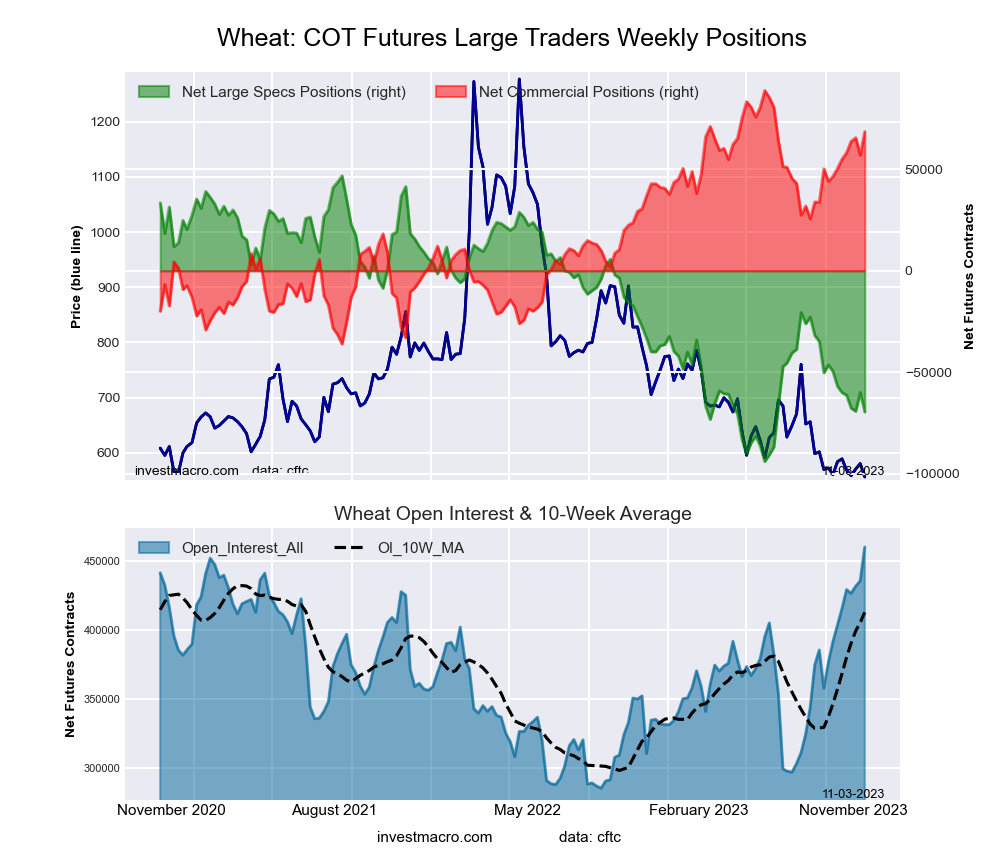 The WHEAT large speculator standing this week recorded a net position of -69,567 contracts in the data reported through Tuesday. This was a weekly decline of -9,620 contracts from the previous week which had a total of -59,947 net contracts.
This week’s current strength score (the trader positioning range over the past three years, measured from 0 to 100) shows the speculators are currently Bearish-Extreme with a score of 17.4 percent. The commercials are Bullish-Extreme with a score of 83.8 percent and the small traders (not shown in chart) are Bullish with a score of 71.6 percent.
Price Trend-Following Model: Downtrend
Our weekly trend-following model classifies the current market price position as: Downtrend. The current action for the model is considered to be: Hold – Maintain Short Position.
| WHEAT Futures Statistics | SPECULATORS | COMMERCIALS | SMALL TRADERS |
| – Percent of Open Interest Longs: | 26.7 | 34.2 | 8.0 |
| – Percent of Open Interest Shorts: | 41.8 | 19.3 | 7.8 |
| – Net Position: | -69,567 | 68,593 | 974 |
| – Gross Longs: | 122,955 | 157,363 | 36,998 |
| – Gross Shorts: | 192,522 | 88,770 | 36,024 |
| – Long to Short Ratio: | 0.6 to 1 | 1.8 to 1 | 1.0 to 1 |
| NET POSITION TREND: | | | |
| – Strength Index Score (3 Year Range Pct): | 17.4 | 83.8 | 71.6 |
| – Strength Index Reading (3 Year Range): | Bearish-Extreme | Bullish-Extreme | Bullish |
| NET POSITION MOVEMENT INDEX: | | | |
| – 6-Week Change in Strength Index: | -9.0 | 14.5 | -22.8 |
Article By InvestMacro – Receive our weekly COT Newsletter
*COT Report: The COT data, released weekly to the public each Friday, is updated through the most recent Tuesday (data is 3 days old) and shows a quick view of how large speculators or non-commercials (for-profit traders) were positioned in the futures markets.
The CFTC categorizes trader positions according to commercial hedgers (traders who use futures contracts for hedging as part of the business), non-commercials (large traders who speculate to realize trading profits) and nonreportable traders (usually small traders/speculators) as well as their open interest (contracts open in the market at time of reporting). See CFTC criteria here.


