
By InvestMacro
Here are the latest charts and statistics for the Commitment of Traders (COT) data published by the Commodities Futures Trading Commission (CFTC).
The latest COT data is updated through Tuesday October 31st and shows a quick view of how large traders (for-profit speculators and commercial entities) were positioned in the futures markets.
Weekly Speculator Changes led by VIX & Russell-Mini
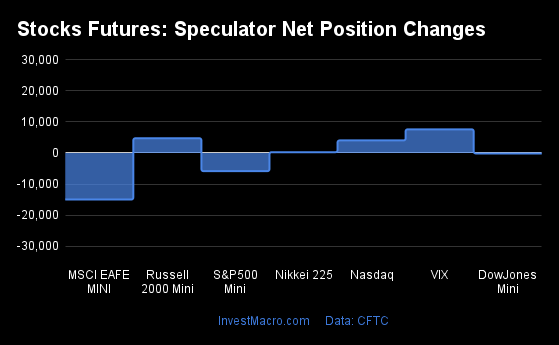
The COT stock markets speculator bets were higher this week as four out of the seven stock markets we cover had higher positioning while the other three markets had lower speculator contracts.
Free Reports:
 Sign Up for Our Stock Market Newsletter – Get updated on News, Charts & Rankings of Public Companies when you join our Stocks Newsletter
 Get our Weekly Commitment of Traders Reports - See where the biggest traders (Hedge Funds and Commercial Hedgers) are positioned in the futures markets on a weekly basis.
Leading the gains for the stock markets was the VIX (7,615 contracts) with the Russell-Mini (4,744 contracts), the Nasdaq-Mini (4,040 contracts) and the Nikkei 225 (253 contracts) also showing positive weeks.
The markets with the declines in speculator bets this week were the MSCI EAFE-Mini (-14,986 contracts), the S&P500-Mini (-5,848 contracts)and DowJones-Mini (-151 contracts) also registering lower bets on the week.
| Oct-31-2023 | OI | OI-Index | Spec-Net | Spec-Index | Com-Net | COM-Index | Smalls-Net | Smalls-Index |
|---|---|---|---|---|---|---|---|---|
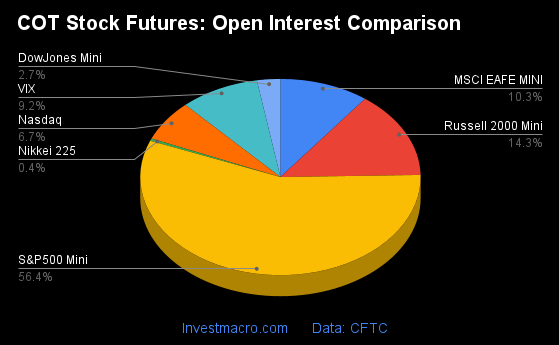
| S&P500-Mini | 2,174,689 | 18 | 4,337 | 65 | -33,976 | 35 | 29,639 | 49 |
| Nikkei 225 | 14,806 | 28 | -1,875 | 53 | 1,084 | 42 | 791 | 38 |
| Nasdaq-Mini | 259,306 | 45 | 6,737 | 49 | -6,592 | 36 | -145 | 69 |
| DowJones-Mini | 103,936 | 70 | -36,111 | 0 | 40,621 | 100 | -4,510 | 22 |
| VIX | 353,533 | 49 | -13,979 | 100 | 18,713 | 0 | -4,734 | 72 |
| Nikkei 225 Yen | 54,580 | 44 | 4,776 | 49 | 9,666 | 37 | -14,442 | 61 |
Strength Scores led by VIX & S&P500-Mini

COT Strength Scores (a normalized measure of Speculator positions over a 3-Year range, from 0 to 100 where above 80 is Extreme-Bullish and below 20 is Extreme-Bearish) showed that the VIX (100 percent) and the S&P500-Mini (65 percent) lead the stock markets this week. The Nikkei 225 (53 percent) come in as the next highest in the weekly strength scores and above 50 percent.
On the downside, the DowJones-Mini (0 percent) and the MSCI EAFE-Mini (12 percent) come in at the lowest strength level currently and are in Extreme-Bearish territory (below 20 percent).
Strength Statistics:
VIX (100.0 percent) vs VIX previous week (94.9 percent)
S&P500-Mini (65.4 percent) vs S&P500-Mini previous week (66.3 percent)
DowJones-Mini (0.0 percent) vs DowJones-Mini previous week (0.3 percent)
Nasdaq-Mini (49.3 percent) vs Nasdaq-Mini previous week (43.1 percent)
Russell2000-Mini (48.3 percent) vs Russell2000-Mini previous week (45.5 percent)
Nikkei USD (53.2 percent) vs Nikkei USD previous week (51.4 percent)
EAFE-Mini (12.3 percent) vs EAFE-Mini previous week (26.7 percent)
S&P500-Mini & Russell-Mini top the 6-Week Strength Trends
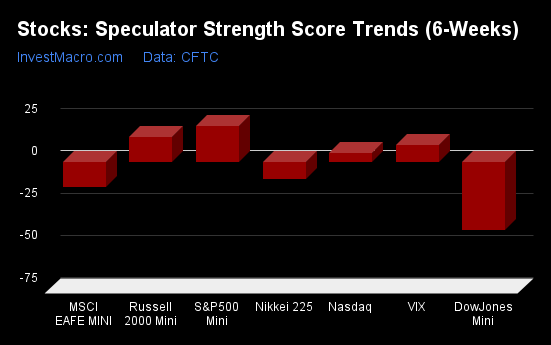
COT Strength Score Trends (or move index, calculates the 6-week changes in strength scores) showed that the S&P500-Mini (21 percent) leads the past six weeks trends for the stock markets. The Russell-Mini (14 percent), the VIX (10 percent) and the Nasdaq-Mini (5 percent) are the next highest positive movers in the latest trends data.
The DowJones-Mini (-40 percent) leads the downside trend scores currently with the MSCI EAFE-Mini (-15 percent) and the Nikkei USD (-10 percent) coming in next with lower trend scores.
Strength Trend Statistics:
VIX (9.9 percent) vs VIX previous week (11.9 percent)
S&P500-Mini (21.4 percent) vs S&P500-Mini previous week (18.9 percent)
DowJones-Mini (-40.5 percent) vs DowJones-Mini previous week (-50.9 percent)
Nasdaq-Mini (5.5 percent) vs Nasdaq-Mini previous week (-9.8 percent)
Russell2000-Mini (14.5 percent) vs Russell2000-Mini previous week (11.7 percent)
Nikkei USD (-10.3 percent) vs Nikkei USD previous week (-18.7 percent)
EAFE-Mini (-14.7 percent) vs EAFE-Mini previous week (26.7 percent)
Individual Stock Market Charts:
VIX Volatility Futures:
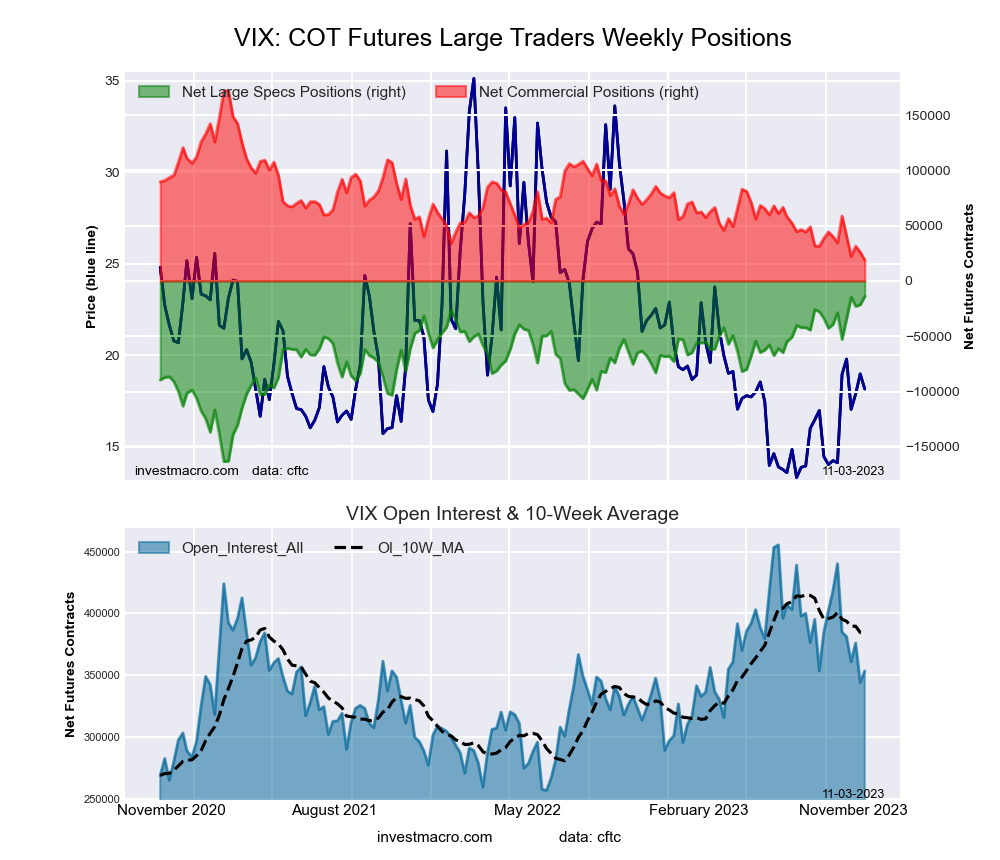 The VIX Volatility large speculator standing this week came in at a net position of -13,979 contracts in the data reported through Tuesday. This was a weekly increase of 7,615 contracts from the previous week which had a total of -21,594 net contracts.
This week’s current strength score (the trader positioning range over the past three years, measured from 0 to 100) shows the speculators are currently Bullish-Extreme with a score of 100.0 percent. The commercials are Bearish-Extreme with a score of 0.0 percent and the small traders (not shown in chart) are Bullish with a score of 72.3 percent.
Price Trend-Following Model: Weak Uptrend
Our weekly trend-following model classifies the current market price position as: Weak Uptrend. The current action for the model is considered to be: Hold – Maintain Long Position.
| VIX Volatility Futures Statistics | SPECULATORS | COMMERCIALS | SMALL TRADERS |
| – Percent of Open Interest Longs: | 26.9 | 45.3 | 7.7 |
| – Percent of Open Interest Shorts: | 30.8 | 40.0 | 9.1 |
| – Net Position: | -13,979 | 18,713 | -4,734 |
| – Gross Longs: | 95,012 | 160,163 | 27,346 |
| – Gross Shorts: | 108,991 | 141,450 | 32,080 |
| – Long to Short Ratio: | 0.9 to 1 | 1.1 to 1 | 0.9 to 1 |
| NET POSITION TREND: | |||
| – Strength Index Score (3 Year Range Pct): | 100.0 | 0.0 | 72.3 |
| – Strength Index Reading (3 Year Range): | Bullish-Extreme | Bearish-Extreme | Bullish |
| NET POSITION MOVEMENT INDEX: | |||
| – 6-Week Change in Strength Index: | 9.9 | -10.2 | 4.3 |
S&P500 Mini Futures:
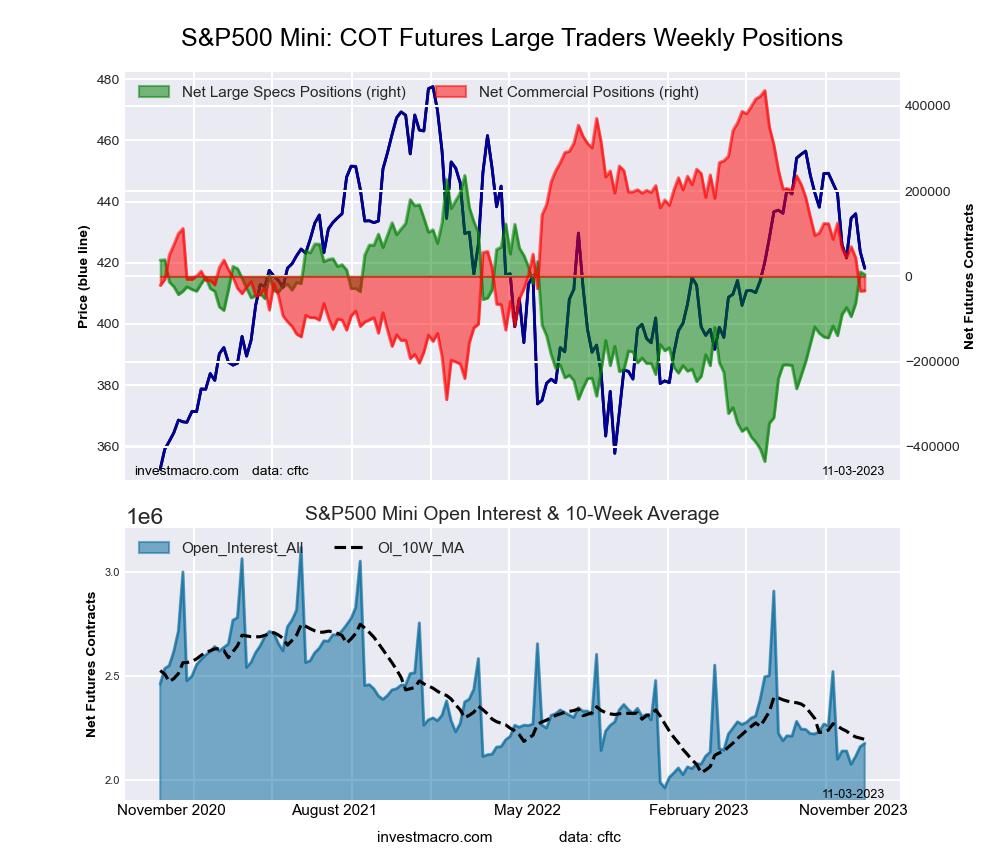 The S&P500 Mini large speculator standing this week came in at a net position of 4,337 contracts in the data reported through Tuesday. This was a weekly decline of -5,848 contracts from the previous week which had a total of 10,185 net contracts.
This week’s current strength score (the trader positioning range over the past three years, measured from 0 to 100) shows the speculators are currently Bullish with a score of 65.4 percent. The commercials are Bearish with a score of 35.2 percent and the small traders (not shown in chart) are Bearish with a score of 49.0 percent.
Price Trend-Following Model: Downtrend
Our weekly trend-following model classifies the current market price position as: Downtrend. The current action for the model is considered to be: Hold – Maintain Short Position.
| S&P500 Mini Futures Statistics | SPECULATORS | COMMERCIALS | SMALL TRADERS |
| – Percent of Open Interest Longs: | 13.0 | 72.0 | 12.0 |
| – Percent of Open Interest Shorts: | 12.9 | 73.6 | 10.6 |
| – Net Position: | 4,337 | -33,976 | 29,639 |
| – Gross Longs: | 283,793 | 1,566,648 | 260,265 |
| – Gross Shorts: | 279,456 | 1,600,624 | 230,626 |
| – Long to Short Ratio: | 1.0 to 1 | 1.0 to 1 | 1.1 to 1 |
| NET POSITION TREND: | |||
| – Strength Index Score (3 Year Range Pct): | 65.4 | 35.2 | 49.0 |
| – Strength Index Reading (3 Year Range): | Bullish | Bearish | Bearish |
| NET POSITION MOVEMENT INDEX: | |||
| – 6-Week Change in Strength Index: | 21.4 | -21.9 | 6.1 |
Dow Jones Mini Futures:
 The Dow Jones Mini large speculator standing this week came in at a net position of -36,111 contracts in the data reported through Tuesday. This was a weekly decline of -151 contracts from the previous week which had a total of -35,960 net contracts.
This week’s current strength score (the trader positioning range over the past three years, measured from 0 to 100) shows the speculators are currently Bearish-Extreme with a score of 0.0 percent. The commercials are Bullish-Extreme with a score of 100.0 percent and the small traders (not shown in chart) are Bearish with a score of 21.9 percent.
Price Trend-Following Model: Downtrend
Our weekly trend-following model classifies the current market price position as: Downtrend. The current action for the model is considered to be: Hold – Maintain Short Position.
| Dow Jones Mini Futures Statistics | SPECULATORS | COMMERCIALS | SMALL TRADERS |
| – Percent of Open Interest Longs: | 22.9 | 66.1 | 10.3 |
| – Percent of Open Interest Shorts: | 57.6 | 27.0 | 14.6 |
| – Net Position: | -36,111 | 40,621 | -4,510 |
| – Gross Longs: | 23,780 | 68,690 | 10,657 |
| – Gross Shorts: | 59,891 | 28,069 | 15,167 |
| – Long to Short Ratio: | 0.4 to 1 | 2.4 to 1 | 0.7 to 1 |
| NET POSITION TREND: | |||
| – Strength Index Score (3 Year Range Pct): | 0.0 | 100.0 | 21.9 |
| – Strength Index Reading (3 Year Range): | Bearish-Extreme | Bullish-Extreme | Bearish |
| NET POSITION MOVEMENT INDEX: | |||
| – 6-Week Change in Strength Index: | -40.5 | 40.7 | -24.3 |
Nasdaq Mini Futures:
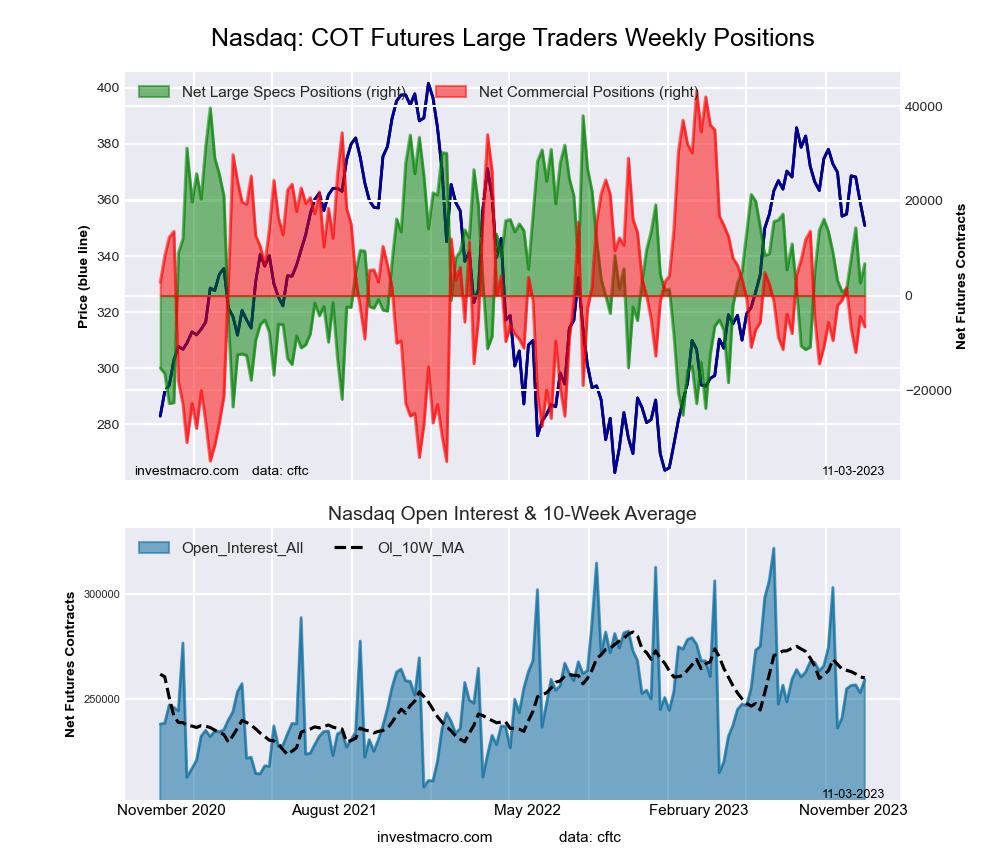 The Nasdaq Mini large speculator standing this week came in at a net position of 6,737 contracts in the data reported through Tuesday. This was a weekly advance of 4,040 contracts from the previous week which had a total of 2,697 net contracts.
This week’s current strength score (the trader positioning range over the past three years, measured from 0 to 100) shows the speculators are currently Bearish with a score of 49.3 percent. The commercials are Bearish with a score of 36.3 percent and the small traders (not shown in chart) are Bullish with a score of 69.3 percent.
Price Trend-Following Model: Downtrend
Our weekly trend-following model classifies the current market price position as: Downtrend. The current action for the model is considered to be: Hold – Maintain Short Position.
| Nasdaq Mini Futures Statistics | SPECULATORS | COMMERCIALS | SMALL TRADERS |
| – Percent of Open Interest Longs: | 27.9 | 55.9 | 14.6 |
| – Percent of Open Interest Shorts: | 25.3 | 58.4 | 14.6 |
| – Net Position: | 6,737 | -6,592 | -145 |
| – Gross Longs: | 72,368 | 144,956 | 37,843 |
| – Gross Shorts: | 65,631 | 151,548 | 37,988 |
| – Long to Short Ratio: | 1.1 to 1 | 1.0 to 1 | 1.0 to 1 |
| NET POSITION TREND: | |||
| – Strength Index Score (3 Year Range Pct): | 49.3 | 36.3 | 69.3 |
| – Strength Index Reading (3 Year Range): | Bearish | Bearish | Bullish |
| NET POSITION MOVEMENT INDEX: | |||
| – 6-Week Change in Strength Index: | 5.5 | -5.7 | 2.3 |
Russell 2000 Mini Futures:
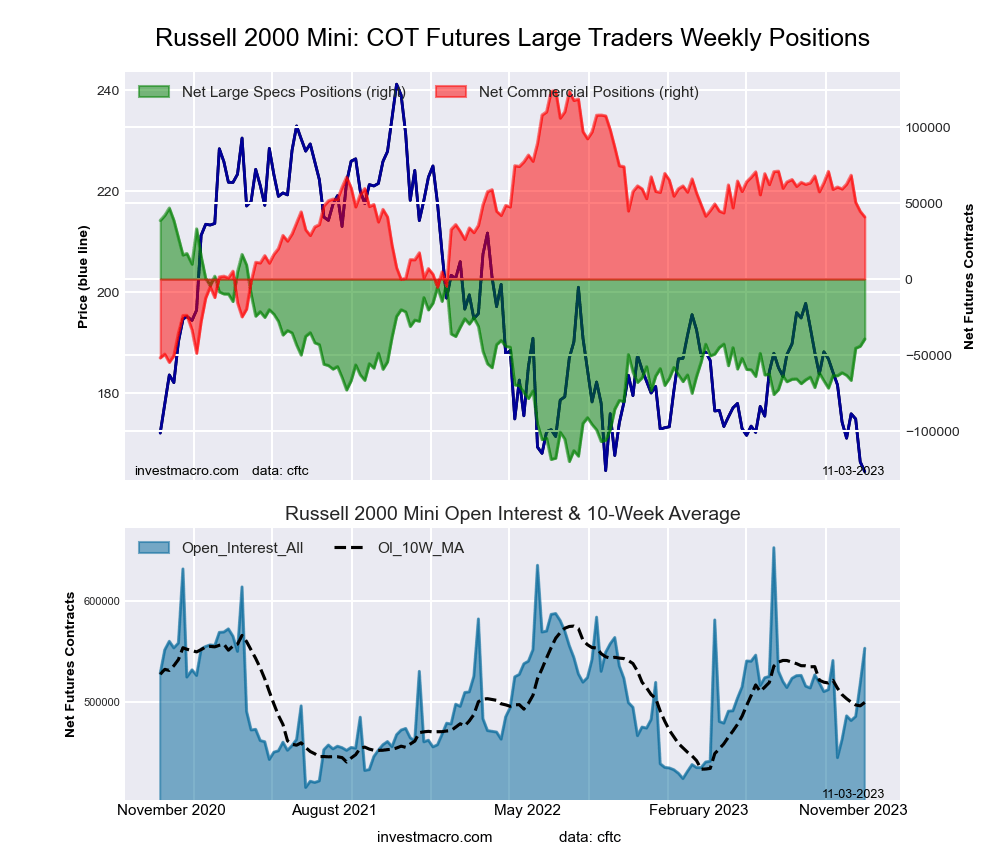 The Russell 2000 Mini large speculator standing this week came in at a net position of -39,427 contracts in the data reported through Tuesday. This was a weekly rise of 4,744 contracts from the previous week which had a total of -44,171 net contracts.
This week’s current strength score (the trader positioning range over the past three years, measured from 0 to 100) shows the speculators are currently Bearish with a score of 48.3 percent. The commercials are Bullish with a score of 53.5 percent and the small traders (not shown in chart) are Bearish with a score of 22.1 percent.
Price Trend-Following Model: Strong Downtrend
Our weekly trend-following model classifies the current market price position as: Strong Downtrend. The current action for the model is considered to be: Hold – Maintain Short Position.
| Russell 2000 Mini Futures Statistics | SPECULATORS | COMMERCIALS | SMALL TRADERS |
| – Percent of Open Interest Longs: | 14.6 | 79.8 | 4.4 |
| – Percent of Open Interest Shorts: | 21.8 | 72.4 | 4.6 |
| – Net Position: | -39,427 | 40,876 | -1,449 |
| – Gross Longs: | 80,998 | 441,734 | 24,237 |
| – Gross Shorts: | 120,425 | 400,858 | 25,686 |
| – Long to Short Ratio: | 0.7 to 1 | 1.1 to 1 | 0.9 to 1 |
| NET POSITION TREND: | |||
| – Strength Index Score (3 Year Range Pct): | 48.3 | 53.5 | 22.1 |
| – Strength Index Reading (3 Year Range): | Bearish | Bullish | Bearish |
| NET POSITION MOVEMENT INDEX: | |||
| – 6-Week Change in Strength Index: | 14.5 | -11.0 | -13.8 |
Nikkei Stock Average (USD) Futures:
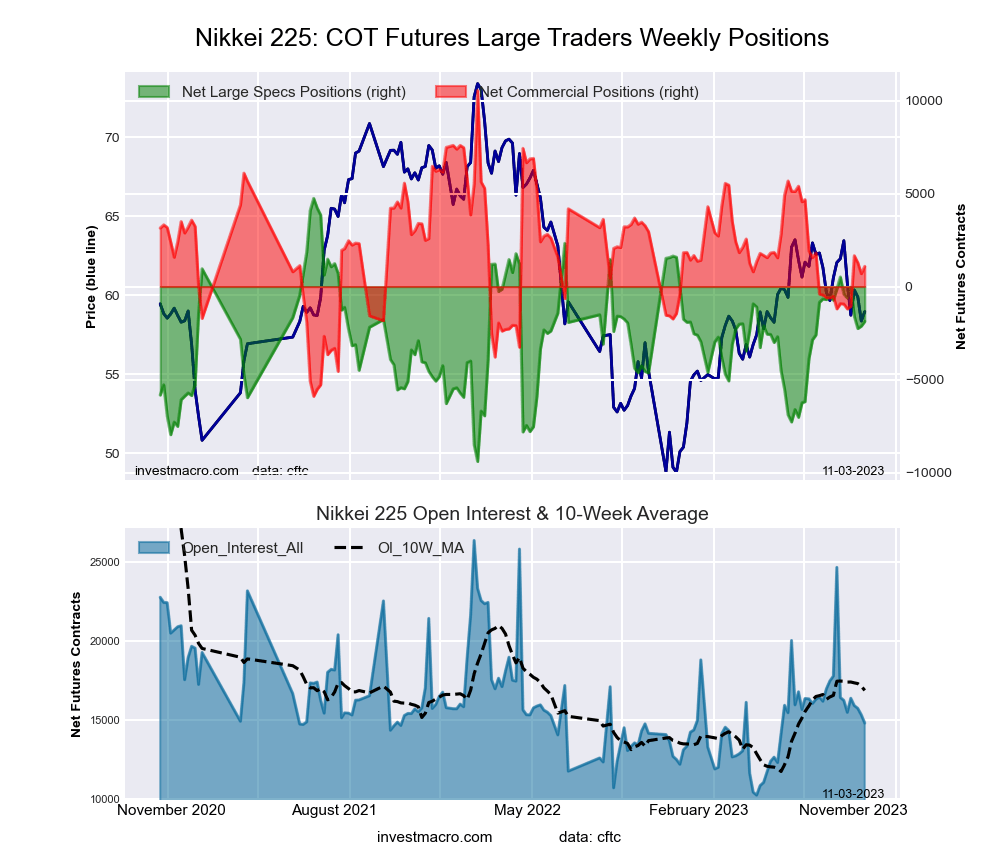 The Nikkei Stock Average (USD) large speculator standing this week came in at a net position of -1,875 contracts in the data reported through Tuesday. This was a weekly rise of 253 contracts from the previous week which had a total of -2,128 net contracts.
This week’s current strength score (the trader positioning range over the past three years, measured from 0 to 100) shows the speculators are currently Bullish with a score of 53.2 percent. The commercials are Bearish with a score of 42.5 percent and the small traders (not shown in chart) are Bearish with a score of 38.3 percent.
Price Trend-Following Model: Downtrend
Our weekly trend-following model classifies the current market price position as: Downtrend. The current action for the model is considered to be: Hold – Maintain Short Position.
| Nikkei Stock Average Futures Statistics | SPECULATORS | COMMERCIALS | SMALL TRADERS |
| – Percent of Open Interest Longs: | 4.6 | 72.6 | 22.8 |
| – Percent of Open Interest Shorts: | 17.2 | 65.3 | 17.5 |
| – Net Position: | -1,875 | 1,084 | 791 |
| – Gross Longs: | 679 | 10,745 | 3,382 |
| – Gross Shorts: | 2,554 | 9,661 | 2,591 |
| – Long to Short Ratio: | 0.3 to 1 | 1.1 to 1 | 1.3 to 1 |
| NET POSITION TREND: | |||
| – Strength Index Score (3 Year Range Pct): | 53.2 | 42.5 | 38.3 |
| – Strength Index Reading (3 Year Range): | Bullish | Bearish | Bearish |
| NET POSITION MOVEMENT INDEX: | |||
| – 6-Week Change in Strength Index: | -10.3 | 12.3 | -7.1 |
MSCI EAFE Mini Futures:
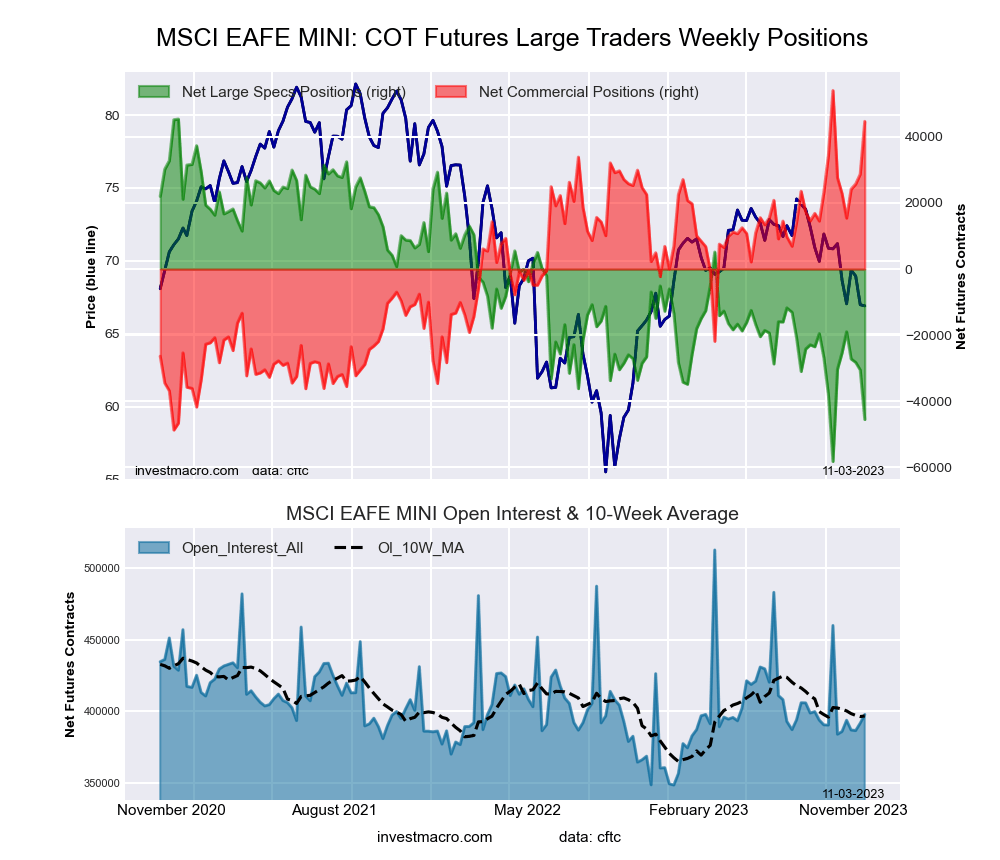 The MSCI EAFE Mini large speculator standing this week came in at a net position of -45,485 contracts in the data reported through Tuesday. This was a weekly fall of -14,986 contracts from the previous week which had a total of -30,499 net contracts.
This week’s current strength score (the trader positioning range over the past three years, measured from 0 to 100) shows the speculators are currently Bearish-Extreme with a score of 12.3 percent. The commercials are Bullish-Extreme with a score of 90.9 percent and the small traders (not shown in chart) are Bearish with a score of 21.2 percent.
Price Trend-Following Model: Downtrend
Our weekly trend-following model classifies the current market price position as: Downtrend. The current action for the model is considered to be: Hold – Maintain Short Position.
| MSCI EAFE Mini Futures Statistics | SPECULATORS | COMMERCIALS | SMALL TRADERS |
| – Percent of Open Interest Longs: | 5.3 | 91.4 | 2.5 |
| – Percent of Open Interest Shorts: | 16.7 | 80.2 | 2.3 |
| – Net Position: | -45,485 | 44,671 | 814 |
| – Gross Longs: | 21,077 | 363,693 | 9,868 |
| – Gross Shorts: | 66,562 | 319,022 | 9,054 |
| – Long to Short Ratio: | 0.3 to 1 | 1.1 to 1 | 1.1 to 1 |
| NET POSITION TREND: | |||
| – Strength Index Score (3 Year Range Pct): | 12.3 | 90.9 | 21.2 |
| – Strength Index Reading (3 Year Range): | Bearish-Extreme | Bullish-Extreme | Bearish |
| NET POSITION MOVEMENT INDEX: | |||
| – 6-Week Change in Strength Index: | -14.7 | 16.6 | -9.0 |
Article By InvestMacro – Receive our weekly COT Newsletter
*COT Report: The COT data, released weekly to the public each Friday, is updated through the most recent Tuesday (data is 3 days old) and shows a quick view of how large speculators or non-commercials (for-profit traders) were positioned in the futures markets.
The CFTC categorizes trader positions according to commercial hedgers (traders who use futures contracts for hedging as part of the business), non-commercials (large traders who speculate to realize trading profits) and nonreportable traders (usually small traders/speculators) as well as their open interest (contracts open in the market at time of reporting). See CFTC criteria here.

- COT Metals Charts: Weekly Speculator Bets see small gains for Silver & Gold Jul 12, 2026
- COT Bonds Charts: Speculator Bets led by SOFR 3-Months & 2-Year Bonds Jul 12, 2026
- COT Energy Charts: Weekly Speculator Changes led by Brent Oil Jul 12, 2026
- COT Soft Commodities Charts: Weekly Speculator Changes led by Sugar, Corn & Soybeans Jul 12, 2026
- The US and European stock indices are rising again amid renewed investor interest in the AI industry. Jul 10, 2026
- USD/JPY Falls as Yen Recovers Weekly Losses Jul 10, 2026
- Crude oil prices surged sharply by 7% in reaction to the rapid escalation of the conflict in the Middle East Jul 9, 2026
- Middle East Tensions Weigh on Gold Jul 9, 2026
- Pound Awaits Tighter Policy from Bank of England Jul 8, 2026
- The United States carried out airstrikes on Iran after Iran’s attacked tankers in the Strait of Hormuz. The RBNZ raised the interest rate to 2.5% Jul 8, 2026