By InvestMacro
Here are the latest charts and statistics for the Commitment of Traders (COT) reports data published by the Commodities Futures Trading Commission (CFTC).
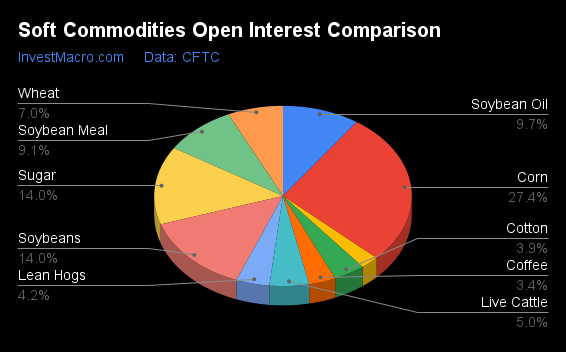
The latest COT data is updated through Tuesday August 13th and shows a quick view of how large traders (for-profit speculators and commercial entities) were positioned in the futures markets.
Weekly Speculator Changes led by Sugar & Wheat
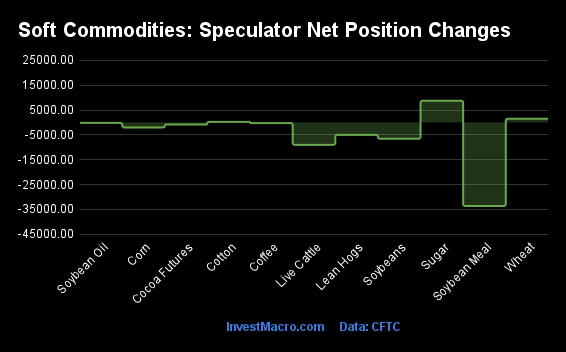
The COT soft commodities markets speculator bets were lower this week as three out of the eleven softs markets we cover had higher positioning while the other eight markets had lower speculator contracts.
Leading the gains for the softs markets was Sugar (8,747 contracts) with Wheat (1,480 contracts) and Cotton (238 contracts) also having positive weeks.
The markets with the declines in speculator bets this week were Soybean Meal (-33,676 contracts), Live Cattle (-9,035 contracts), Soybeans (-6,595 contracts), Lean Hogs (-4,998 contracts), Corn (-2,036 contracts), Cocoa (-829 contracts), Coffee (-267 contracts) and with Soybean Oil (-197 contracts) also registering lower bets on the week.
Soft Commodities Net Speculators Leaderboard
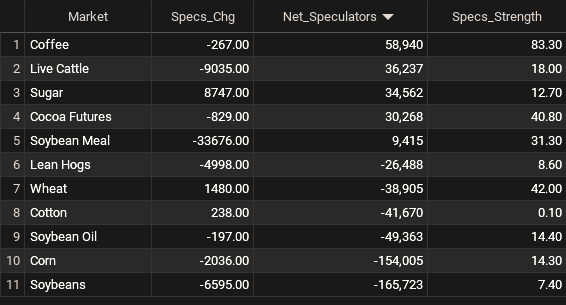
Legend: Weekly Speculators Change | Speculators Current Net Position | Speculators Strength Score compared to last 3-Years (0-100 range)
Strength Scores led by Coffee
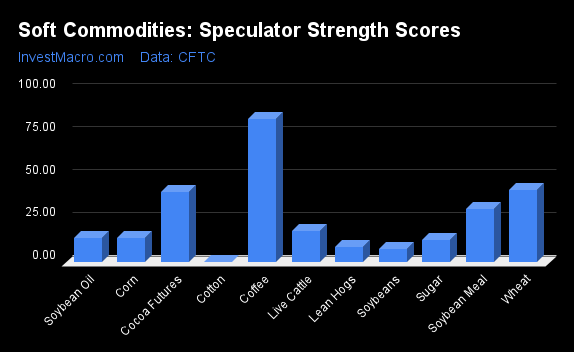
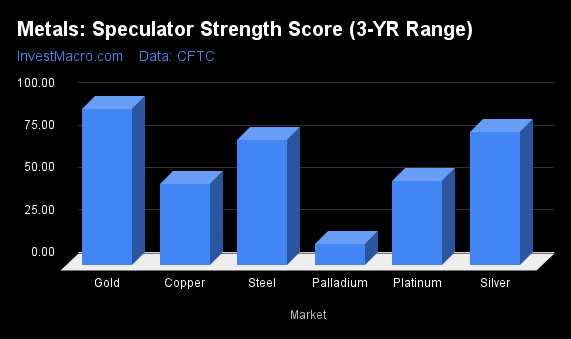
COT Strength Scores (a normalized measure of Speculator positions over a 3-Year range, from 0 to 100 where above 80 is Extreme-Bullish and below 20 is Extreme-Bearish) showed that Coffee (83 percent) leads the softs markets this week and is the only market above 50 percent.
On the downside, Cotton (0 percent), Soybeans (7 percent), Lean Hogs (9 percent), Sugar (13 percent), Soybean Oil (14 percent), Corn (14 percent) and Live Cattle (18.0 percent) come in at the lowest strength levels currently and are in Extreme-Bearish territory (below 20 percent).
Strength Statistics:
Corn (14.3 percent) vs Corn previous week (14.5 percent)
Sugar (12.7 percent) vs Sugar previous week (9.8 percent)
Coffee (83.3 percent) vs Coffee previous week (83.6 percent)
Soybeans (7.4 percent) vs Soybeans previous week (9.0 percent)
Soybean Oil (14.4 percent) vs Soybean Oil previous week (14.5 percent)
Soybean Meal (31.3 percent) vs Soybean Meal previous week (45.1 percent)
Live Cattle (18.0 percent) vs Live Cattle previous week (27.8 percent)
Lean Hogs (8.6 percent) vs Lean Hogs previous week (13.0 percent)
Cotton (0.1 percent) vs Cotton previous week (0.0 percent)
Cocoa (40.8 percent) vs Cocoa previous week (41.7 percent)
Wheat (42.0 percent) vs Wheat previous week (41.0 percent)
Corn & Lean Hogs top the 6-Week Strength Trends
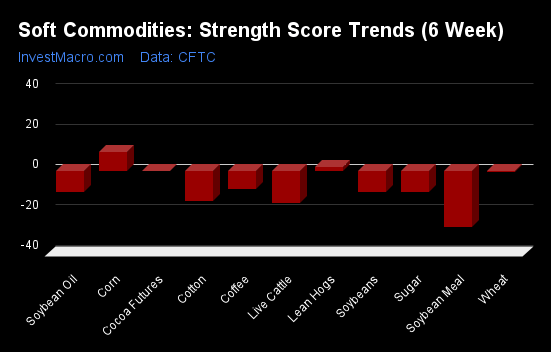
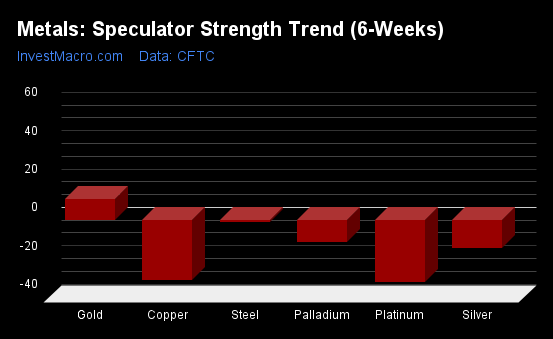
COT Strength Score Trends (or move index, calculates the 6-week changes in strength scores) showed that Corn (10 percent) and Lean Hogs (2 percent) lead the past six weeks trends for soft commodities.
Soybean Meal (-28 percent) leads the downside trend scores currently with Live Cattle (-16 percent), Cotton (-15 percent) and Soybean Oil (-10 percent) following next with lower trend scores.
Strength Trend Statistics:
Corn (9.5 percent) vs Corn previous week (2.3 percent)
Sugar (-10.0 percent) vs Sugar previous week (-3.8 percent)
Coffee (-8.6 percent) vs Coffee previous week (-11.2 percent)
Soybeans (-10.3 percent) vs Soybeans previous week (-11.3 percent)
Soybean Oil (-10.2 percent) vs Soybean Oil previous week (14.5 percent)
Soybean Meal (-27.6 percent) vs Soybean Meal previous week (-19.2 percent)
Live Cattle (-15.5 percent) vs Live Cattle previous week (-3.7 percent)
Lean Hogs (2.2 percent) vs Lean Hogs previous week (4.4 percent)
Cotton (-14.9 percent) vs Cotton previous week (-11.0 percent)
Cocoa (0.1 percent) vs Cocoa previous week (1.8 percent)
Wheat (-0.2 percent) vs Wheat previous week (3.0 percent)
Individual Soft Commodities Markets:
CORN Futures:
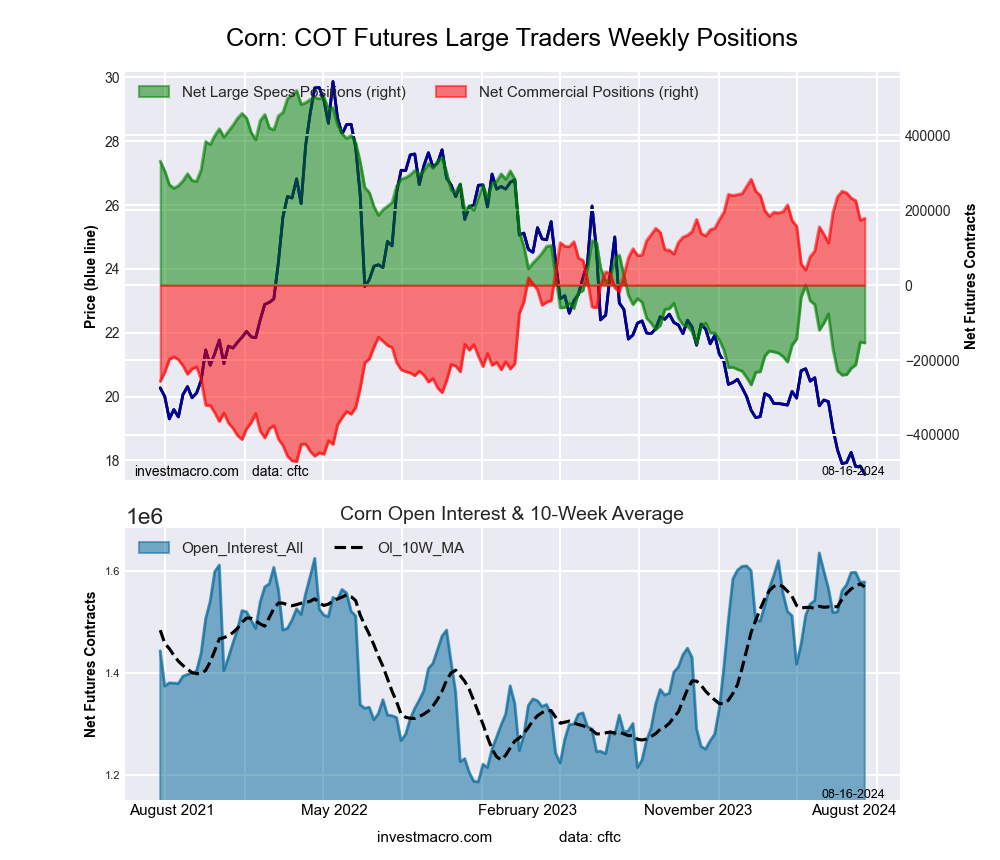 The CORN large speculator standing this week resulted in a net position of -154,005 contracts in the data reported through Tuesday. This was a weekly fall of -2,036 contracts from the previous week which had a total of -151,969 net contracts.
This week’s current strength score (the trader positioning range over the past three years, measured from 0 to 100) shows the speculators are currently Bearish-Extreme with a score of 14.3 percent. The commercials are Bullish-Extreme with a score of 86.1 percent and the small traders (not shown in chart) are Bullish with a score of 75.6 percent.
Price Trend-Following Model: Strong Downtrend
Our weekly trend-following model classifies the current market price position as: Strong Downtrend. The current action for the model is considered to be: Hold – Maintain Short Position.
| CORN Futures Statistics | SPECULATORS | COMMERCIALS | SMALL TRADERS |
| – Percent of Open Interest Longs: | 20.8 | 43.8 | 9.3 |
| – Percent of Open Interest Shorts: | 30.6 | 32.5 | 10.8 |
| – Net Position: | -154,005 | 178,071 | -24,066 |
| – Gross Longs: | 328,996 | 690,965 | 146,234 |
| – Gross Shorts: | 483,001 | 512,894 | 170,300 |
| – Long to Short Ratio: | 0.7 to 1 | 1.3 to 1 | 0.9 to 1 |
| NET POSITION TREND: | | | |
| – Strength Index Score (3 Year Range Pct): | 14.3 | 86.1 | 75.6 |
| – Strength Index Reading (3 Year Range): | Bearish-Extreme | Bullish-Extreme | Bullish |
| NET POSITION MOVEMENT INDEX: | | | |
| – 6-Week Change in Strength Index: | 9.5 | -7.7 | -22.6 |
SUGAR Futures:
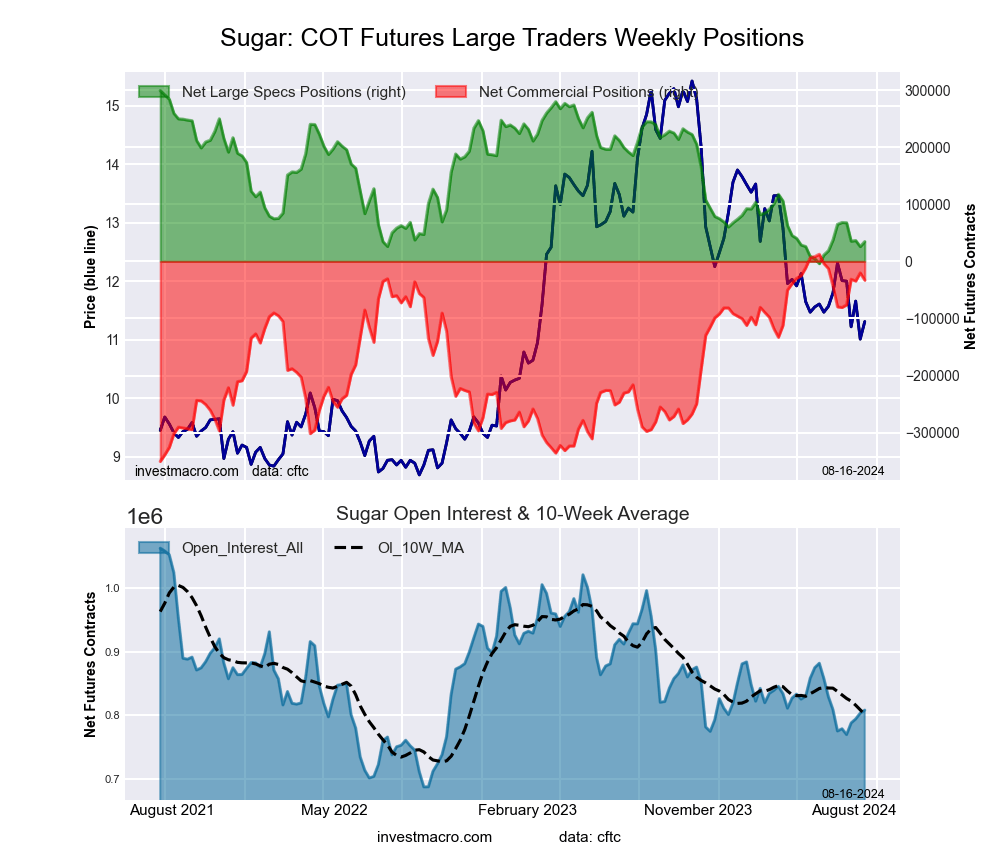 The SUGAR large speculator standing this week resulted in a net position of 34,562 contracts in the data reported through Tuesday. This was a weekly gain of 8,747 contracts from the previous week which had a total of 25,815 net contracts.
This week’s current strength score (the trader positioning range over the past three years, measured from 0 to 100) shows the speculators are currently Bearish-Extreme with a score of 12.7 percent. The commercials are Bullish-Extreme with a score of 87.5 percent and the small traders (not shown in chart) are Bearish-Extreme with a score of 17.6 percent.
Price Trend-Following Model: Downtrend
Our weekly trend-following model classifies the current market price position as: Downtrend. The current action for the model is considered to be: Hold – Maintain Short Position.
| SUGAR Futures Statistics | SPECULATORS | COMMERCIALS | SMALL TRADERS |
| – Percent of Open Interest Longs: | 23.4 | 54.0 | 7.5 |
| – Percent of Open Interest Shorts: | 19.1 | 58.1 | 7.7 |
| – Net Position: | 34,562 | -33,023 | -1,539 |
| – Gross Longs: | 188,878 | 436,150 | 60,828 |
| – Gross Shorts: | 154,316 | 469,173 | 62,367 |
| – Long to Short Ratio: | 1.2 to 1 | 0.9 to 1 | 1.0 to 1 |
| NET POSITION TREND: | | | |
| – Strength Index Score (3 Year Range Pct): | 12.7 | 87.5 | 17.6 |
| – Strength Index Reading (3 Year Range): | Bearish-Extreme | Bullish-Extreme | Bearish-Extreme |
| NET POSITION MOVEMENT INDEX: | | | |
| – 6-Week Change in Strength Index: | -10.0 | 12.9 | -21.3 |
COFFEE Futures:
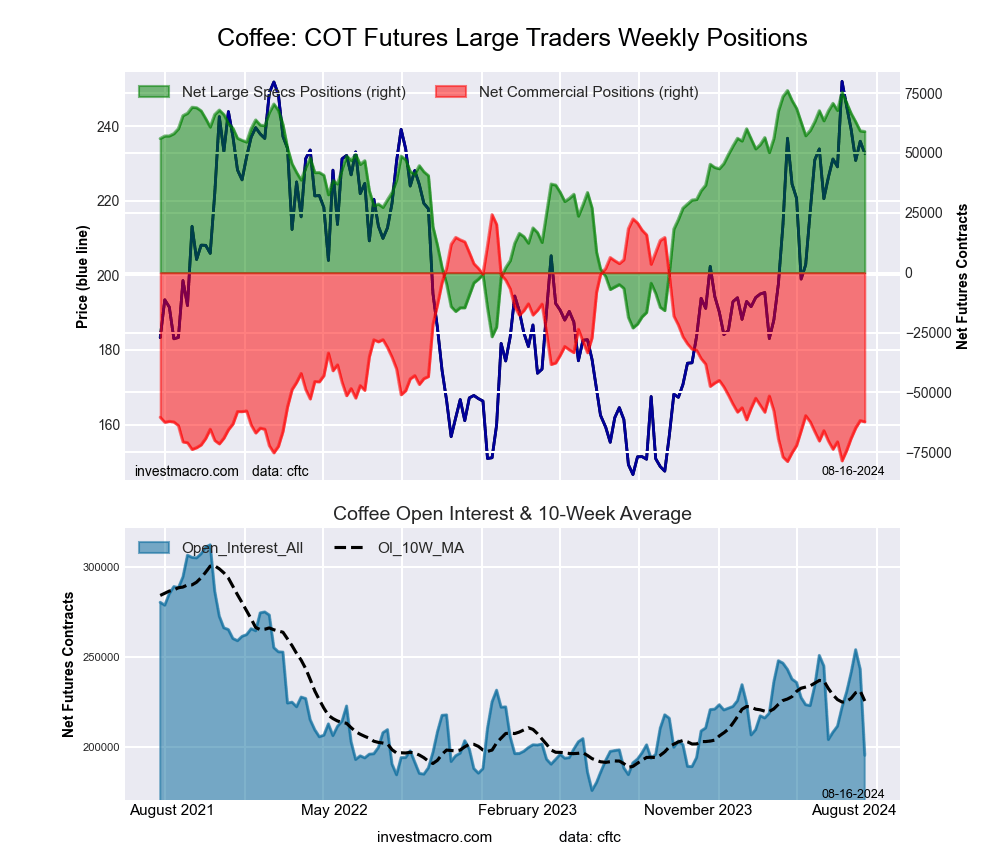 The COFFEE large speculator standing this week resulted in a net position of 58,940 contracts in the data reported through Tuesday. This was a weekly fall of -267 contracts from the previous week which had a total of 59,207 net contracts.
This week’s current strength score (the trader positioning range over the past three years, measured from 0 to 100) shows the speculators are currently Bullish-Extreme with a score of 83.3 percent. The commercials are Bearish-Extreme with a score of 16.1 percent and the small traders (not shown in chart) are Bullish with a score of 68.0 percent.
Price Trend-Following Model: Strong Uptrend
Our weekly trend-following model classifies the current market price position as: Strong Uptrend. The current action for the model is considered to be: Hold – Maintain Long Position.
| COFFEE Futures Statistics | SPECULATORS | COMMERCIALS | SMALL TRADERS |
| – Percent of Open Interest Longs: | 37.3 | 44.0 | 4.2 |
| – Percent of Open Interest Shorts: | 7.1 | 75.9 | 2.5 |
| – Net Position: | 58,940 | -62,278 | 3,338 |
| – Gross Longs: | 72,866 | 85,835 | 8,160 |
| – Gross Shorts: | 13,926 | 148,113 | 4,822 |
| – Long to Short Ratio: | 5.2 to 1 | 0.6 to 1 | 1.7 to 1 |
| NET POSITION TREND: | | | |
| – Strength Index Score (3 Year Range Pct): | 83.3 | 16.1 | 68.0 |
| – Strength Index Reading (3 Year Range): | Bullish-Extreme | Bearish-Extreme | Bullish |
| NET POSITION MOVEMENT INDEX: | | | |
| – 6-Week Change in Strength Index: | -8.6 | 8.1 | 7.5 |
SOYBEANS Futures:
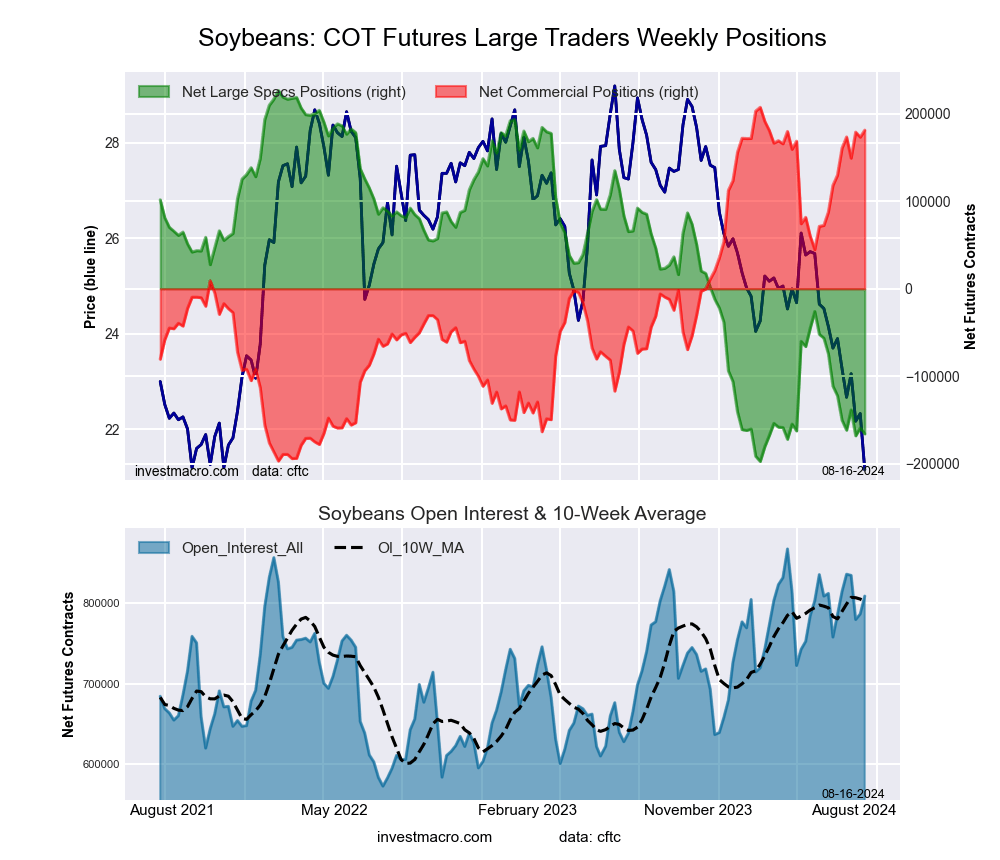 The SOYBEANS large speculator standing this week resulted in a net position of -165,723 contracts in the data reported through Tuesday. This was a weekly reduction of -6,595 contracts from the previous week which had a total of -159,128 net contracts.
This week’s current strength score (the trader positioning range over the past three years, measured from 0 to 100) shows the speculators are currently Bearish-Extreme with a score of 7.4 percent. The commercials are Bullish-Extreme with a score of 93.5 percent and the small traders (not shown in chart) are Bullish with a score of 72.1 percent.
Price Trend-Following Model: Strong Downtrend
Our weekly trend-following model classifies the current market price position as: Strong Downtrend. The current action for the model is considered to be: Hold – Maintain Short Position.
| SOYBEANS Futures Statistics | SPECULATORS | COMMERCIALS | SMALL TRADERS |
| – Percent of Open Interest Longs: | 14.6 | 60.5 | 5.1 |
| – Percent of Open Interest Shorts: | 35.1 | 38.1 | 7.0 |
| – Net Position: | -165,723 | 181,179 | -15,456 |
| – Gross Longs: | 118,322 | 489,829 | 41,443 |
| – Gross Shorts: | 284,045 | 308,650 | 56,899 |
| – Long to Short Ratio: | 0.4 to 1 | 1.6 to 1 | 0.7 to 1 |
| NET POSITION TREND: | | | |
| – Strength Index Score (3 Year Range Pct): | 7.4 | 93.5 | 72.1 |
| – Strength Index Reading (3 Year Range): | Bearish-Extreme | Bullish-Extreme | Bullish |
| NET POSITION MOVEMENT INDEX: | | | |
| – 6-Week Change in Strength Index: | -10.3 | 12.7 | -20.5 |
SOYBEAN OIL Futures:
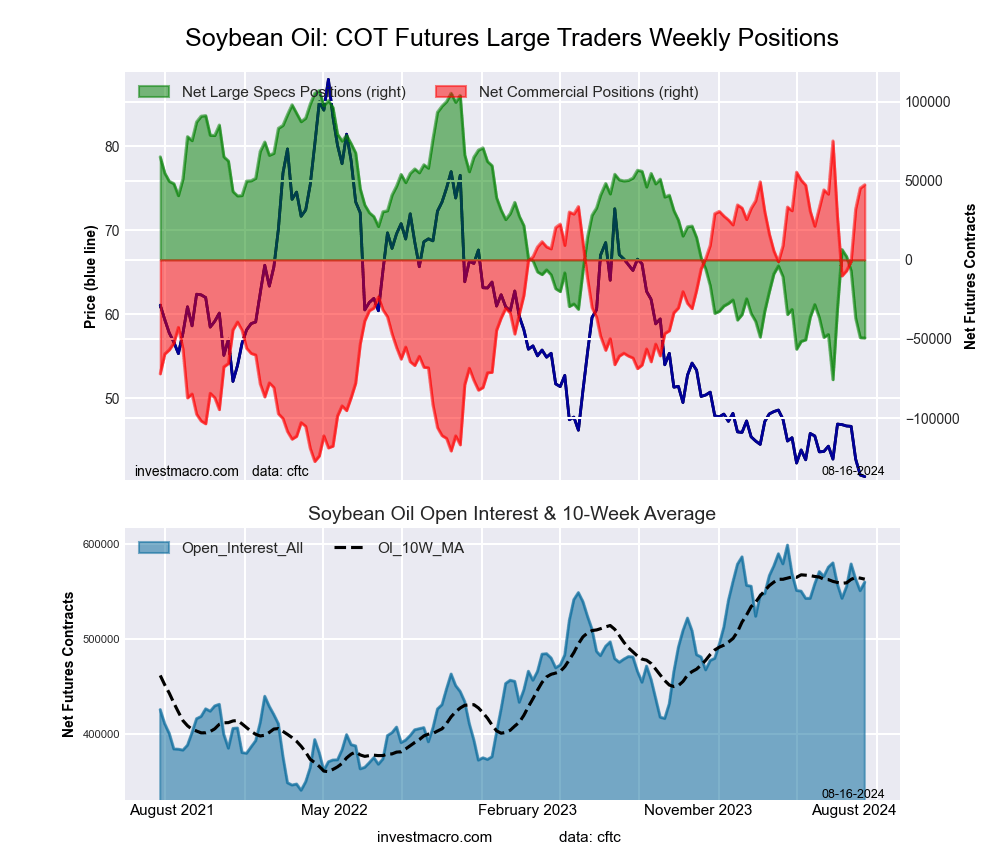 The SOYBEAN OIL large speculator standing this week resulted in a net position of -49,363 contracts in the data reported through Tuesday. This was a weekly fall of -197 contracts from the previous week which had a total of -49,166 net contracts.
This week’s current strength score (the trader positioning range over the past three years, measured from 0 to 100) shows the speculators are currently Bearish-Extreme with a score of 14.4 percent. The commercials are Bullish-Extreme with a score of 86.3 percent and the small traders (not shown in chart) are Bearish with a score of 21.7 percent.
Price Trend-Following Model: Strong Downtrend
Our weekly trend-following model classifies the current market price position as: Strong Downtrend. The current action for the model is considered to be: Hold – Maintain Short Position.
| SOYBEAN OIL Futures Statistics | SPECULATORS | COMMERCIALS | SMALL TRADERS |
| – Percent of Open Interest Longs: | 21.9 | 53.7 | 5.1 |
| – Percent of Open Interest Shorts: | 30.7 | 45.3 | 4.8 |
| – Net Position: | -49,363 | 47,407 | 1,956 |
| – Gross Longs: | 122,456 | 300,924 | 28,595 |
| – Gross Shorts: | 171,819 | 253,517 | 26,639 |
| – Long to Short Ratio: | 0.7 to 1 | 1.2 to 1 | 1.1 to 1 |
| NET POSITION TREND: | | | |
| – Strength Index Score (3 Year Range Pct): | 14.4 | 86.3 | 21.7 |
| – Strength Index Reading (3 Year Range): | Bearish-Extreme | Bullish-Extreme | Bearish |
| NET POSITION MOVEMENT INDEX: | | | |
| – 6-Week Change in Strength Index: | -10.2 | 10.1 | -7.3 |
SOYBEAN MEAL Futures:
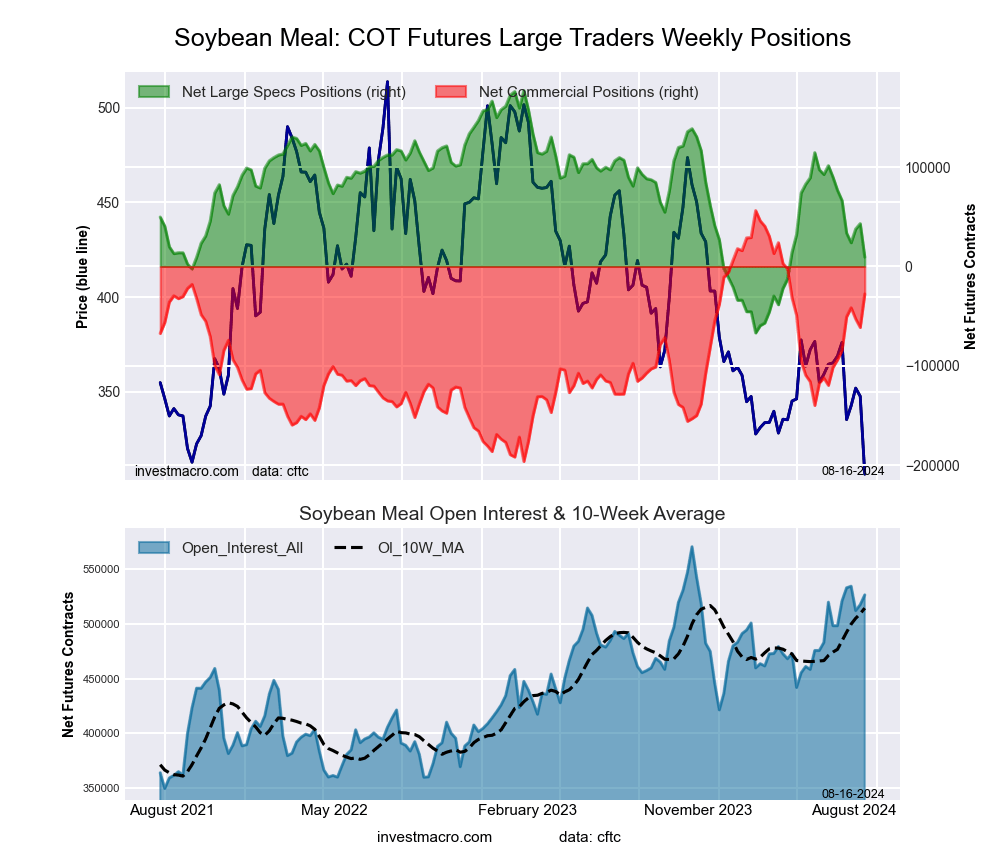 The SOYBEAN MEAL large speculator standing this week resulted in a net position of 9,415 contracts in the data reported through Tuesday. This was a weekly reduction of -33,676 contracts from the previous week which had a total of 43,091 net contracts.
This week’s current strength score (the trader positioning range over the past three years, measured from 0 to 100) shows the speculators are currently Bearish with a score of 31.3 percent. The commercials are Bullish with a score of 66.7 percent and the small traders (not shown in chart) are Bearish with a score of 37.9 percent.
Price Trend-Following Model: Strong Downtrend
Our weekly trend-following model classifies the current market price position as: Strong Downtrend. The current action for the model is considered to be: New Sell – Short Position.
| SOYBEAN MEAL Futures Statistics | SPECULATORS | COMMERCIALS | SMALL TRADERS |
| – Percent of Open Interest Longs: | 21.0 | 46.8 | 9.5 |
| – Percent of Open Interest Shorts: | 19.2 | 52.1 | 6.0 |
| – Net Position: | 9,415 | -27,706 | 18,291 |
| – Gross Longs: | 110,758 | 246,538 | 49,884 |
| – Gross Shorts: | 101,343 | 274,244 | 31,593 |
| – Long to Short Ratio: | 1.1 to 1 | 0.9 to 1 | 1.6 to 1 |
| NET POSITION TREND: | | | |
| – Strength Index Score (3 Year Range Pct): | 31.3 | 66.7 | 37.9 |
| – Strength Index Reading (3 Year Range): | Bearish | Bullish | Bearish |
| NET POSITION MOVEMENT INDEX: | | | |
| – 6-Week Change in Strength Index: | -27.6 | 26.2 | 4.7 |
LIVE CATTLE Futures:
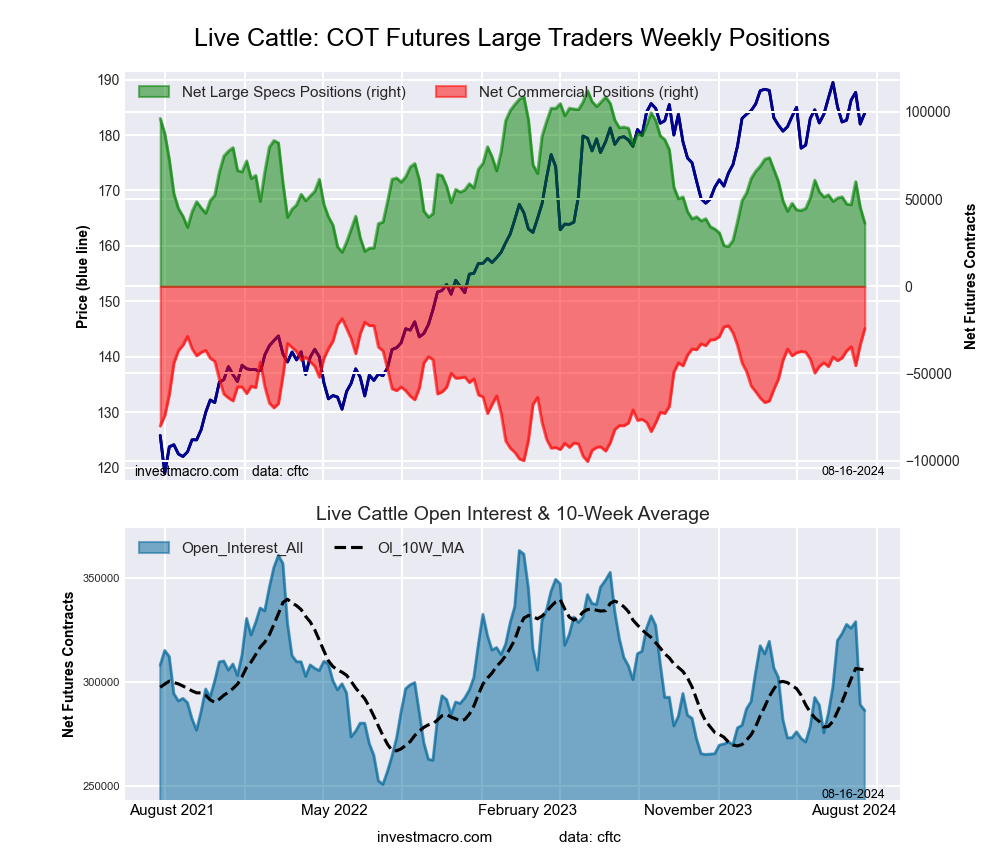 The LIVE CATTLE large speculator standing this week resulted in a net position of 36,237 contracts in the data reported through Tuesday. This was a weekly lowering of -9,035 contracts from the previous week which had a total of 45,272 net contracts.
This week’s current strength score (the trader positioning range over the past three years, measured from 0 to 100) shows the speculators are currently Bearish-Extreme with a score of 18.0 percent. The commercials are Bullish-Extreme with a score of 93.0 percent and the small traders (not shown in chart) are Bearish with a score of 26.0 percent.
Price Trend-Following Model: Uptrend
Our weekly trend-following model classifies the current market price position as: Uptrend. The current action for the model is considered to be: Hold – Maintain Long Position.
| LIVE CATTLE Futures Statistics | SPECULATORS | COMMERCIALS | SMALL TRADERS |
| – Percent of Open Interest Longs: | 34.8 | 35.4 | 9.9 |
| – Percent of Open Interest Shorts: | 22.2 | 43.9 | 14.1 |
| – Net Position: | 36,237 | -24,267 | -11,970 |
| – Gross Longs: | 99,758 | 101,334 | 28,459 |
| – Gross Shorts: | 63,521 | 125,601 | 40,429 |
| – Long to Short Ratio: | 1.6 to 1 | 0.8 to 1 | 0.7 to 1 |
| NET POSITION TREND: | | | |
| – Strength Index Score (3 Year Range Pct): | 18.0 | 93.0 | 26.0 |
| – Strength Index Reading (3 Year Range): | Bearish-Extreme | Bullish-Extreme | Bearish |
| NET POSITION MOVEMENT INDEX: | | | |
| – 6-Week Change in Strength Index: | -15.5 | 22.5 | -21.5 |
LEAN HOGS Futures:
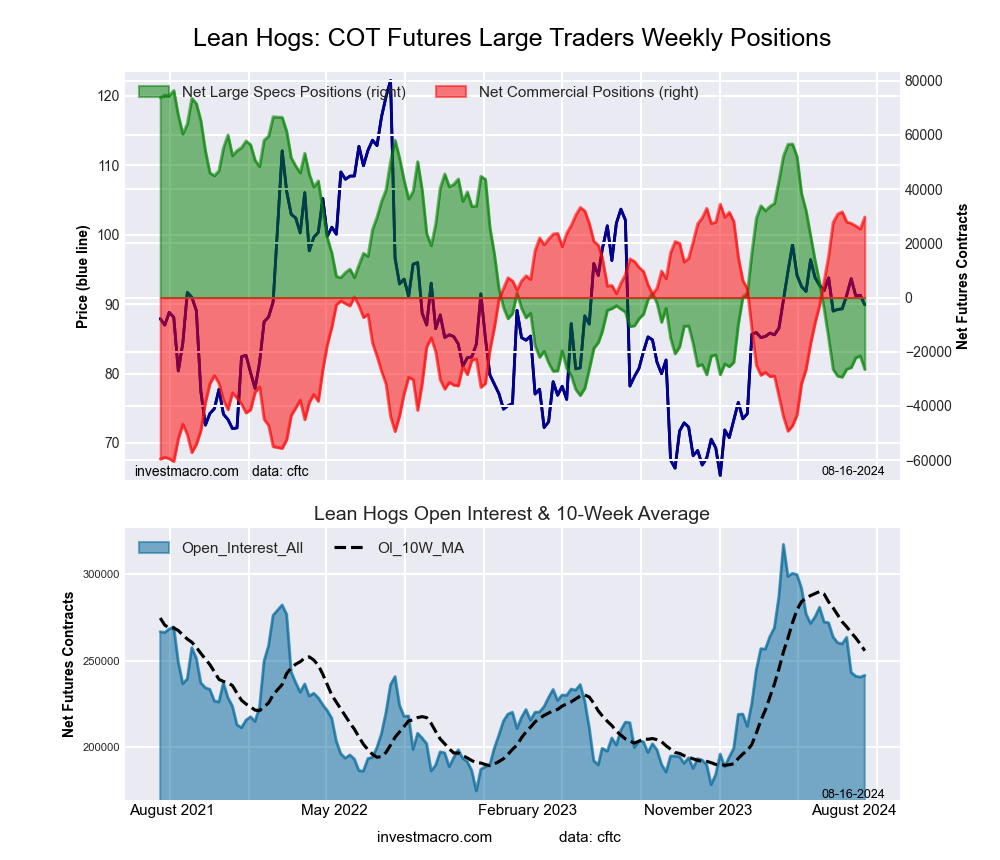 The LEAN HOGS large speculator standing this week resulted in a net position of -26,488 contracts in the data reported through Tuesday. This was a weekly reduction of -4,998 contracts from the previous week which had a total of -21,490 net contracts.
This week’s current strength score (the trader positioning range over the past three years, measured from 0 to 100) shows the speculators are currently Bearish-Extreme with a score of 8.6 percent. The commercials are Bullish-Extreme with a score of 95.0 percent and the small traders (not shown in chart) are Bullish with a score of 69.0 percent.
Price Trend-Following Model: Strong Downtrend
Our weekly trend-following model classifies the current market price position as: Strong Downtrend. The current action for the model is considered to be: New Sell – Short Position.
| LEAN HOGS Futures Statistics | SPECULATORS | COMMERCIALS | SMALL TRADERS |
| – Percent of Open Interest Longs: | 35.0 | 39.1 | 6.5 |
| – Percent of Open Interest Shorts: | 46.0 | 26.8 | 7.8 |
| – Net Position: | -26,488 | 29,684 | -3,196 |
| – Gross Longs: | 84,570 | 94,470 | 15,656 |
| – Gross Shorts: | 111,058 | 64,786 | 18,852 |
| – Long to Short Ratio: | 0.8 to 1 | 1.5 to 1 | 0.8 to 1 |
| NET POSITION TREND: | | | |
| – Strength Index Score (3 Year Range Pct): | 8.6 | 95.0 | 69.0 |
| – Strength Index Reading (3 Year Range): | Bearish-Extreme | Bullish-Extreme | Bullish |
| NET POSITION MOVEMENT INDEX: | | | |
| – 6-Week Change in Strength Index: | 2.2 | -1.2 | -6.2 |
COTTON Futures:
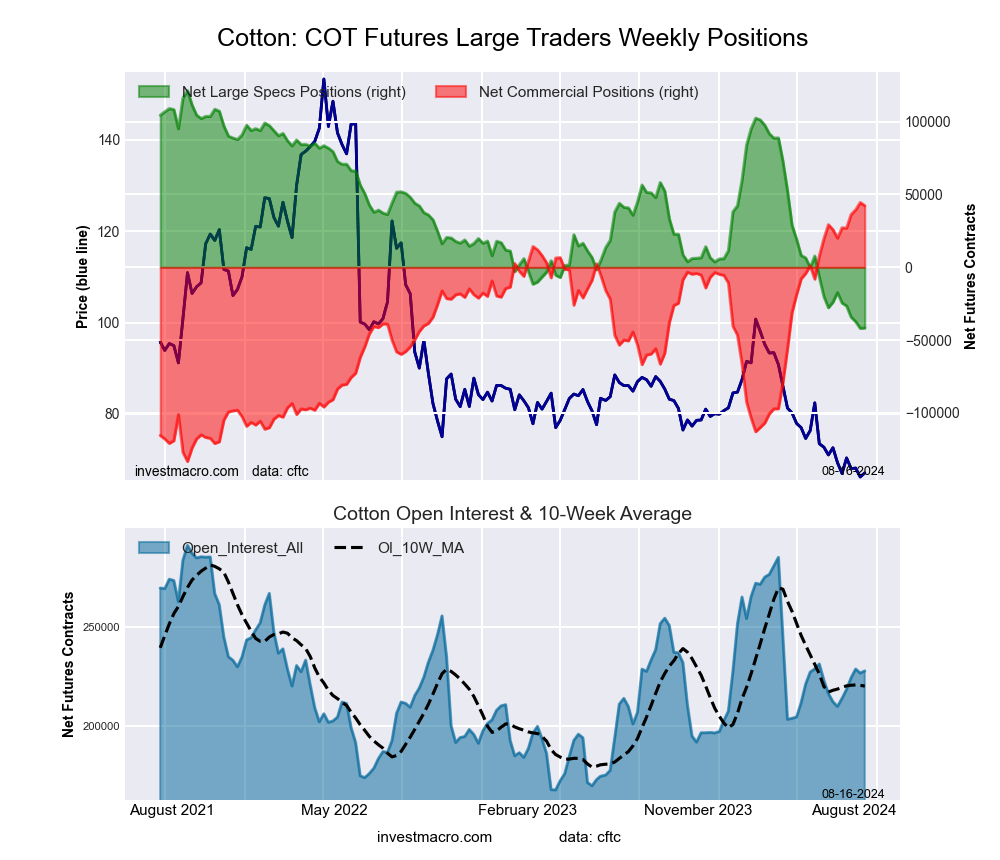 The COTTON large speculator standing this week resulted in a net position of -41,670 contracts in the data reported through Tuesday. This was a weekly gain of 238 contracts from the previous week which had a total of -41,908 net contracts.
This week’s current strength score (the trader positioning range over the past three years, measured from 0 to 100) shows the speculators are currently Bearish-Extreme with a score of 0.1 percent. The commercials are Bullish-Extreme with a score of 98.8 percent and the small traders (not shown in chart) are Bearish-Extreme with a score of 12.7 percent.
Price Trend-Following Model: Downtrend
Our weekly trend-following model classifies the current market price position as: Downtrend. The current action for the model is considered to be: Hold – Maintain Short Position.
| COTTON Futures Statistics | SPECULATORS | COMMERCIALS | SMALL TRADERS |
| – Percent of Open Interest Longs: | 26.1 | 49.4 | 6.2 |
| – Percent of Open Interest Shorts: | 44.4 | 30.8 | 6.4 |
| – Net Position: | -41,670 | 42,276 | -606 |
| – Gross Longs: | 59,448 | 112,563 | 14,072 |
| – Gross Shorts: | 101,118 | 70,287 | 14,678 |
| – Long to Short Ratio: | 0.6 to 1 | 1.6 to 1 | 1.0 to 1 |
| NET POSITION TREND: | | | |
| – Strength Index Score (3 Year Range Pct): | 0.1 | 98.8 | 12.7 |
| – Strength Index Reading (3 Year Range): | Bearish-Extreme | Bullish-Extreme | Bearish-Extreme |
| NET POSITION MOVEMENT INDEX: | | | |
| – 6-Week Change in Strength Index: | -14.9 | 12.5 | 12.7 |
COCOA Futures:
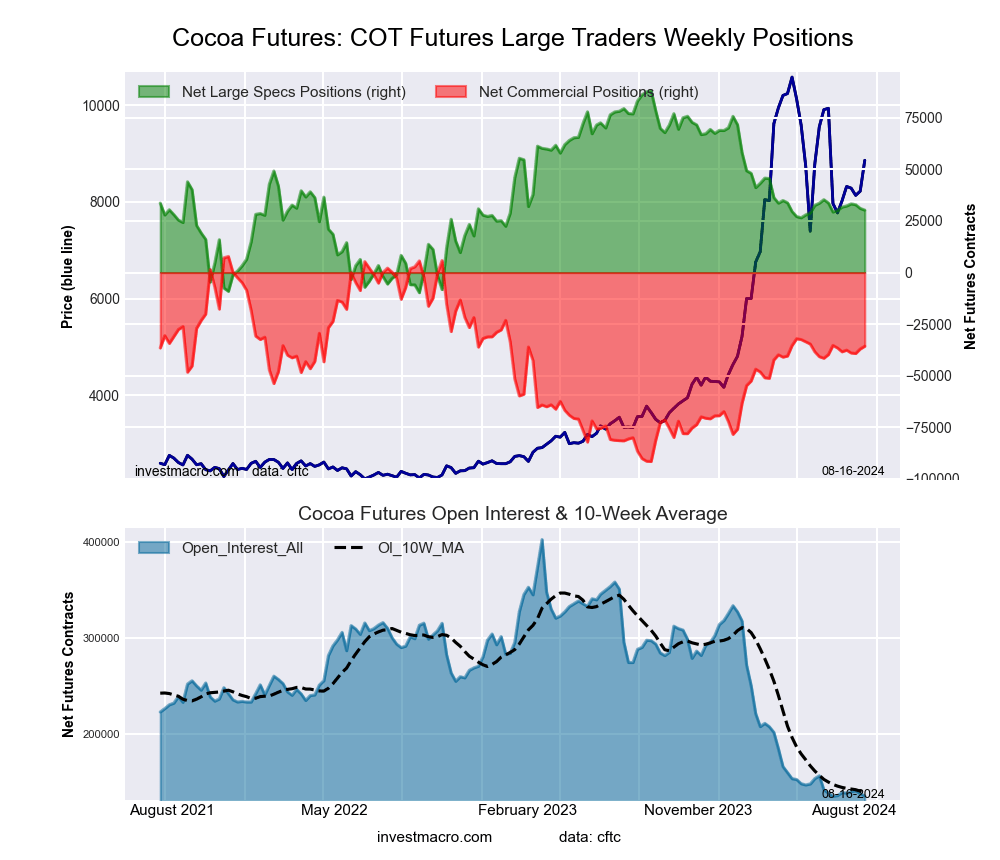 The COCOA large speculator standing this week resulted in a net position of 30,268 contracts in the data reported through Tuesday. This was a weekly lowering of -829 contracts from the previous week which had a total of 31,097 net contracts.
This week’s current strength score (the trader positioning range over the past three years, measured from 0 to 100) shows the speculators are currently Bearish with a score of 40.8 percent. The commercials are Bullish with a score of 56.2 percent and the small traders (not shown in chart) are Bullish with a score of 58.8 percent.
Price Trend-Following Model: Downtrend
Our weekly trend-following model classifies the current market price position as: Downtrend. The current action for the model is considered to be: Hold – Maintain Short Position.
| COCOA Futures Statistics | SPECULATORS | COMMERCIALS | SMALL TRADERS |
| – Percent of Open Interest Longs: | 37.8 | 33.6 | 8.2 |
| – Percent of Open Interest Shorts: | 15.4 | 60.1 | 4.1 |
| – Net Position: | 30,268 | -35,738 | 5,470 |
| – Gross Longs: | 51,018 | 45,333 | 11,037 |
| – Gross Shorts: | 20,750 | 81,071 | 5,567 |
| – Long to Short Ratio: | 2.5 to 1 | 0.6 to 1 | 2.0 to 1 |
| NET POSITION TREND: | | | |
| – Strength Index Score (3 Year Range Pct): | 40.8 | 56.2 | 58.8 |
| – Strength Index Reading (3 Year Range): | Bearish | Bullish | Bullish |
| NET POSITION MOVEMENT INDEX: | | | |
| – 6-Week Change in Strength Index: | 0.1 | 0.9 | -8.1 |
WHEAT Futures:
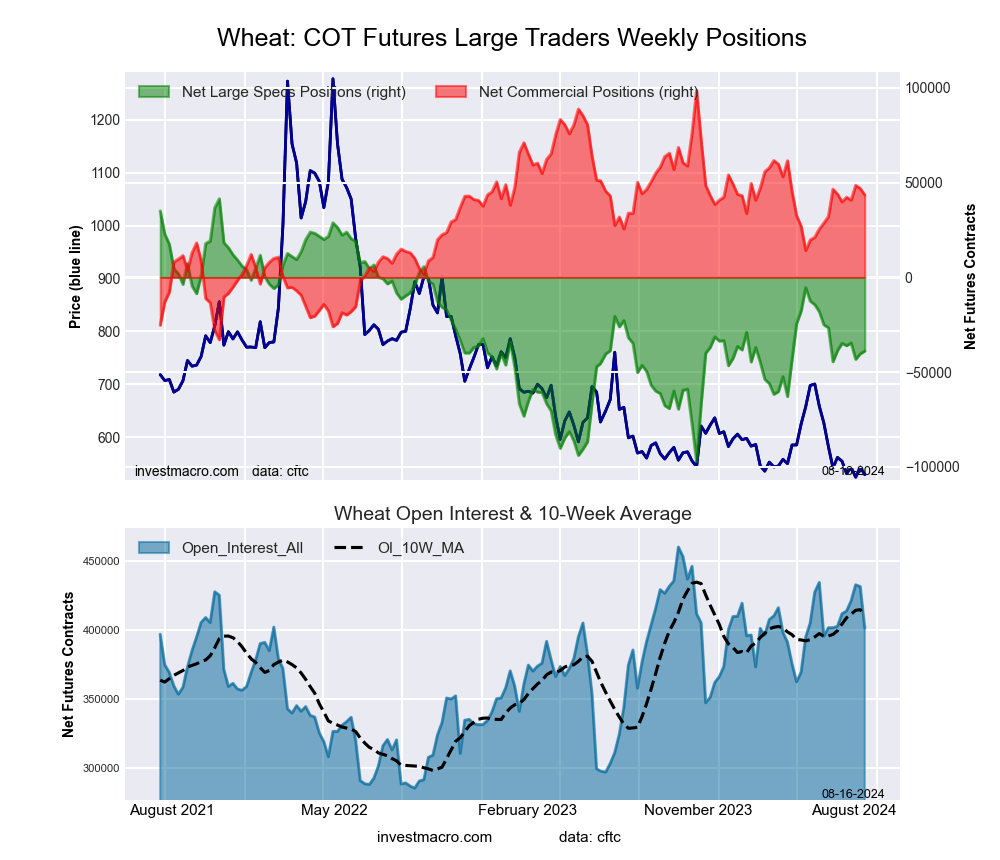 The WHEAT large speculator standing this week resulted in a net position of -38,905 contracts in the data reported through Tuesday. This was a weekly increase of 1,480 contracts from the previous week which had a total of -40,385 net contracts.
This week’s current strength score (the trader positioning range over the past three years, measured from 0 to 100) shows the speculators are currently Bearish with a score of 42.0 percent. The commercials are Bullish with a score of 58.1 percent and the small traders (not shown in chart) are Bearish with a score of 39.2 percent.
Price Trend-Following Model: Strong Downtrend
Our weekly trend-following model classifies the current market price position as: Strong Downtrend. The current action for the model is considered to be: Hold – Maintain Short Position.
| WHEAT Futures Statistics | SPECULATORS | COMMERCIALS | SMALL TRADERS |
| – Percent of Open Interest Longs: | 31.2 | 36.8 | 7.8 |
| – Percent of Open Interest Shorts: | 40.9 | 26.0 | 8.9 |
| – Net Position: | -38,905 | 43,517 | -4,612 |
| – Gross Longs: | 125,365 | 147,937 | 31,254 |
| – Gross Shorts: | 164,270 | 104,420 | 35,866 |
| – Long to Short Ratio: | 0.8 to 1 | 1.4 to 1 | 0.9 to 1 |
| NET POSITION TREND: | | | |
| – Strength Index Score (3 Year Range Pct): | 42.0 | 58.1 | 39.2 |
| – Strength Index Reading (3 Year Range): | Bearish | Bullish | Bearish |
| NET POSITION MOVEMENT INDEX: | | | |
| – 6-Week Change in Strength Index: | -0.2 | -0.3 | 3.1 |
Article By InvestMacro – Receive our weekly COT Newsletter
*COT Report: The COT data, released weekly to the public each Friday, is updated through the most recent Tuesday (data is 3 days old) and shows a quick view of how large speculators or non-commercials (for-profit traders) were positioned in the futures markets.
The CFTC categorizes trader positions according to commercial hedgers (traders who use futures contracts for hedging as part of the business), non-commercials (large traders who speculate to realize trading profits) and nonreportable traders (usually small traders/speculators) as well as their open interest (contracts open in the market at time of reporting). See CFTC criteria here.