By InvestMacro
Here are the latest charts and statistics for the Commitment of Traders (COT) data published by the Commodities Futures Trading Commission (CFTC).
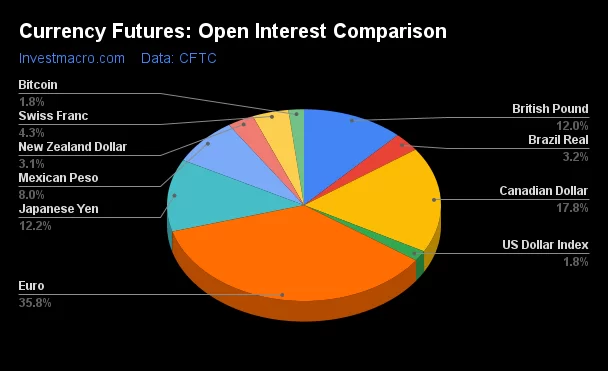
The latest COT data is updated through Tuesday October 29th and shows a quick view of how large market participants (for-profit speculators and commercial traders) were positioned in the futures markets. All currency positions are in direct relation to the US dollar where, for example, a bet for the euro is a bet that the euro will rise versus the dollar while a bet against the euro will be a bet that the euro will decline versus the dollar.
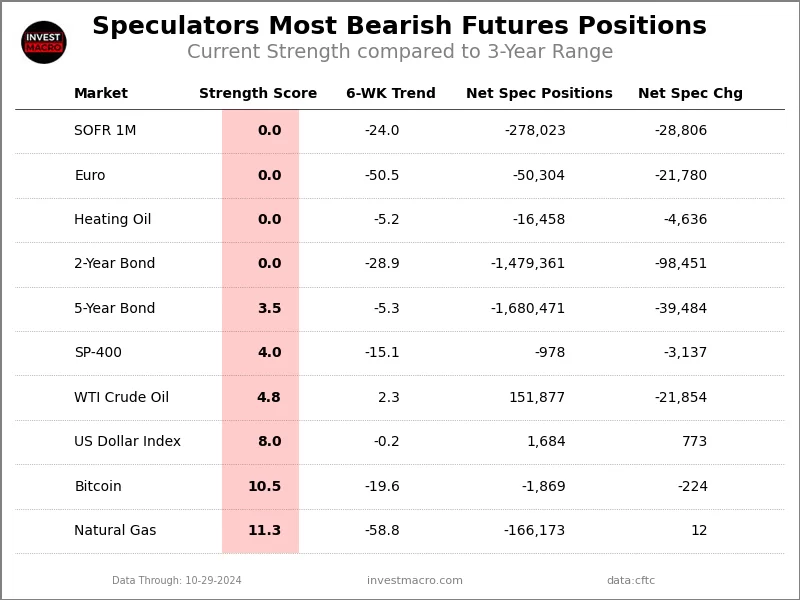
Weekly Speculator Changes led by US Dollar Index & Mexican Peso
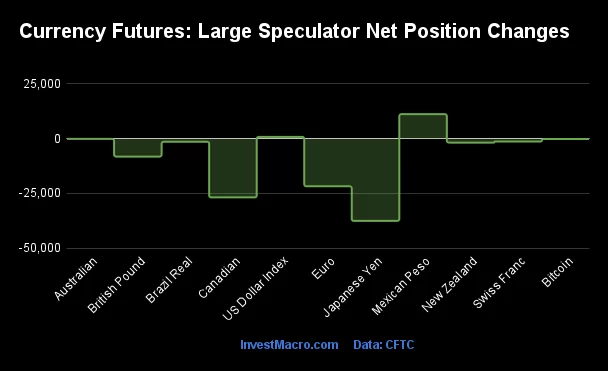
The COT currency market speculator bets were overall lower this week as just two out of the eleven currency markets we cover had higher positioning while the other nine markets had lower speculator contracts.
Leading the gains for the currency markets was the Mexican Peso (11,148 contracts) with the US Dollar Index (773 contracts) also coming through with a positive week.
The currencies seeing declines in speculator bets on the week were the Japanese Yen (-37,588 contracts), the EuroFX (-21,780 contracts), the Canadian Dollar (-26,868 contracts), the British Pound (-8,220 contracts), the New Zealand Dollar (-1,844 contracts), the Brazilian Real (-1,464 contracts), the Swiss Franc (-1,344 contracts), Bitcoin (-224 contracts) and with the Australian Dollar (-163 contracts) also registering lower bets on the week.
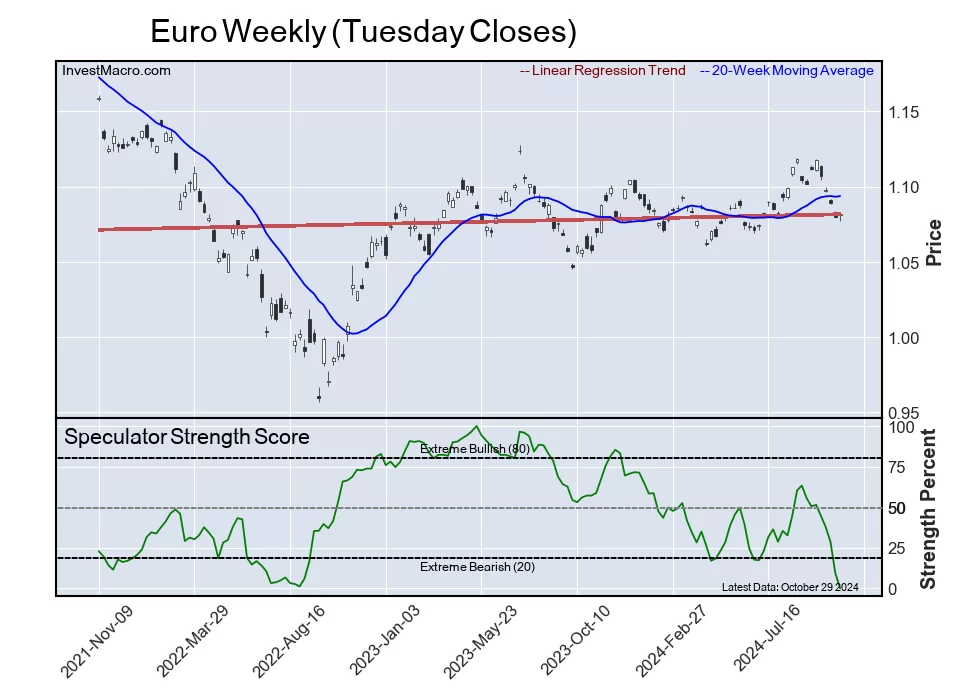
Currency Speculators continue to shed Euro bets for 5th week
Highlighting the COT currency’s data this week is sharp decrease in bets for the Euro currency speculators. Large speculators have dropped their Euro positions for a fifth consecutive week and for the seventh time in the past eight weeks through Tuesday.
The Euro spec positions have fallen by -122,002 net contracts in just these last five weeks. This weakness has brought the overall positioning from +71,698 contracts on September 24th to this week’s standing of -50,304 contracts and the lowest level for Euro bets since March 3rd of 2020, a span of 243 weeks.
Helping to dampen the Euro’s appeal is the recent rate reduction by the European Central Bank (ECB). Citing a decline in inflation, the ECB trimmed the benchmark interest rate by 25 basis points from 3.50 percent to 3.26 percent on October 17th and believes the “disinflationary process is well on track“.
The Euro exchange rate versus the US Dollar had touched a yearly high in September at the 1.1249 exchange level. Since then, however, the Euro declined for four straight weeks and fell through the major support/resistance level of 1.10 and then through the 1.09 threshold as well. Currently, the Euro currency is trading right around the 1.0857 level with historical support sitting below at 1.08.
More Speculator positions:
Elsewhere, the US Dollar Index speculator positions perked up a bit this week by +773 contracts and rose for a second straight week. The USD standing is in a small bullish position after falling into a bearish level on October 8th and 15th.
The Japanese yen speculator bets dropped sharply for a second straight week and have now fallen for five straight weeks overall. This has brought the yen positioning back into a bearish level after bets had been in a bullish standing for eleven consecutive weeks.
Canadian dollar speculator positions also continued to drop and fell for the fifth consecutive week. The CAD speculator bets have decreased by a total of -101,910 contracts in just these last five weeks and brings the current position (at a total of -167,499 contracts) to the fourth most bearish standing on record.
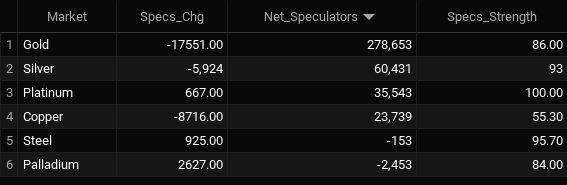
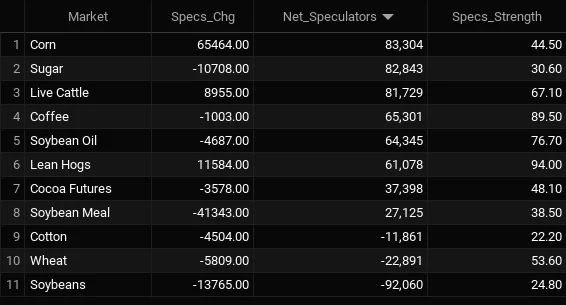
Currencies Net Speculators Leaderboard
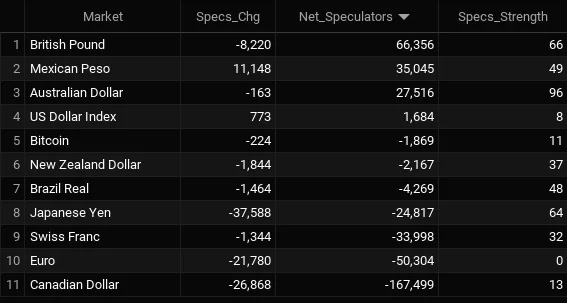
Legend: Weekly Speculators Change | Speculators Current Net Position | Speculators Strength Score compared to last 3-Years (0-100 range)
Strength Scores led by Australian Dollar
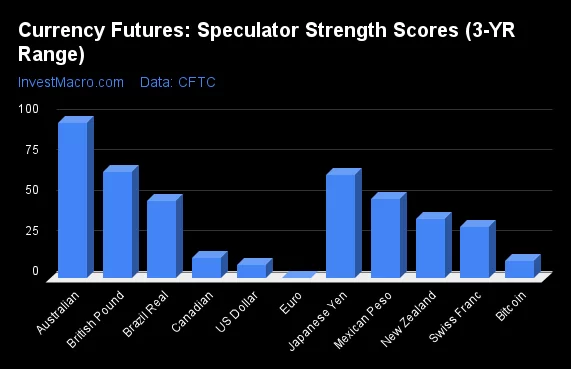
COT Strength Scores (a normalized measure of Speculator positions over a 3-Year range, from 0 to 100 where above 80 is Extreme-Bullish and below 20 is Extreme-Bearish) showed that the Australian Dollar (96 percent) and the leads the currency markets this week. The British Pound (66 percent) and the Japanese Yen (64 percent) come in as the next highest in the weekly strength scores.
On the downside, the EuroFX (0 percent), the US Dollar Index (8 percent), Bitcoin (11 percent) and the Canadian Dollar (13 percent) come in at the lowest strength levels currently and are in Extreme-Bearish territory (below 20 percent). The next lowest strength scores are .
3-Year Strength Statistics:
US Dollar Index (8.0 percent) vs US Dollar Index previous week (6.4 percent)
EuroFX (0.0 percent) vs EuroFX previous week (9.2 percent)
British Pound Sterling (65.9 percent) vs British Pound Sterling previous week (69.6 percent)
Japanese Yen (63.7 percent) vs Japanese Yen previous week (78.7 percent)
Swiss Franc (32.0 percent) vs Swiss Franc previous week (34.7 percent)
Canadian Dollar (12.9 percent) vs Canadian Dollar previous week (24.9 percent)
Australian Dollar (95.8 percent) vs Australian Dollar previous week (95.9 percent)
New Zealand Dollar (36.7 percent) vs New Zealand Dollar previous week (40.3 percent)
Mexican Peso (48.7 percent) vs Mexican Peso previous week (43.2 percent)
Brazilian Real (48.0 percent) vs Brazilian Real previous week (49.4 percent)
Bitcoin (10.5 percent) vs Bitcoin previous week (15.4 percent)
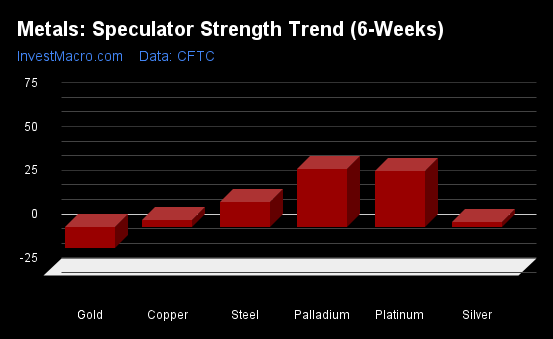
Australian Dollar & Brazilian Real top the 6-Week Strength Trends
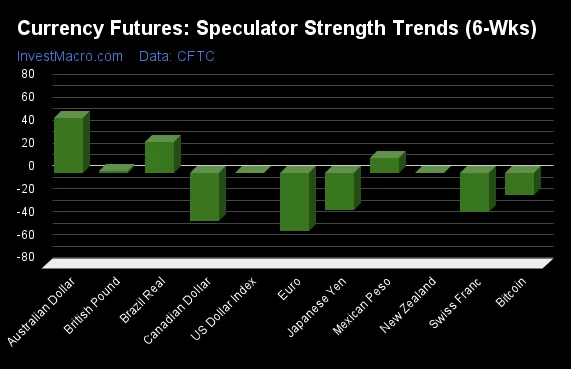
COT Strength Score Trends (or move index, calculates the 6-week changes in strength scores) showed that the Australian Dollar (48 percent) and the Brazilian Real (27 percent) lead the past six weeks trends for the currencies. The Mexican Peso (13 percent) and the British Pound (2 percent) are the next highest positive movers in the 3-Year trends data.
The EuroFX (-51 percent) leads the downside trend scores currently with the Canadian Dollar (-42 percent), Swiss Franc (-34 percent) and the Japanese Yen (-33 percent) following next with lower trend scores.
3-Year Strength Trends:
US Dollar Index (-0.2 percent) vs US Dollar Index previous week (-41.0 percent)
EuroFX (-50.5 percent) vs EuroFX previous week (-46.3 percent)
British Pound Sterling (1.5 percent) vs British Pound Sterling previous week (-7.1 percent)
Japanese Yen (-32.6 percent) vs Japanese Yen previous week (-17.2 percent)
Swiss Franc (-34.2 percent) vs Swiss Franc previous week (-23.0 percent)
Canadian Dollar (-42.3 percent) vs Canadian Dollar previous week (-32.1 percent)
Australian Dollar (48.0 percent) vs Australian Dollar previous week (29.6 percent)
New Zealand Dollar (-0.5 percent) vs New Zealand Dollar previous week (5.8 percent)
Mexican Peso (13.4 percent) vs Mexican Peso previous week (-1.5 percent)
Brazilian Real (26.6 percent) vs Brazilian Real previous week (26.2 percent)
Bitcoin (-19.6 percent) vs Bitcoin previous week (-28.2 percent)
Individual COT Forex Markets:
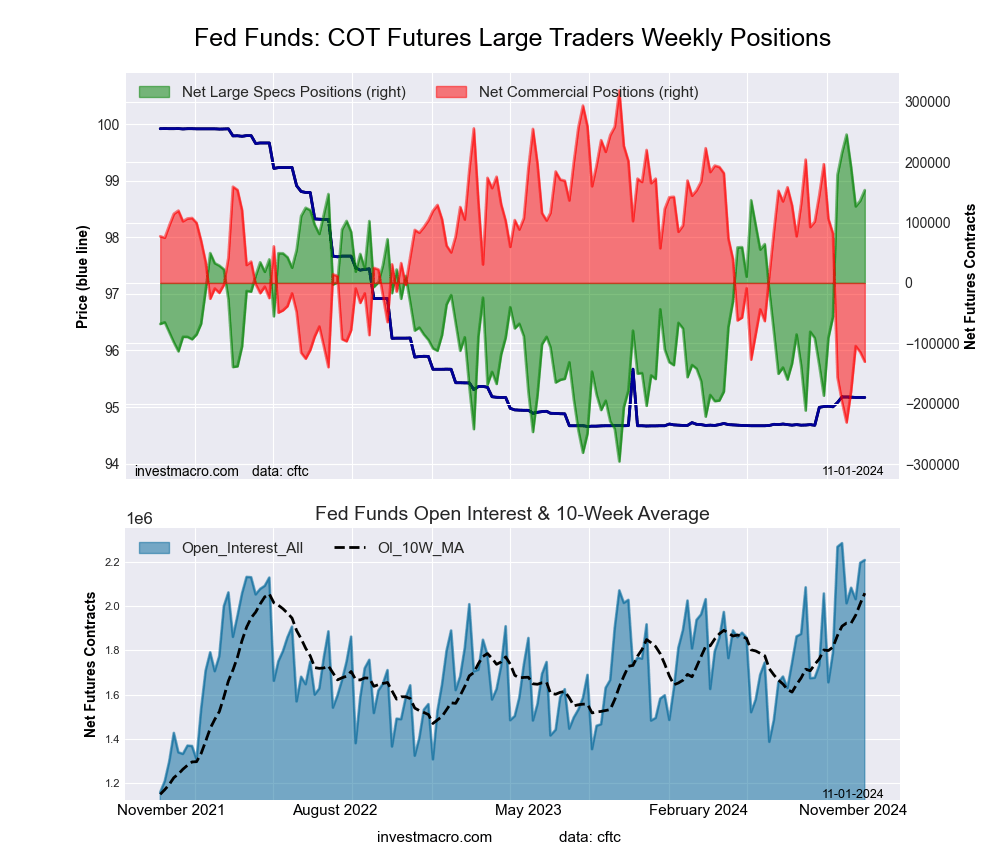
US Dollar Index Futures:
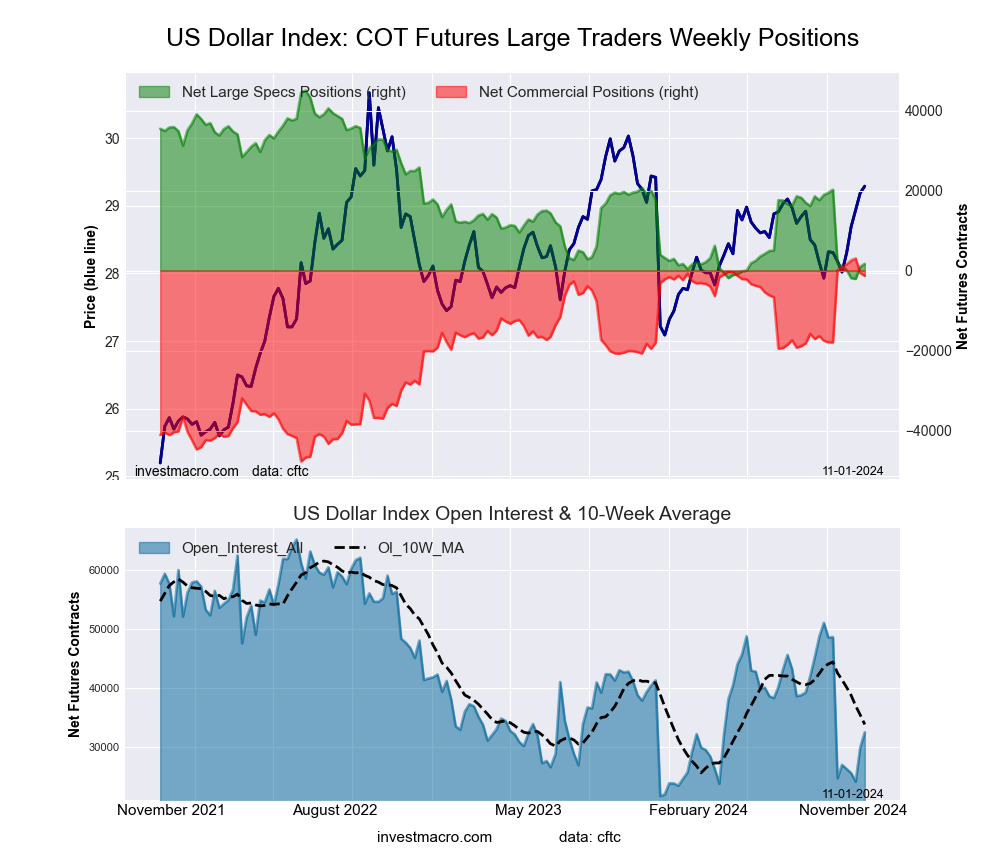 The US Dollar Index large speculator standing this week recorded a net position of 1,684 contracts in the data reported through Tuesday. This was a weekly lift of 773 contracts from the previous week which had a total of 911 net contracts.
This week’s current strength score (the trader positioning range over the past three years, measured from 0 to 100) shows the speculators are currently Bearish-Extreme with a score of 8.0 percent. The commercials are Bullish-Extreme with a score of 91.4 percent and the small traders (not shown in chart) are Bearish-Extreme with a score of 19.7 percent.
Price Trend-Following Model: Weak Downtrend
Our weekly trend-following model classifies the current market price position as: Weak Downtrend.
| US DOLLAR INDEX Statistics | SPECULATORS | COMMERCIALS | SMALL TRADERS |
| – Percent of Open Interest Longs: | 67.1 | 18.8 | 9.5 |
| – Percent of Open Interest Shorts: | 61.9 | 22.9 | 10.6 |
| – Net Position: | 1,684 | -1,329 | -355 |
| – Gross Longs: | 21,825 | 6,126 | 3,093 |
| – Gross Shorts: | 20,141 | 7,455 | 3,448 |
| – Long to Short Ratio: | 1.1 to 1 | 0.8 to 1 | 0.9 to 1 |
| NET POSITION TREND: | | | |
| – Strength Index Score (3 Year Range Pct): | 8.0 | 91.4 | 19.7 |
| – Strength Index Reading (3 Year Range): | Bearish-Extreme | Bullish-Extreme | Bearish-Extreme |
| NET POSITION MOVEMENT INDEX: | | | |
| – 6-Week Change in Strength Index: | -0.2 | -2.8 | 16.0 |
Euro Currency Futures:
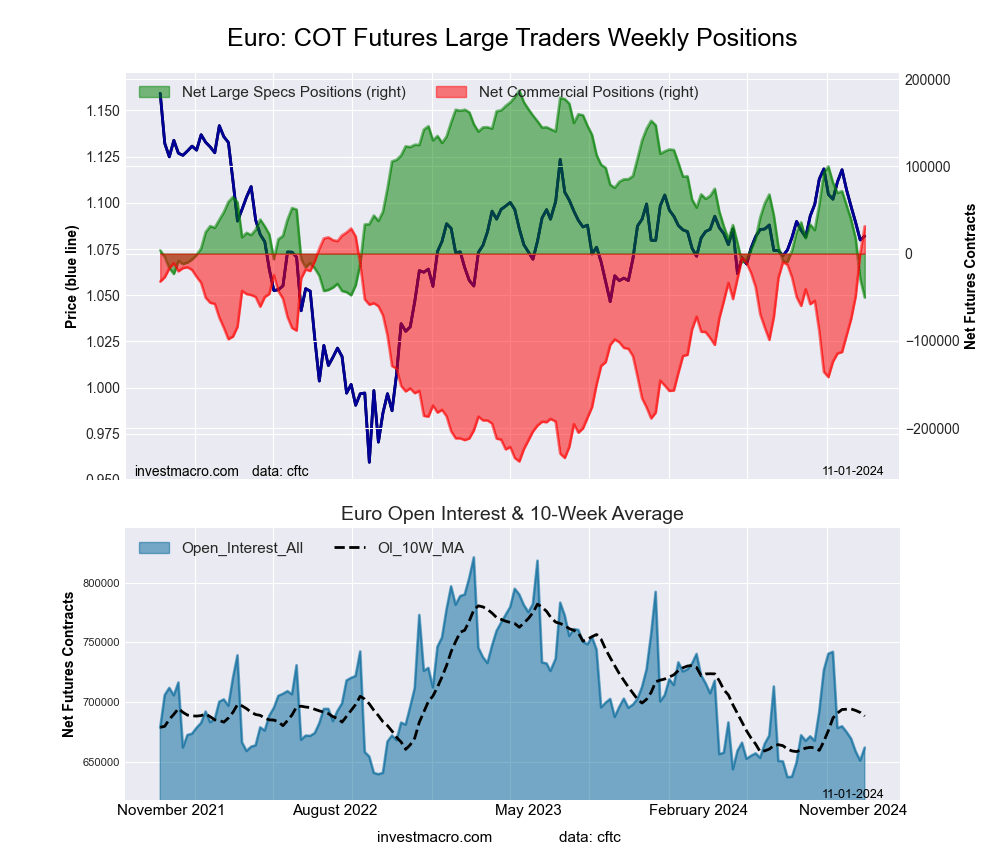 The Euro Currency large speculator standing this week recorded a net position of -50,304 contracts in the data reported through Tuesday. This was a weekly fall of -21,780 contracts from the previous week which had a total of -28,524 net contracts.
This week’s current strength score (the trader positioning range over the past three years, measured from 0 to 100) shows the speculators are currently Bearish-Extreme with a score of 0.0 percent. The commercials are Bullish-Extreme with a score of 100.0 percent and the small traders (not shown in chart) are Bearish-Extreme with a score of 13.0 percent.
Price Trend-Following Model: Weak Uptrend
Our weekly trend-following model classifies the current market price position as: Weak Uptrend.
| EURO Currency Statistics | SPECULATORS | COMMERCIALS | SMALL TRADERS |
| – Percent of Open Interest Longs: | 24.1 | 60.7 | 11.2 |
| – Percent of Open Interest Shorts: | 31.7 | 56.0 | 8.3 |
| – Net Position: | -50,304 | 31,448 | 18,856 |
| – Gross Longs: | 159,313 | 401,671 | 73,780 |
| – Gross Shorts: | 209,617 | 370,223 | 54,924 |
| – Long to Short Ratio: | 0.8 to 1 | 1.1 to 1 | 1.3 to 1 |
| NET POSITION TREND: | | | |
| – Strength Index Score (3 Year Range Pct): | 0.0 | 100.0 | 13.0 |
| – Strength Index Reading (3 Year Range): | Bearish-Extreme | Bullish-Extreme | Bearish-Extreme |
| NET POSITION MOVEMENT INDEX: | | | |
| – 6-Week Change in Strength Index: | -50.5 | 54.1 | -59.0 |
British Pound Sterling Futures:
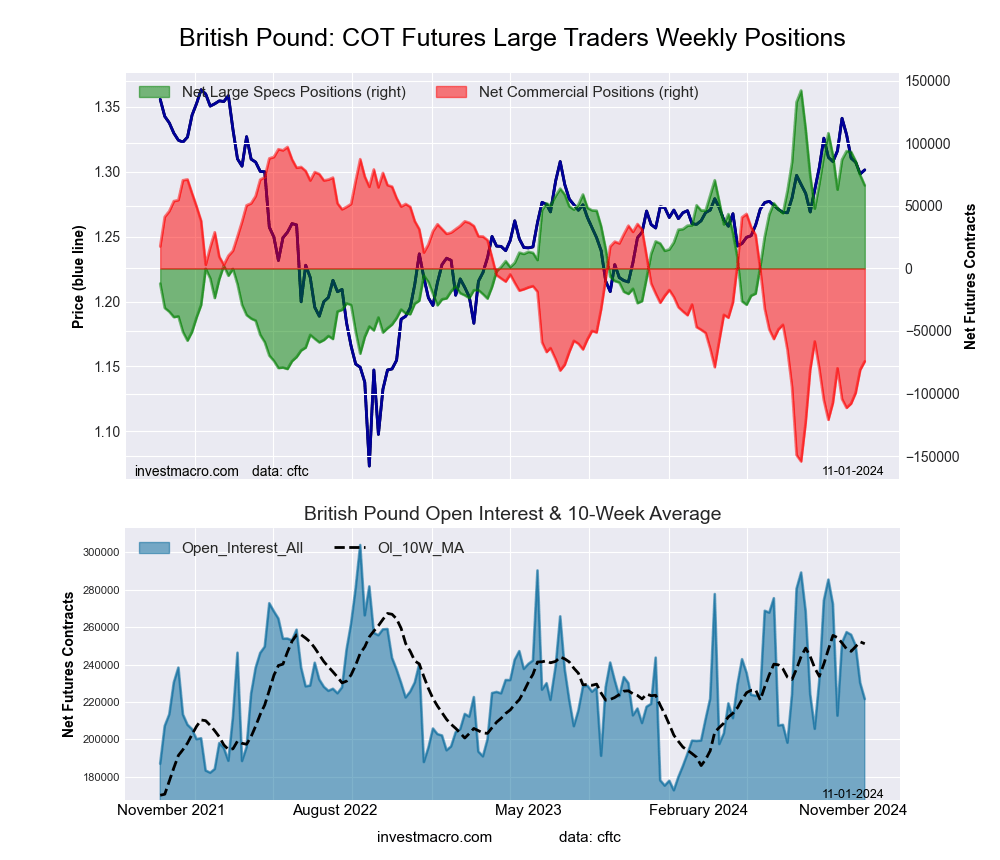 The British Pound Sterling large speculator standing this week recorded a net position of 66,356 contracts in the data reported through Tuesday. This was a weekly fall of -8,220 contracts from the previous week which had a total of 74,576 net contracts.
This week’s current strength score (the trader positioning range over the past three years, measured from 0 to 100) shows the speculators are currently Bullish with a score of 65.9 percent. The commercials are Bearish with a score of 31.8 percent and the small traders (not shown in chart) are Bullish with a score of 78.9 percent.
Price Trend-Following Model: Weak Uptrend
Our weekly trend-following model classifies the current market price position as: Weak Uptrend.
| BRITISH POUND Statistics | SPECULATORS | COMMERCIALS | SMALL TRADERS |
| – Percent of Open Interest Longs: | 59.9 | 21.9 | 14.7 |
| – Percent of Open Interest Shorts: | 29.9 | 55.5 | 11.1 |
| – Net Position: | 66,356 | -74,301 | 7,945 |
| – Gross Longs: | 132,636 | 48,596 | 32,508 |
| – Gross Shorts: | 66,280 | 122,897 | 24,563 |
| – Long to Short Ratio: | 2.0 to 1 | 0.4 to 1 | 1.3 to 1 |
| NET POSITION TREND: | | | |
| – Strength Index Score (3 Year Range Pct): | 65.9 | 31.8 | 78.9 |
| – Strength Index Reading (3 Year Range): | Bullish | Bearish | Bullish |
| NET POSITION MOVEMENT INDEX: | | | |
| – 6-Week Change in Strength Index: | 1.5 | 2.2 | -18.6 |
Japanese Yen Futures:
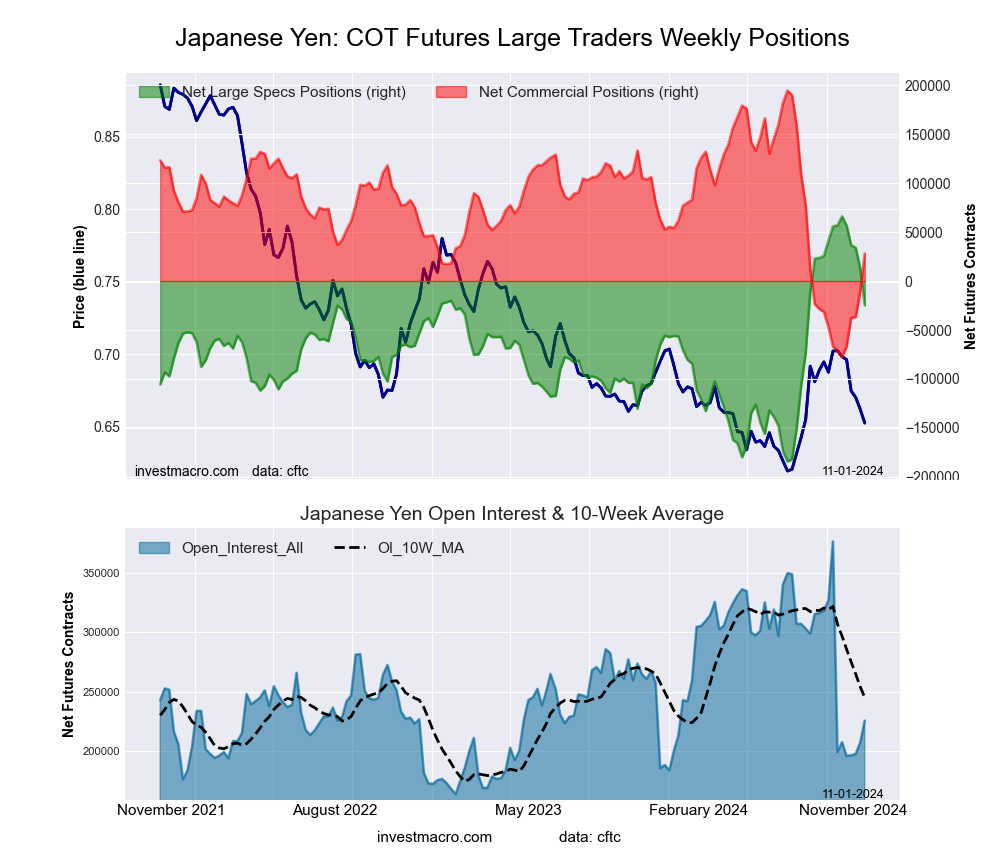 The Japanese Yen large speculator standing this week recorded a net position of -24,817 contracts in the data reported through Tuesday. This was a weekly lowering of -37,588 contracts from the previous week which had a total of 12,771 net contracts.
This week’s current strength score (the trader positioning range over the past three years, measured from 0 to 100) shows the speculators are currently Bullish with a score of 63.7 percent. The commercials are Bearish with a score of 38.8 percent and the small traders (not shown in chart) are Bullish with a score of 55.8 percent.
Price Trend-Following Model: Weak Uptrend
Our weekly trend-following model classifies the current market price position as: Weak Uptrend.
| JAPANESE YEN Statistics | SPECULATORS | COMMERCIALS | SMALL TRADERS |
| – Percent of Open Interest Longs: | 28.7 | 53.6 | 16.1 |
| – Percent of Open Interest Shorts: | 39.7 | 41.2 | 17.5 |
| – Net Position: | -24,817 | 28,082 | -3,265 |
| – Gross Longs: | 64,925 | 121,136 | 36,292 |
| – Gross Shorts: | 89,742 | 93,054 | 39,557 |
| – Long to Short Ratio: | 0.7 to 1 | 1.3 to 1 | 0.9 to 1 |
| NET POSITION TREND: | | | |
| – Strength Index Score (3 Year Range Pct): | 63.7 | 38.8 | 55.8 |
| – Strength Index Reading (3 Year Range): | Bullish | Bearish | Bullish |
| NET POSITION MOVEMENT INDEX: | | | |
| – 6-Week Change in Strength Index: | -32.6 | 36.7 | -44.2 |
Swiss Franc Futures:
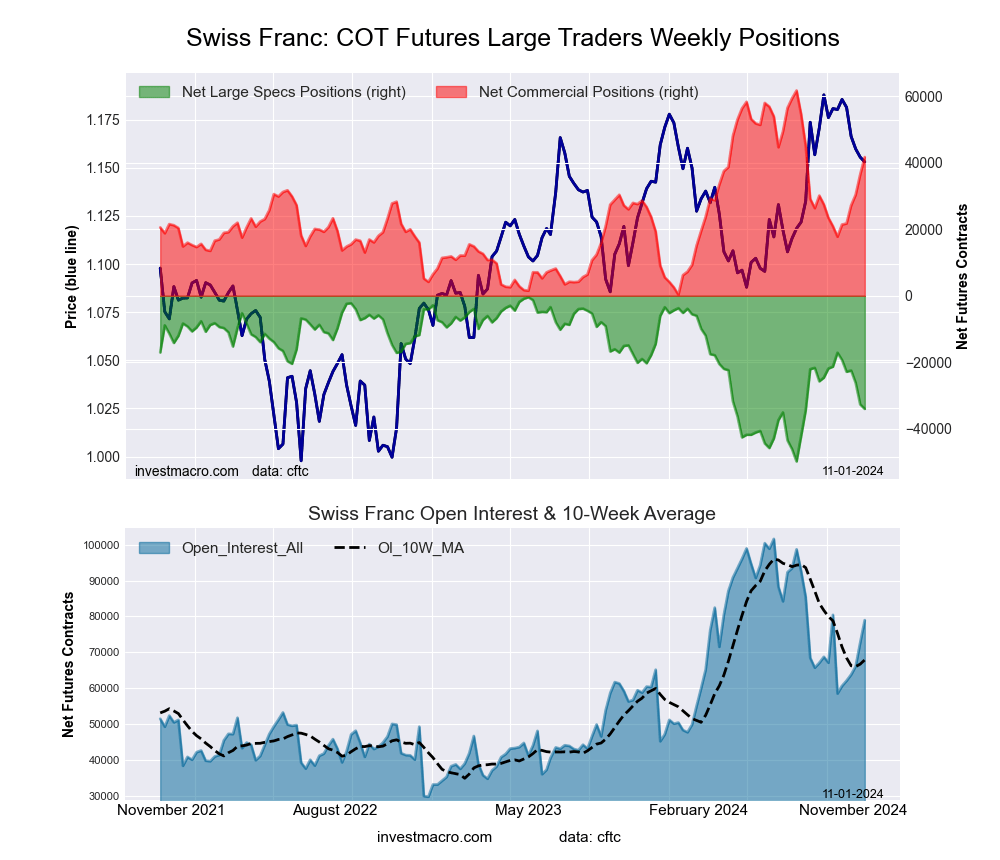 The Swiss Franc large speculator standing this week recorded a net position of -33,998 contracts in the data reported through Tuesday. This was a weekly reduction of -1,344 contracts from the previous week which had a total of -32,654 net contracts.
This week’s current strength score (the trader positioning range over the past three years, measured from 0 to 100) shows the speculators are currently Bearish with a score of 32.0 percent. The commercials are Bullish with a score of 67.4 percent and the small traders (not shown in chart) are Bearish with a score of 41.7 percent.
Price Trend-Following Model: Weak Uptrend
Our weekly trend-following model classifies the current market price position as: Weak Uptrend.
| SWISS FRANC Statistics | SPECULATORS | COMMERCIALS | SMALL TRADERS |
| – Percent of Open Interest Longs: | 9.0 | 77.2 | 13.7 |
| – Percent of Open Interest Shorts: | 52.0 | 24.4 | 23.5 |
| – Net Position: | -33,998 | 41,676 | -7,678 |
| – Gross Longs: | 7,092 | 60,942 | 10,855 |
| – Gross Shorts: | 41,090 | 19,266 | 18,533 |
| – Long to Short Ratio: | 0.2 to 1 | 3.2 to 1 | 0.6 to 1 |
| NET POSITION TREND: | | | |
| – Strength Index Score (3 Year Range Pct): | 32.0 | 67.4 | 41.7 |
| – Strength Index Reading (3 Year Range): | Bearish | Bullish | Bearish |
| NET POSITION MOVEMENT INDEX: | | | |
| – 6-Week Change in Strength Index: | -34.2 | 39.0 | -32.4 |
Canadian Dollar Futures:
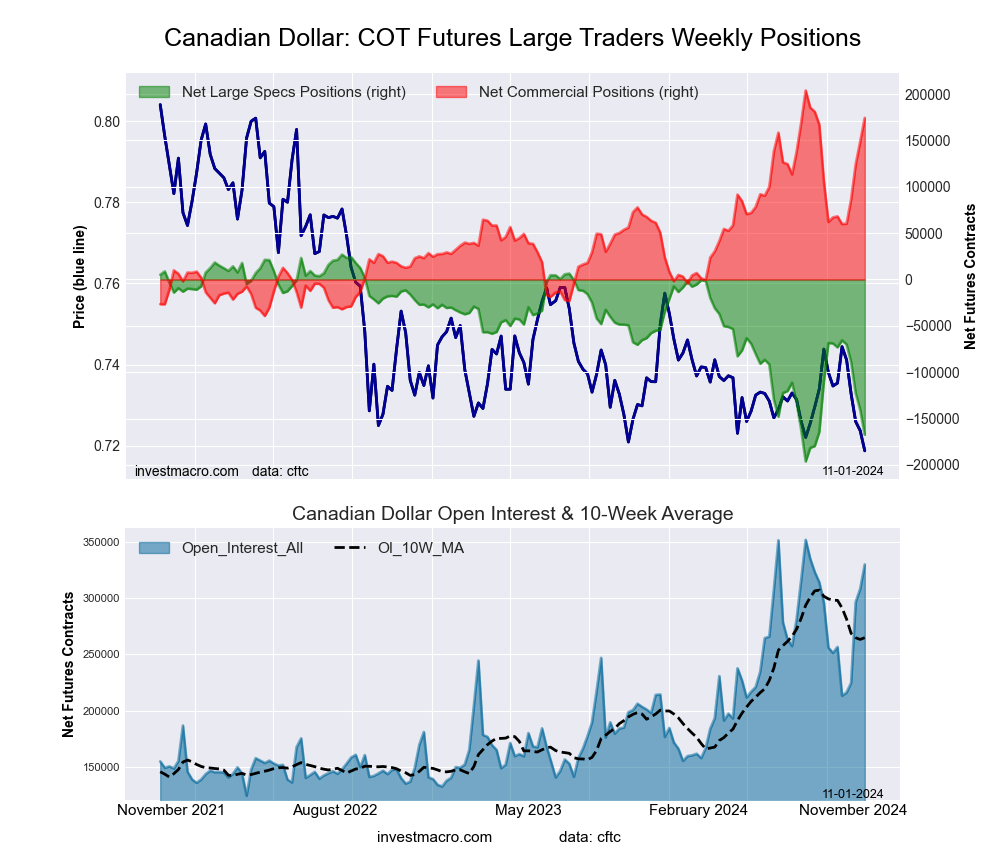 The Canadian Dollar large speculator standing this week recorded a net position of -167,499 contracts in the data reported through Tuesday. This was a weekly reduction of -26,868 contracts from the previous week which had a total of -140,631 net contracts.
This week’s current strength score (the trader positioning range over the past three years, measured from 0 to 100) shows the speculators are currently Bearish-Extreme with a score of 12.9 percent. The commercials are Bullish-Extreme with a score of 87.9 percent and the small traders (not shown in chart) are Bearish-Extreme with a score of 10.8 percent.
Price Trend-Following Model: Strong Downtrend
Our weekly trend-following model classifies the current market price position as: Strong Downtrend.
| CANADIAN DOLLAR Statistics | SPECULATORS | COMMERCIALS | SMALL TRADERS |
| – Percent of Open Interest Longs: | 8.3 | 80.7 | 8.5 |
| – Percent of Open Interest Shorts: | 59.1 | 27.9 | 10.6 |
| – Net Position: | -167,499 | 174,266 | -6,767 |
| – Gross Longs: | 27,399 | 266,311 | 28,068 |
| – Gross Shorts: | 194,898 | 92,045 | 34,835 |
| – Long to Short Ratio: | 0.1 to 1 | 2.9 to 1 | 0.8 to 1 |
| NET POSITION TREND: | | | |
| – Strength Index Score (3 Year Range Pct): | 12.9 | 87.9 | 10.8 |
| – Strength Index Reading (3 Year Range): | Bearish-Extreme | Bullish-Extreme | Bearish-Extreme |
| NET POSITION MOVEMENT INDEX: | | | |
| – 6-Week Change in Strength Index: | -42.3 | 43.7 | -34.9 |
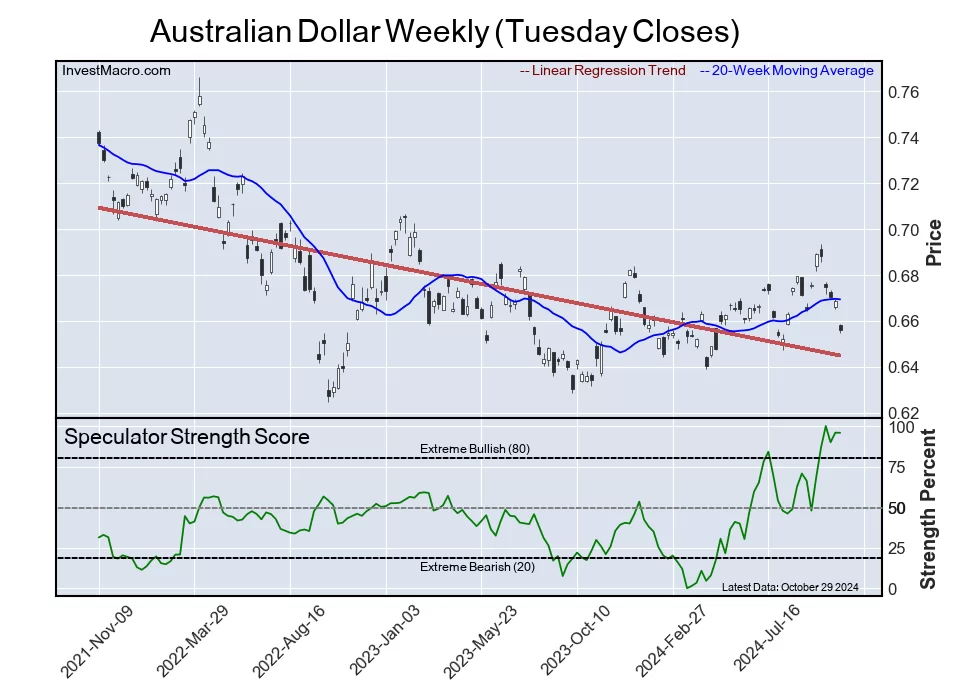
Australian Dollar Futures:
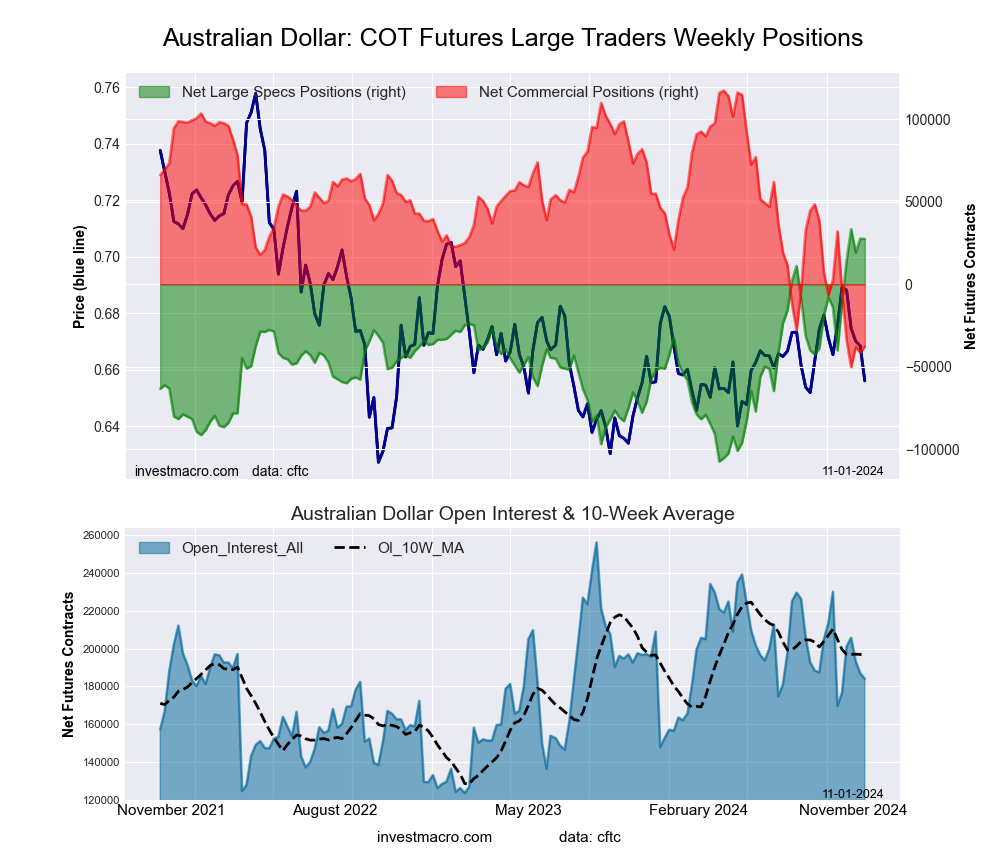 The Australian Dollar large speculator standing this week recorded a net position of 27,516 contracts in the data reported through Tuesday. This was a weekly lowering of -163 contracts from the previous week which had a total of 27,679 net contracts.
This week’s current strength score (the trader positioning range over the past three years, measured from 0 to 100) shows the speculators are currently Bullish-Extreme with a score of 95.8 percent. The commercials are Bearish-Extreme with a score of 7.4 percent and the small traders (not shown in chart) are Bullish with a score of 76.9 percent.
Price Trend-Following Model: Downtrend
Our weekly trend-following model classifies the current market price position as: Downtrend.
| AUSTRALIAN DOLLAR Statistics | SPECULATORS | COMMERCIALS | SMALL TRADERS |
| – Percent of Open Interest Longs: | 50.9 | 31.4 | 16.7 |
| – Percent of Open Interest Shorts: | 36.0 | 52.0 | 11.0 |
| – Net Position: | 27,516 | -37,858 | 10,342 |
| – Gross Longs: | 93,677 | 57,807 | 30,644 |
| – Gross Shorts: | 66,161 | 95,665 | 20,302 |
| – Long to Short Ratio: | 1.4 to 1 | 0.6 to 1 | 1.5 to 1 |
| NET POSITION TREND: | | | |
| – Strength Index Score (3 Year Range Pct): | 95.8 | 7.4 | 76.9 |
| – Strength Index Reading (3 Year Range): | Bullish-Extreme | Bearish-Extreme | Bullish |
| NET POSITION MOVEMENT INDEX: | | | |
| – 6-Week Change in Strength Index: | 48.0 | -41.6 | 5.7 |
New Zealand Dollar Futures:
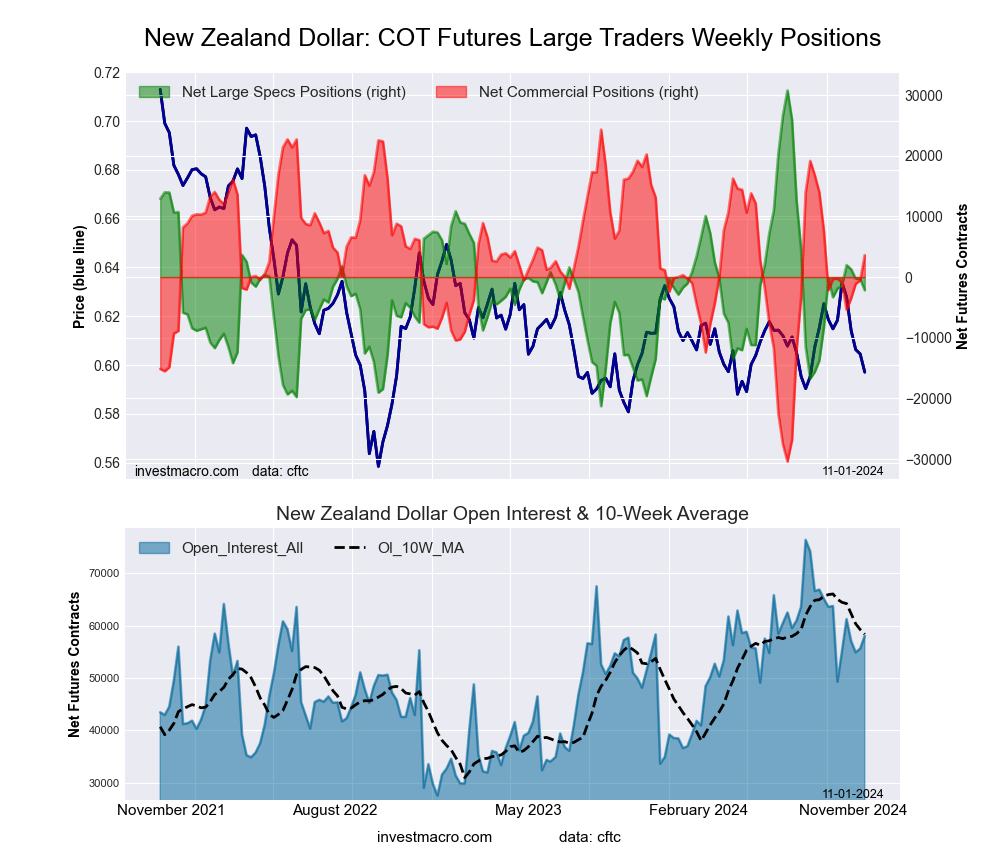 The New Zealand Dollar large speculator standing this week recorded a net position of -2,167 contracts in the data reported through Tuesday. This was a weekly decline of -1,844 contracts from the previous week which had a total of -323 net contracts.
This week’s current strength score (the trader positioning range over the past three years, measured from 0 to 100) shows the speculators are currently Bearish with a score of 36.7 percent. The commercials are Bullish with a score of 62.2 percent and the small traders (not shown in chart) are Bearish with a score of 35.1 percent.
Price Trend-Following Model: Downtrend
Our weekly trend-following model classifies the current market price position as: Downtrend.
| NEW ZEALAND DOLLAR Statistics | SPECULATORS | COMMERCIALS | SMALL TRADERS |
| – Percent of Open Interest Longs: | 44.9 | 48.0 | 6.3 |
| – Percent of Open Interest Shorts: | 48.7 | 41.8 | 8.8 |
| – Net Position: | -2,167 | 3,607 | -1,440 |
| – Gross Longs: | 26,077 | 27,850 | 3,672 |
| – Gross Shorts: | 28,244 | 24,243 | 5,112 |
| – Long to Short Ratio: | 0.9 to 1 | 1.1 to 1 | 0.7 to 1 |
| NET POSITION TREND: | | | |
| – Strength Index Score (3 Year Range Pct): | 36.7 | 62.2 | 35.1 |
| – Strength Index Reading (3 Year Range): | Bearish | Bullish | Bearish |
| NET POSITION MOVEMENT INDEX: | | | |
| – 6-Week Change in Strength Index: | -0.5 | 7.1 | -45.7 |
Mexican Peso Futures:
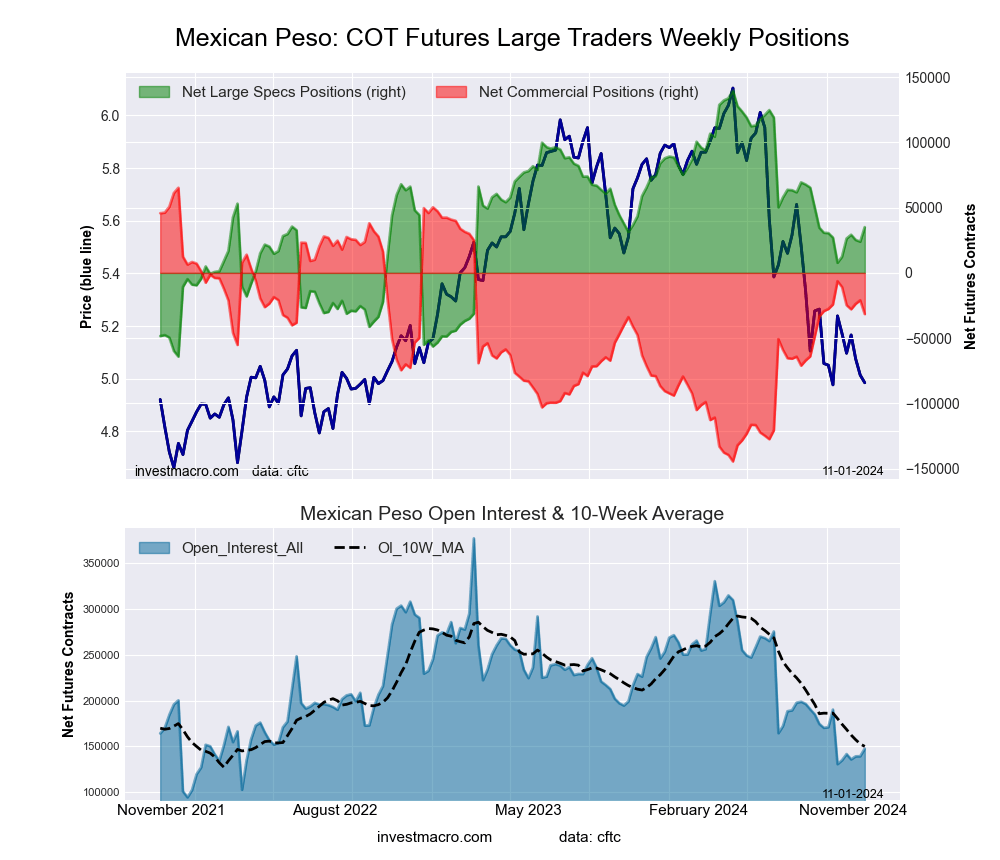 The Mexican Peso large speculator standing this week recorded a net position of 35,045 contracts in the data reported through Tuesday. This was a weekly boost of 11,148 contracts from the previous week which had a total of 23,897 net contracts.
This week’s current strength score (the trader positioning range over the past three years, measured from 0 to 100) shows the speculators are currently Bearish with a score of 48.7 percent. The commercials are Bullish with a score of 53.8 percent and the small traders (not shown in chart) are Bearish-Extreme with a score of 0.0 percent.
Price Trend-Following Model: Strong Downtrend
Our weekly trend-following model classifies the current market price position as: Strong Downtrend.
| MEXICAN PESO Statistics | SPECULATORS | COMMERCIALS | SMALL TRADERS |
| – Percent of Open Interest Longs: | 48.2 | 46.3 | 2.4 |
| – Percent of Open Interest Shorts: | 24.5 | 67.7 | 4.7 |
| – Net Position: | 35,045 | -31,575 | -3,470 |
| – Gross Longs: | 71,127 | 68,246 | 3,511 |
| – Gross Shorts: | 36,082 | 99,821 | 6,981 |
| – Long to Short Ratio: | 2.0 to 1 | 0.7 to 1 | 0.5 to 1 |
| NET POSITION TREND: | | | |
| – Strength Index Score (3 Year Range Pct): | 48.7 | 53.8 | 0.0 |
| – Strength Index Reading (3 Year Range): | Bearish | Bullish | Bearish-Extreme |
| NET POSITION MOVEMENT INDEX: | | | |
| – 6-Week Change in Strength Index: | 13.4 | -12.0 | -12.1 |
Brazilian Real Futures:
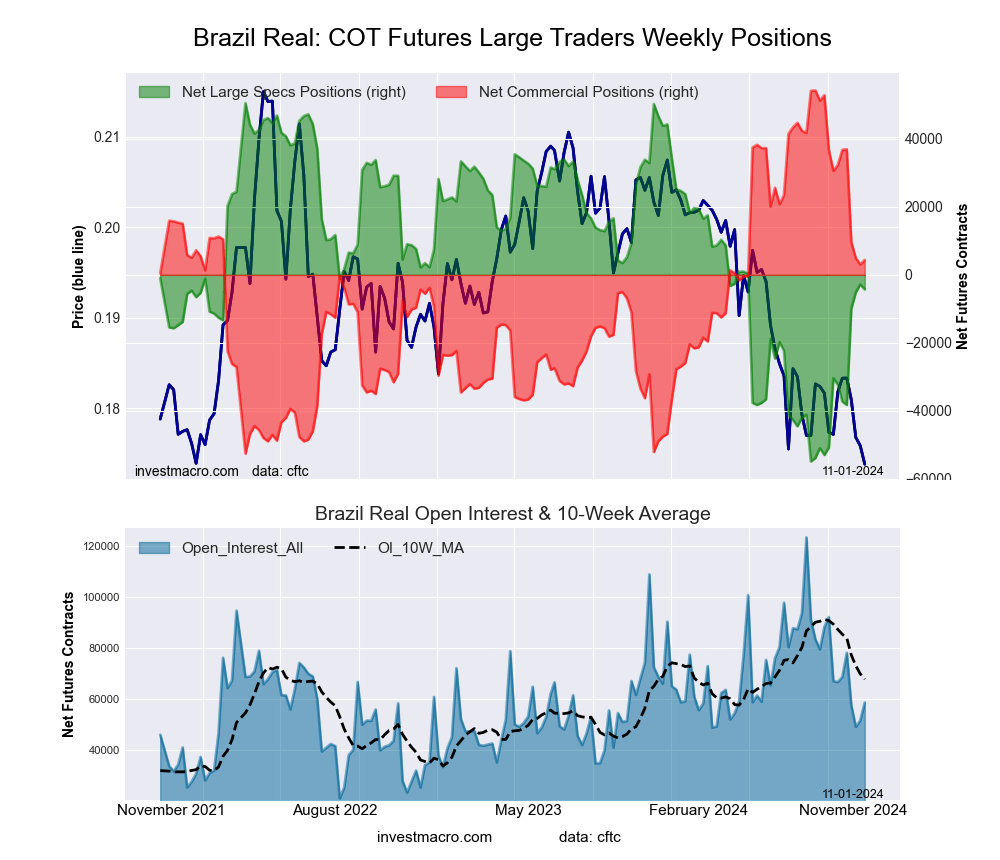 The Brazilian Real large speculator standing this week recorded a net position of -4,269 contracts in the data reported through Tuesday. This was a weekly fall of -1,464 contracts from the previous week which had a total of -2,805 net contracts.
This week’s current strength score (the trader positioning range over the past three years, measured from 0 to 100) shows the speculators are currently Bearish with a score of 48.0 percent. The commercials are Bullish with a score of 53.3 percent and the small traders (not shown in chart) are Bearish with a score of 20.2 percent.
Price Trend-Following Model: Strong Downtrend
Our weekly trend-following model classifies the current market price position as: Strong Downtrend.
| BRAZIL REAL Statistics | SPECULATORS | COMMERCIALS | SMALL TRADERS |
| – Percent of Open Interest Longs: | 42.2 | 48.3 | 5.5 |
| – Percent of Open Interest Shorts: | 49.5 | 40.8 | 5.7 |
| – Net Position: | -4,269 | 4,392 | -123 |
| – Gross Longs: | 24,784 | 28,361 | 3,205 |
| – Gross Shorts: | 29,053 | 23,969 | 3,328 |
| – Long to Short Ratio: | 0.9 to 1 | 1.2 to 1 | 1.0 to 1 |
| NET POSITION TREND: | | | |
| – Strength Index Score (3 Year Range Pct): | 48.0 | 53.3 | 20.2 |
| – Strength Index Reading (3 Year Range): | Bearish | Bullish | Bearish |
| NET POSITION MOVEMENT INDEX: | | | |
| – 6-Week Change in Strength Index: | 26.6 | -26.2 | -0.6 |
Bitcoin Futures:
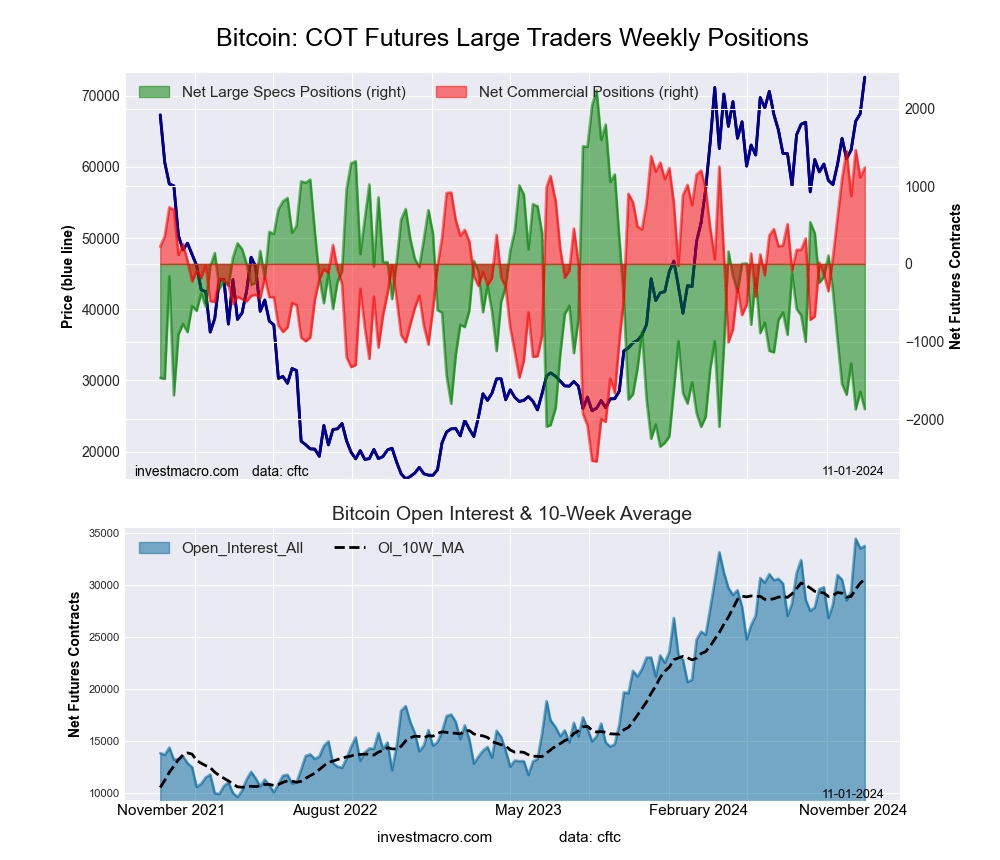 The Bitcoin large speculator standing this week recorded a net position of -1,869 contracts in the data reported through Tuesday. This was a weekly fall of -224 contracts from the previous week which had a total of -1,645 net contracts.
This week’s current strength score (the trader positioning range over the past three years, measured from 0 to 100) shows the speculators are currently Bearish-Extreme with a score of 10.5 percent. The commercials are Bullish-Extreme with a score of 94.4 percent and the small traders (not shown in chart) are Bullish with a score of 66.0 percent.
Price Trend-Following Model: Strong Uptrend
Our weekly trend-following model classifies the current market price position as: Strong Uptrend.
| BITCOIN Statistics | SPECULATORS | COMMERCIALS | SMALL TRADERS |
| – Percent of Open Interest Longs: | 83.3 | 6.0 | 4.3 |
| – Percent of Open Interest Shorts: | 88.9 | 2.3 | 2.4 |
| – Net Position: | -1,869 | 1,242 | 627 |
| – Gross Longs: | 28,156 | 2,019 | 1,441 |
| – Gross Shorts: | 30,025 | 777 | 814 |
| – Long to Short Ratio: | 0.9 to 1 | 2.6 to 1 | 1.8 to 1 |
| NET POSITION TREND: | | | |
| – Strength Index Score (3 Year Range Pct): | 10.5 | 94.4 | 66.0 |
| – Strength Index Reading (3 Year Range): | Bearish-Extreme | Bullish-Extreme | Bullish |
| NET POSITION MOVEMENT INDEX: | | | |
| – 6-Week Change in Strength Index: | -19.6 | 16.1 | 13.8 |
Article By InvestMacro – Receive our weekly COT Newsletter
*COT Report: The COT data, released weekly to the public each Friday, is updated through the most recent Tuesday (data is 3 days old) and shows a quick view of how large speculators or non-commercials (for-profit traders) were positioned in the futures markets.
The CFTC categorizes trader positions according to commercial hedgers (traders who use futures contracts for hedging as part of the business), non-commercials (large traders who speculate to realize trading profits) and nonreportable traders (usually small traders/speculators) as well as their open interest (contracts open in the market at time of reporting). See CFTC criteria here.