
By InvestMacro

Here are the latest charts and statistics for the Commitment of Traders (COT) reports data published by the Commodities Futures Trading Commission (CFTC).
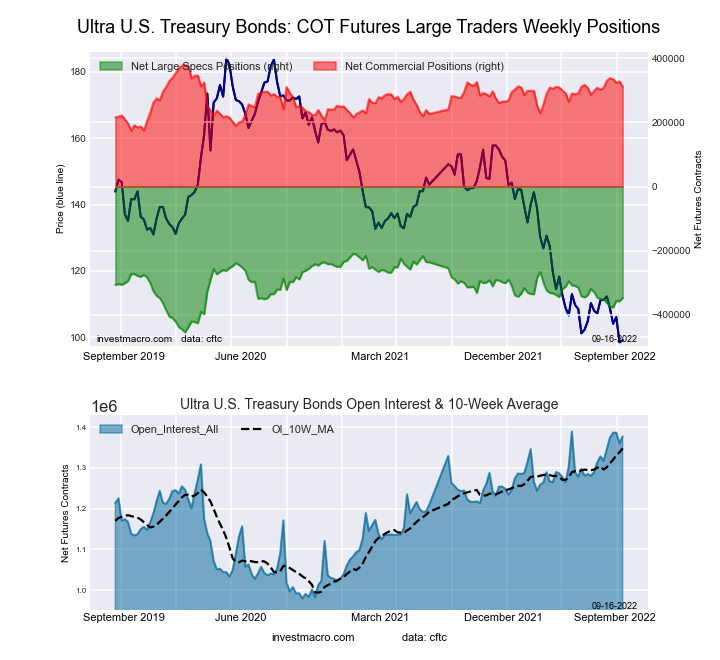
The latest COT data is updated through Tuesday September 20th and shows a quick view of how large traders (for-profit speculators and commercial entities) were positioned in the futures markets.
Soybean Meal leads positive Weekly Speculator Changes while Sugar see weekly drop
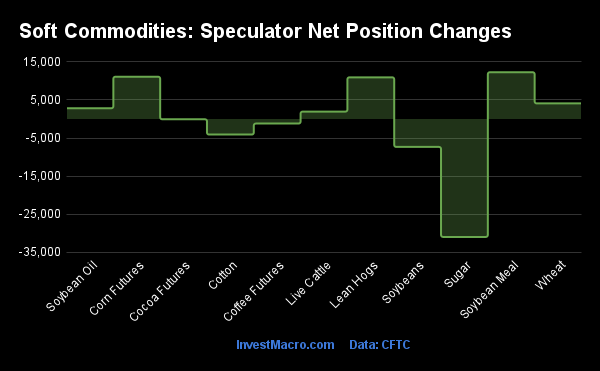
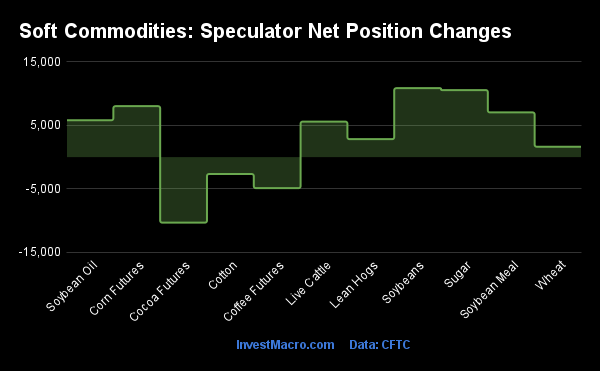
The COT soft commodities speculator bets were slightly higher this week as six out of the eleven soft commodities markets we cover had higher positioning this week while the other five markets had decreases in contracts.
Leading the gains for soft commodities markets was Soybean Meal (12,293 contracts) with Corn (11,108 contracts), Lean Hogs (10,953 contracts), Wheat (4,099 contracts), Soybean Oil (2,830 contracts) and Live Cattle (1,947 contracts) also showing positive weeks.
The softs markets leading the declines in speculator bets this week was Sugar (-30,985 contracts) with Soybeans (-7,337 contracts), Cotton (-4,086 contracts), Coffee (-1,195 contracts) and Cocoa (-67 contracts) also registering lower bets on the week.
Highlighting the COT Soft Commodities data is the gains in Soybean Meal speculator bets. Speculative net positions rose for a second straight week and for the ninth time out of the past twelve weeks. This recent bullishness has pushed Soybean Meal net positions to the highest level of the past 26 weeks, dating back to March 22nd of this year. The speculator positioning for this market currently represents the highest strength score among all the futures markets (50+ markets) we cover with a 97.9 percent score and an extreme bullish reading.
| Sep-20-2022 | OI | OI-Index | Spec-Net | Spec-Index | Com-Net | COM-Index | Smalls-Net | Smalls-Index |
|---|---|---|---|---|---|---|---|---|
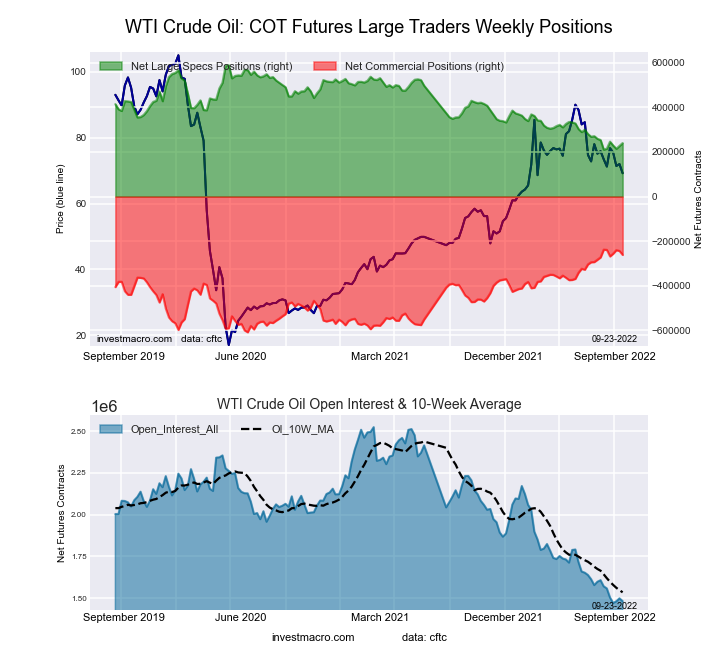
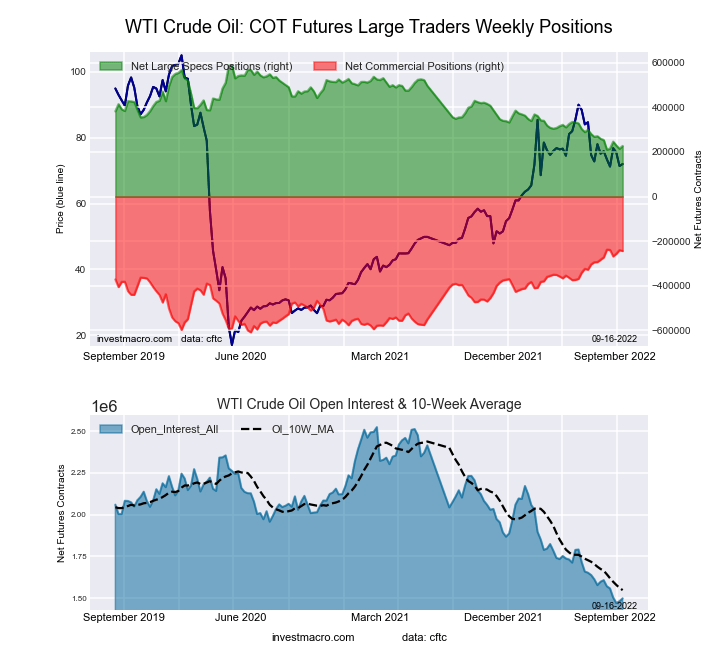
| WTI Crude | 1,481,545 | 1 | 239,878 | 8 | -261,568 | 94 | 21,690 | 36 |
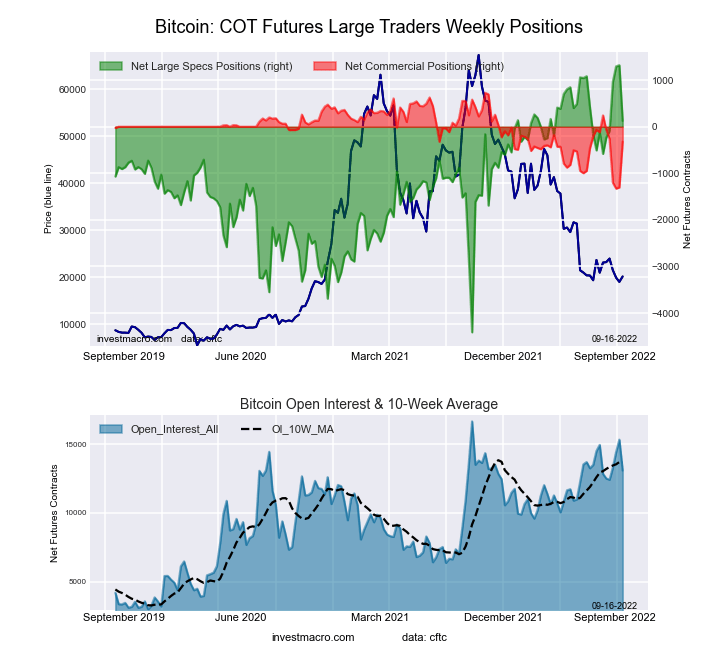
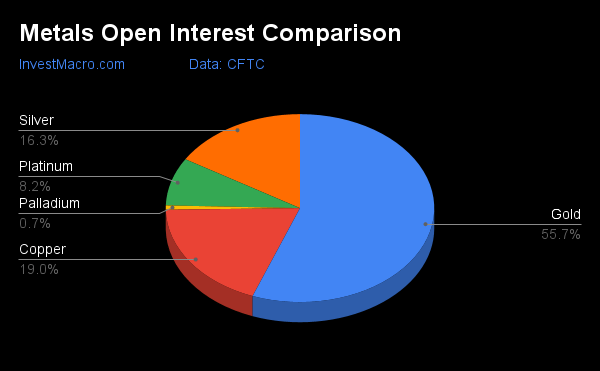
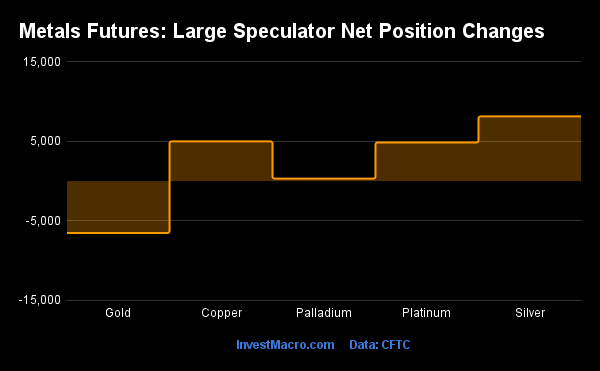
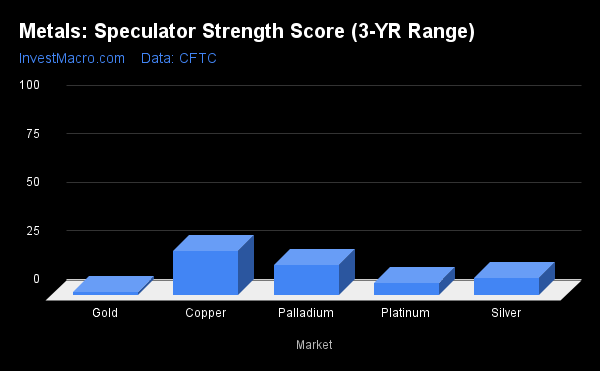
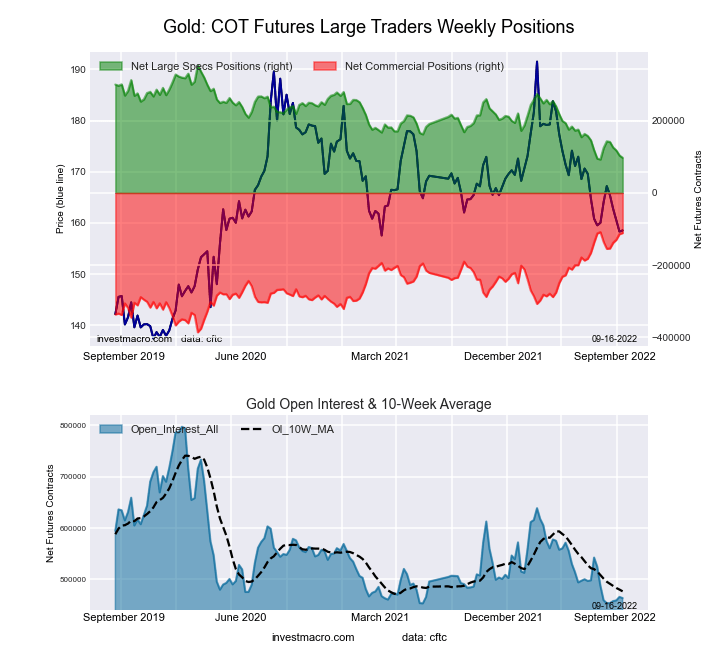
| Gold | 469,395 | 5 | 65,722 | 0 | -75,428 | 100 | 9,706 | 0 |
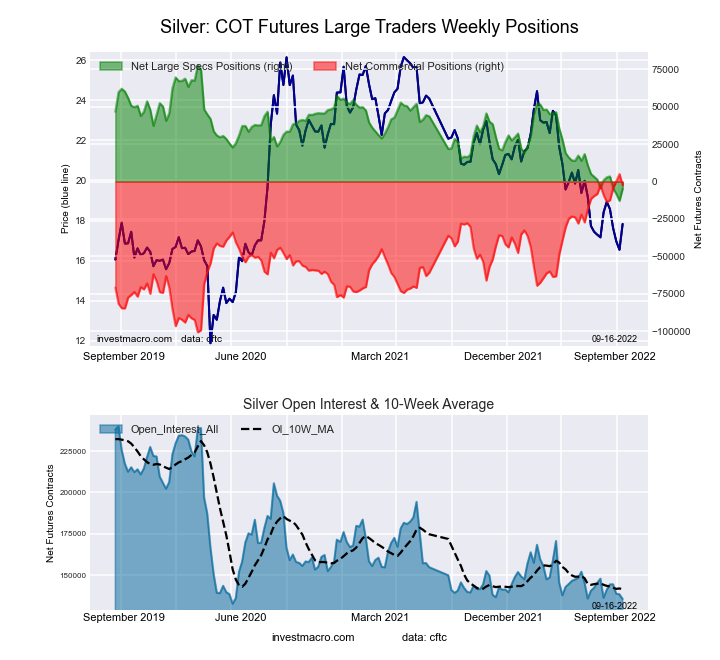
| Silver | 132,107 | 0 | -1,640 | 12 | -5,629 | 90 | 7,269 | 4 |
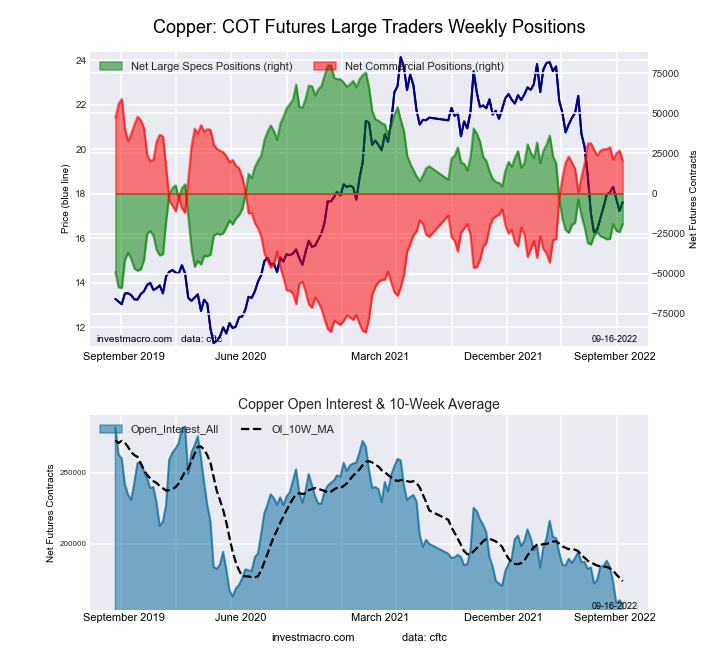
| Copper | 163,058 | 4 | -20,286 | 22 | 23,215 | 82 | -2,929 | 8 |
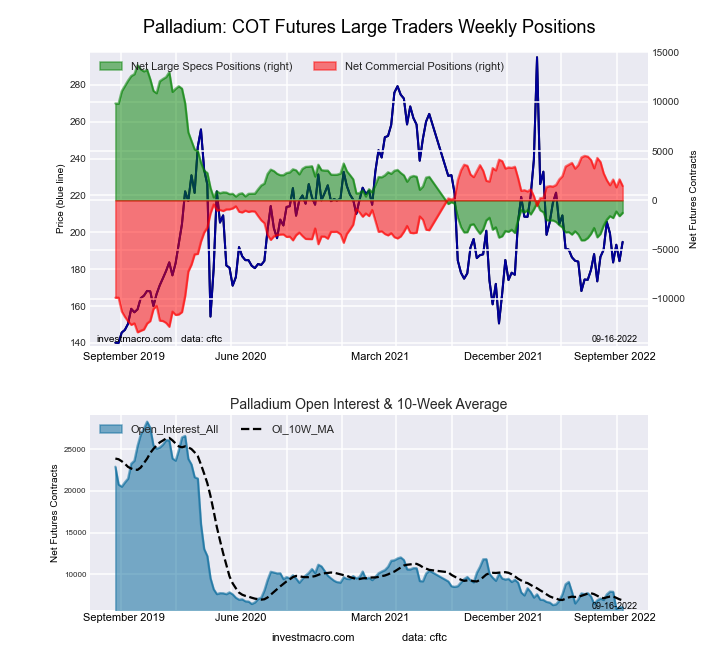
| Palladium | 5,993 | 1 | -1,081 | 17 | 1,261 | 82 | -180 | 33 |
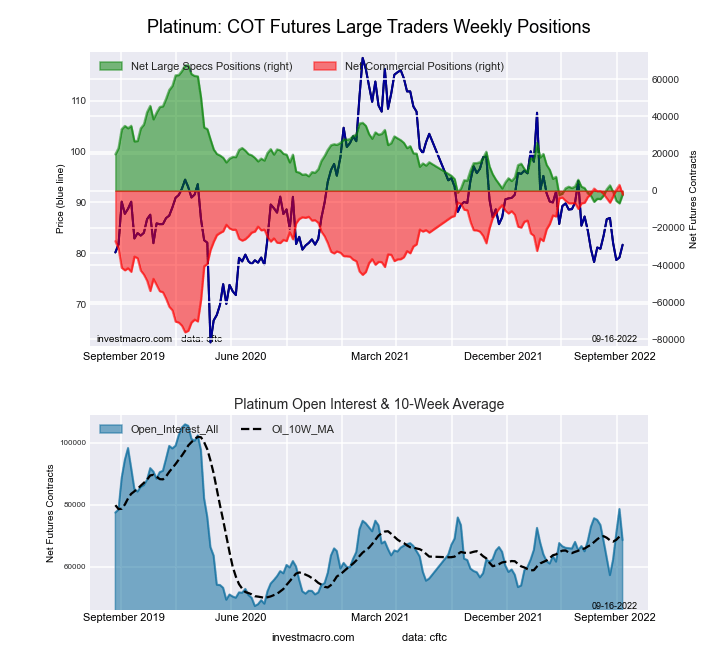
| Platinum | 62,900 | 27 | 2,390 | 12 | -5,496 | 89 | 3,106 | 5 |
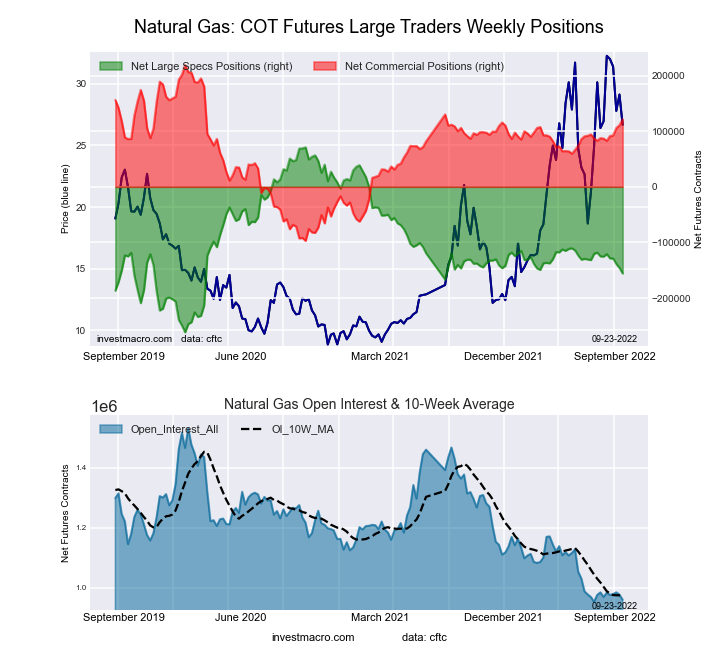
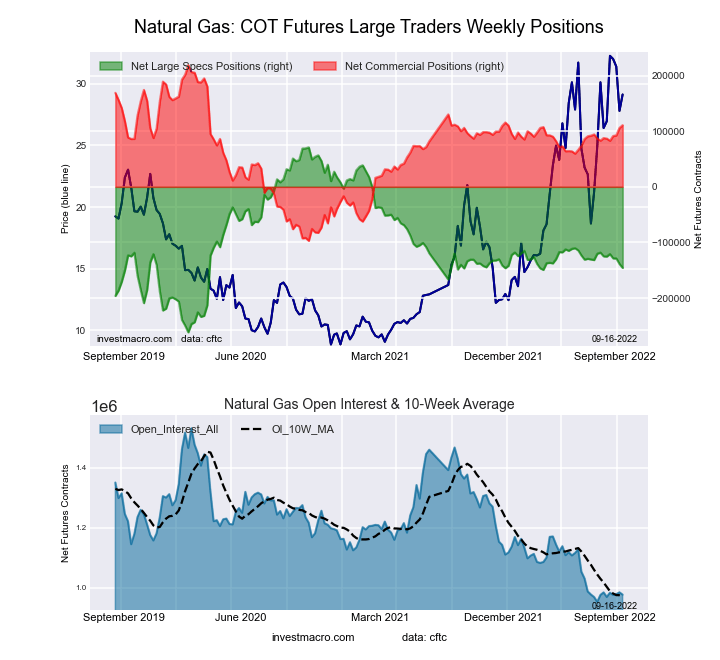
| Natural Gas | 960,236 | 1 | -155,711 | 32 | 121,308 | 69 | 34,403 | 62 |
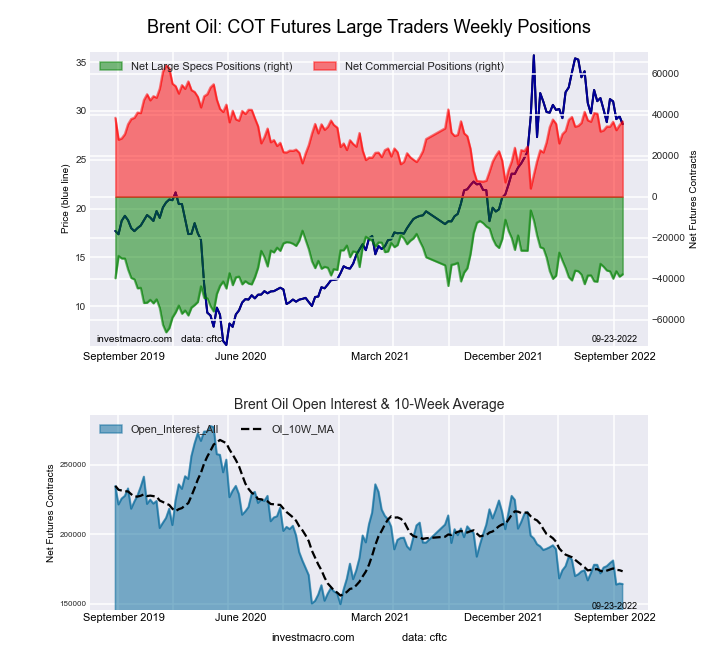
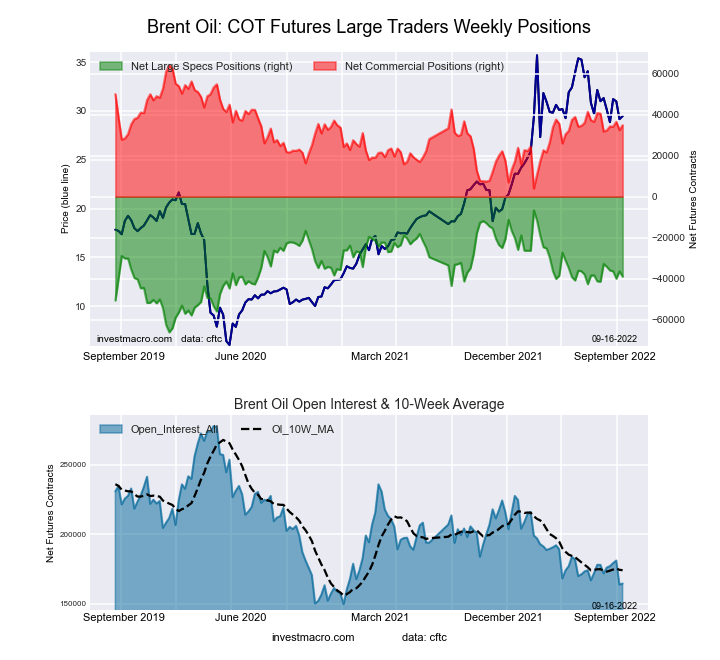
| Brent | 164,025 | 11 | -37,903 | 48 | 36,732 | 54 | 1,171 | 25 |
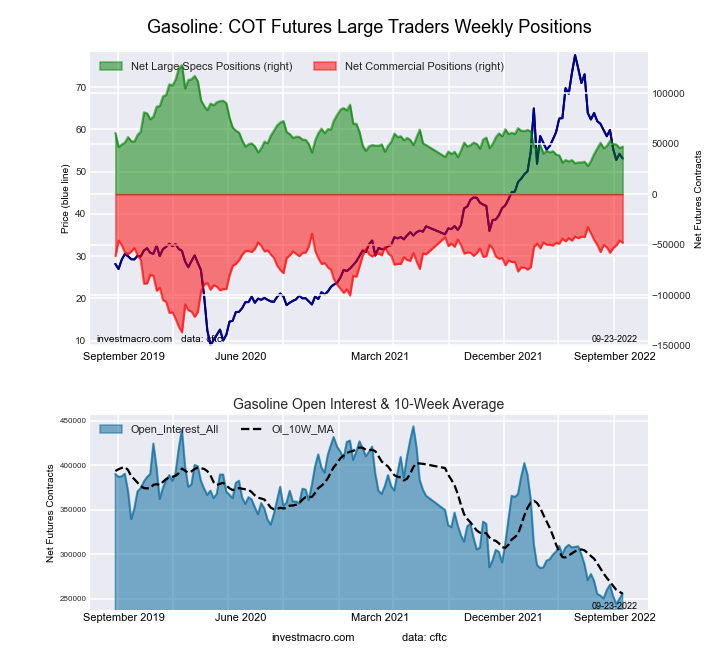
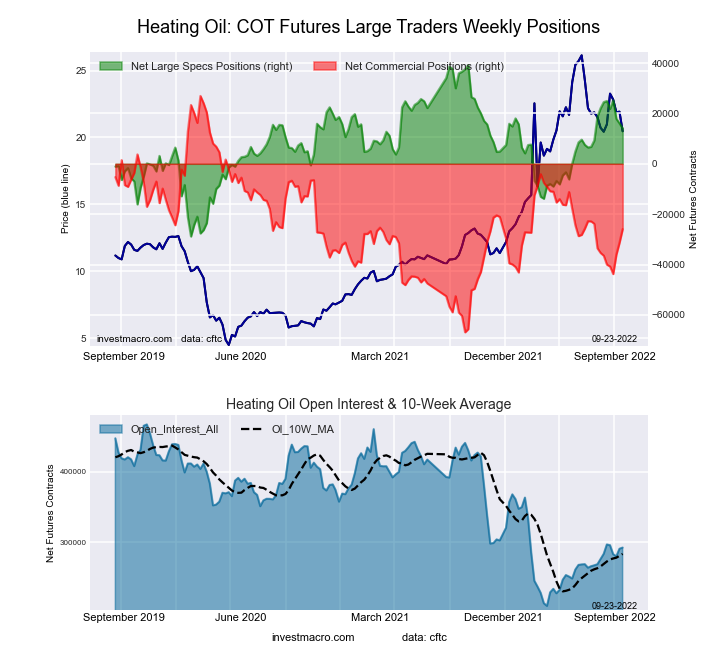
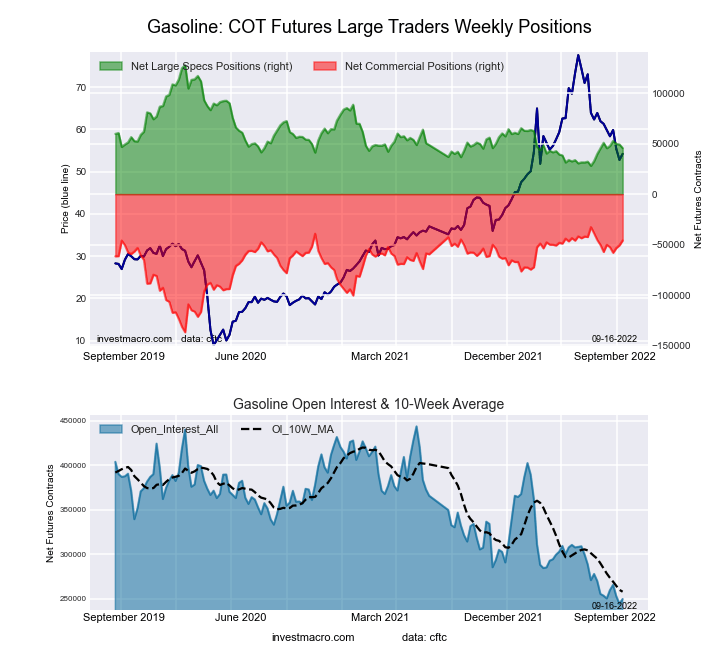
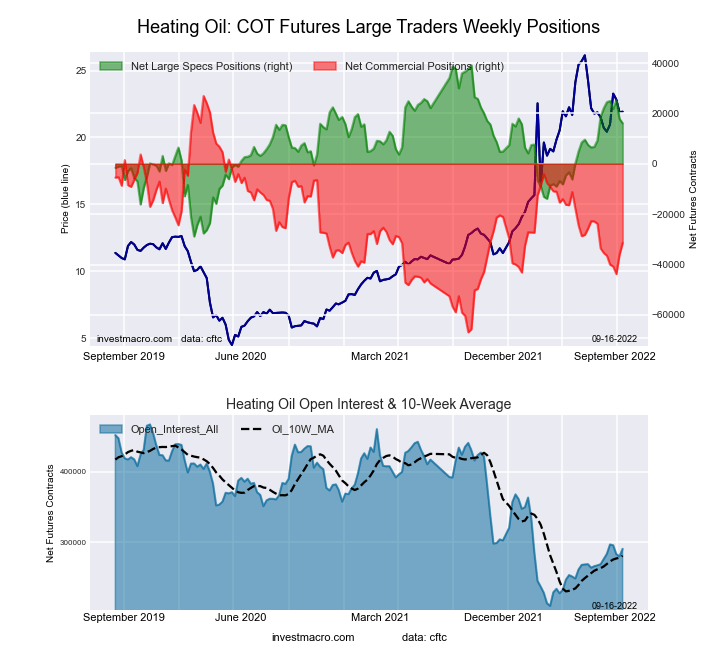
| Heating Oil | 292,634 | 32 | 14,097 | 63 | -25,941 | 44 | 11,844 | 39 |
| Soybeans | 656,310 | 18 | 84,773 | 39 | -55,485 | 70 | -29,288 | 22 |
| Corn | 1,330,841 | 9 | 305,677 | 69 | -241,238 | 38 | -64,439 | 6 |
| Coffee | 191,433 | 5 | 41,072 | 74 | -42,998 | 30 | 1,926 | 17 |
| Sugar | 744,972 | 8 | 37,345 | 44 | -35,860 | 61 | -1,485 | 6 |
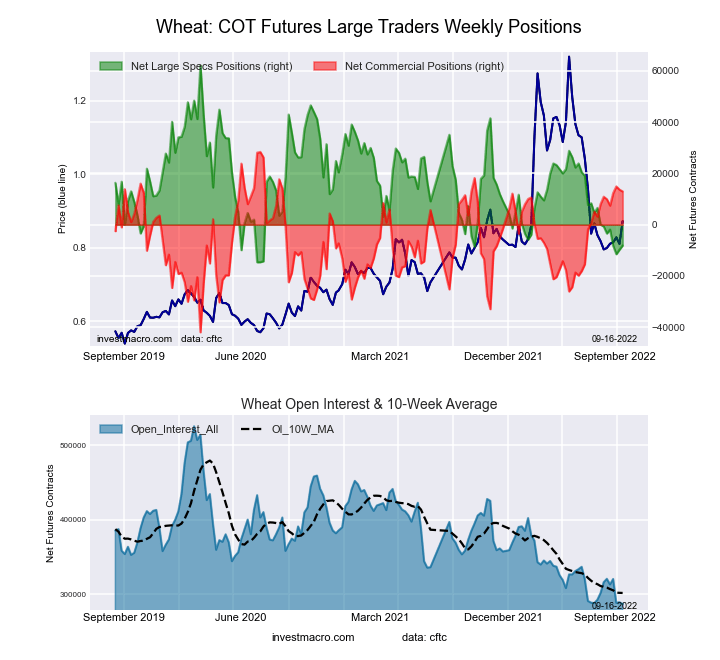
| Wheat | 285,567 | 0 | -4,029 | 14 | 9,982 | 74 | -5,953 | 80 |
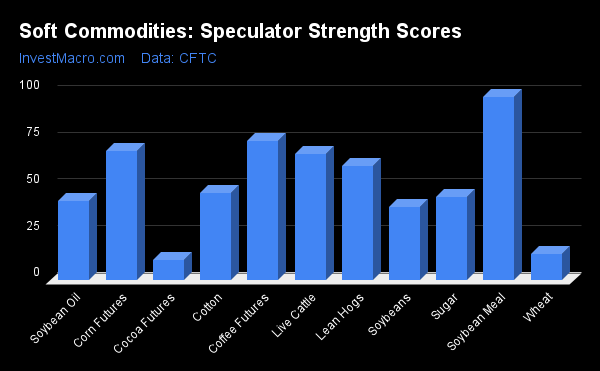
Strength Scores
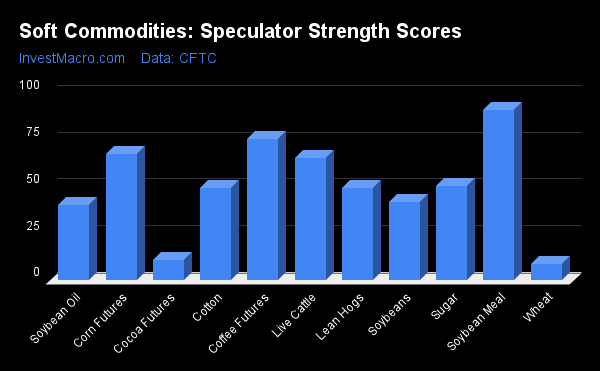
Strength Scores (a normalized measure of Speculator positions over a 3-Year range, from 0 to 100 where above 80 is extreme bullish and below 20 is extreme bearish) showed that Soybean Meal (97.9 percent) leads the soft commodity markets and is in a bullish extreme position (above 80 percent). Coffee (74.3 percent), Corn (69.1 percent) and Live Cattle (67.6 percent) come in as the next highest soft commodity markets in strength scores.
On the downside, Cocoa (11.0 percent) and Wheat (13.8 percent) come in at the lowest strength levels currently and are in bearish extreme positions (below 20 percent).
Strength Statistics:
Corn (69.1 percent) vs Corn previous week (67.7 percent)
Sugar (44.3 percent) vs Sugar previous week (50.7 percent)
Coffee (74.3 percent) vs Coffee previous week (75.4 percent)
Soybeans (39.4 percent) vs Soybeans previous week (41.7 percent)
Soybean Oil (42.4 percent) vs Soybean Oil previous week (40.4 percent)
Soybean Meal (97.9 percent) vs Soybean Meal previous week (91.0 percent)
Live Cattle (67.6 percent) vs Live Cattle previous week (65.2 percent)
Lean Hogs (61.3 percent) vs Lean Hogs previous week (49.4 percent)
Cotton (46.5 percent) vs Cotton previous week (49.3 percent)
Cocoa (11.0 percent) vs Cocoa previous week (11.0 percent)
Wheat (13.8 percent) vs Wheat previous week (8.5 percent)
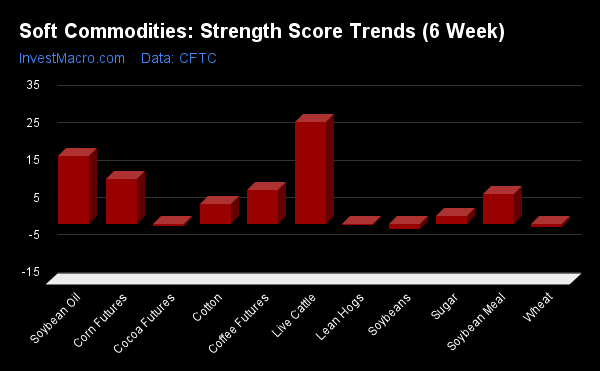
Strength Trends
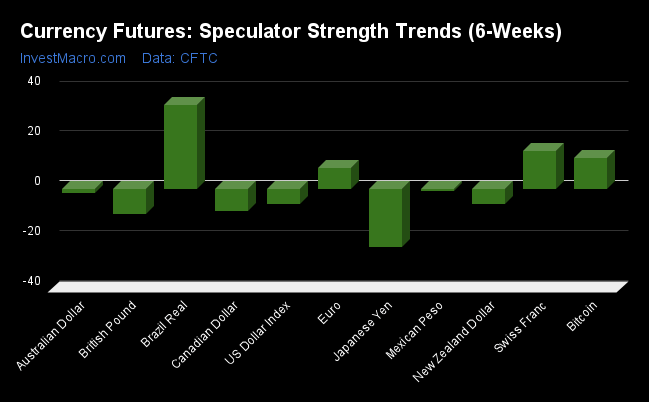
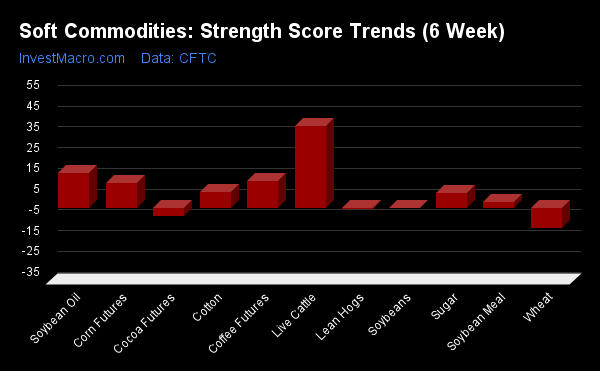
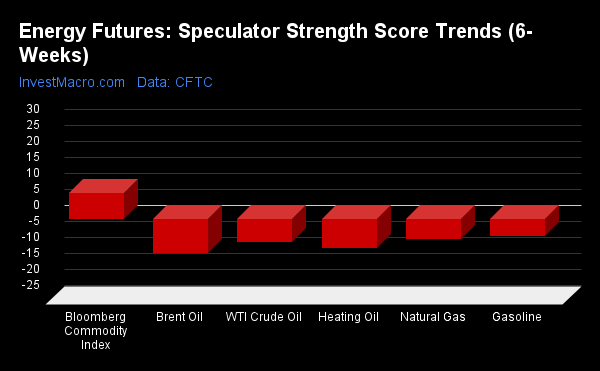
Strength Score Trends (or move index, calculates the 6-week changes in strength scores) show that Live Cattle (27.3 percent) and Soybean Oil (18.2 percent) sentiment have led the positive moves over the past six weeks. Corn (12.1 percent), Coffee (9.2 percent) and Soybean Meal (8.0 percent) fill out the next top movers in the latest trends data.
Soybeans (-1.3 percent) lead the downside trend scores currently with the next markets with lower trend scores being Wheat (-0.8 percent), Cocoa (-0.4 percent) and Lean Hogs (-0.1 percent).
Strength Trend Statistics:
Corn (12.1 percent) vs Corn previous week (11.9 percent)
Sugar (2.3 percent) vs Sugar previous week (7.0 percent)
Coffee (9.2 percent) vs Coffee previous week (13.0 percent)
Soybeans (-1.3 percent) vs Soybeans previous week (-0.1 percent)
Soybean Oil (18.2 percent) vs Soybean Oil previous week (16.6 percent)
Soybean Meal (8.0 percent) vs Soybean Meal previous week (2.5 percent)
Live Cattle (27.3 percent) vs Live Cattle previous week (39.5 percent)
Lean Hogs (-0.1 percent) vs Lean Hogs previous week (-0.6 percent)
Cotton (5.3 percent) vs Cotton previous week (7.5 percent)
Cocoa (-0.4 percent) vs Cocoa previous week (-3.9 percent)
Wheat (-0.8 percent) vs Wheat previous week (-9.6 percent)
Individual Markets:
CORN Futures:
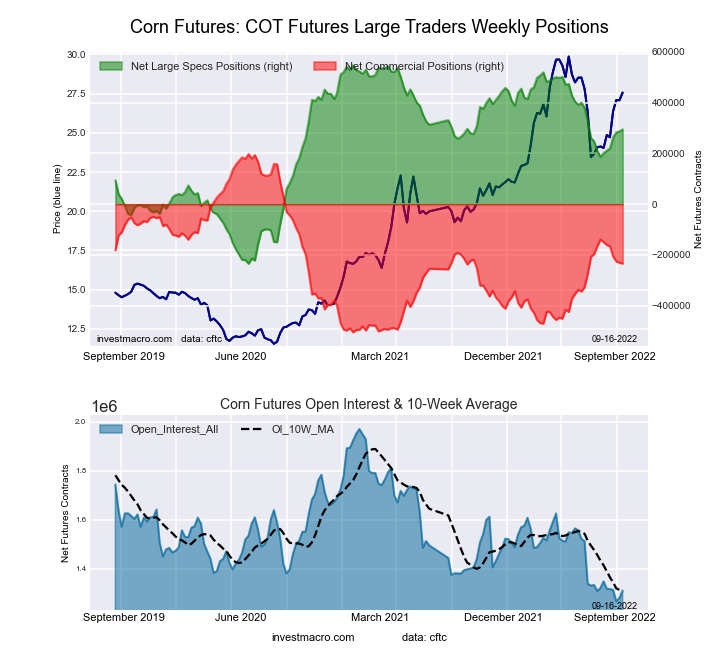
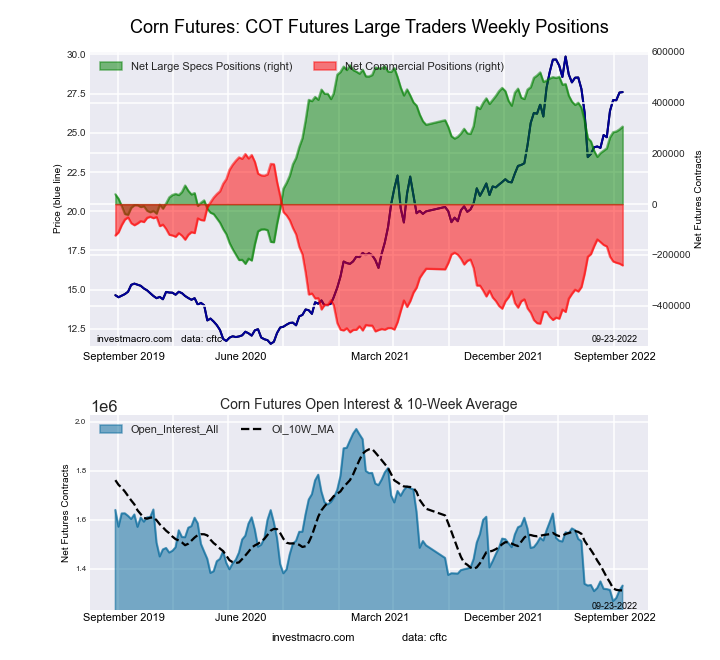 The CORN large speculator standing this week reached a net position of 305,677 contracts in the data reported through Tuesday. This was a weekly gain of 11,108 contracts from the previous week which had a total of 294,569 net contracts.
This week’s current strength score (the trader positioning range over the past three years, measured from 0 to 100) shows the speculators are currently Bullish with a score of 69.1 percent. The commercials are Bearish with a score of 37.5 percent and the small traders (not shown in chart) are Bearish-Extreme with a score of 6.0 percent.
| CORN Futures Statistics | SPECULATORS | COMMERCIALS | SMALL TRADERS |
| – Percent of Open Interest Longs: | 32.5 | 44.4 | 8.7 |
| – Percent of Open Interest Shorts: | 9.6 | 62.6 | 13.6 |
| – Net Position: | 305,677 | -241,238 | -64,439 |
| – Gross Longs: | 432,909 | 591,425 | 116,001 |
| – Gross Shorts: | 127,232 | 832,663 | 180,440 |
| – Long to Short Ratio: | 3.4 to 1 | 0.7 to 1 | 0.6 to 1 |
| NET POSITION TREND: | |||
| – Strength Index Score (3 Year Range Pct): | 69.1 | 37.5 | 6.0 |
| – Strength Index Reading (3 Year Range): | Bullish | Bearish | Bearish-Extreme |
| NET POSITION MOVEMENT INDEX: | |||
| – 6-Week Change in Strength Index: | 12.1 | -11.5 | -8.3 |
SUGAR Futures:
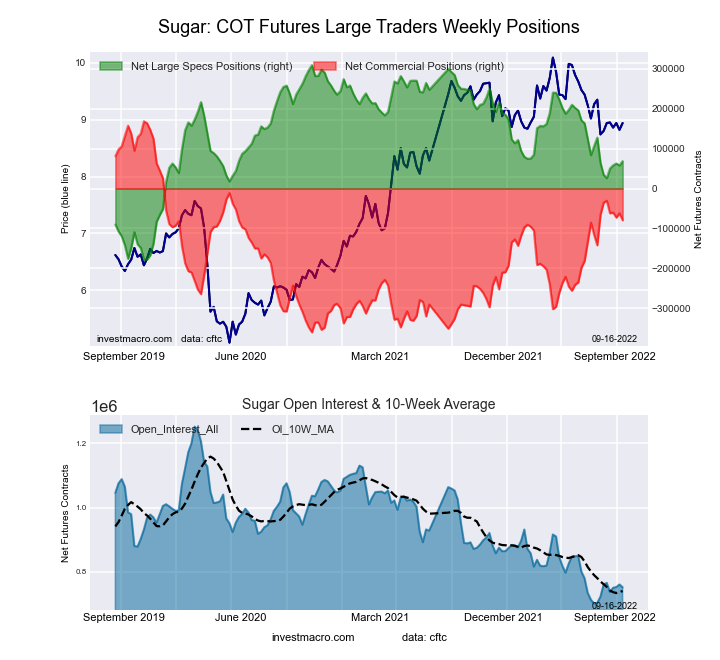
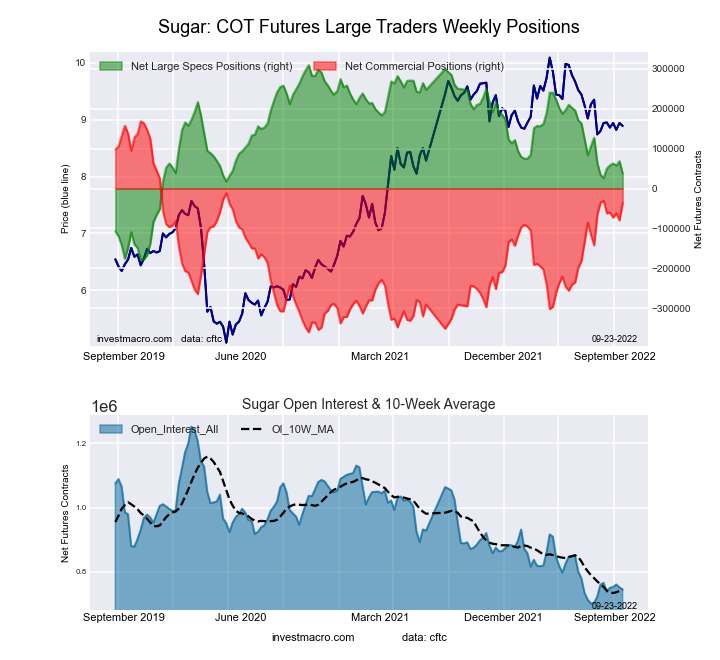 The SUGAR large speculator standing this week reached a net position of 37,345 contracts in the data reported through Tuesday. This was a weekly fall of -30,985 contracts from the previous week which had a total of 68,330 net contracts.
This week’s current strength score (the trader positioning range over the past three years, measured from 0 to 100) shows the speculators are currently Bearish with a score of 44.3 percent. The commercials are Bullish with a score of 61.3 percent and the small traders (not shown in chart) are Bearish-Extreme with a score of 6.0 percent.
| SUGAR Futures Statistics | SPECULATORS | COMMERCIALS | SMALL TRADERS |
| – Percent of Open Interest Longs: | 22.0 | 57.0 | 8.7 |
| – Percent of Open Interest Shorts: | 17.0 | 61.8 | 8.9 |
| – Net Position: | 37,345 | -35,860 | -1,485 |
| – Gross Longs: | 164,043 | 424,443 | 64,709 |
| – Gross Shorts: | 126,698 | 460,303 | 66,194 |
| – Long to Short Ratio: | 1.3 to 1 | 0.9 to 1 | 1.0 to 1 |
| NET POSITION TREND: | |||
| – Strength Index Score (3 Year Range Pct): | 44.3 | 61.3 | 6.0 |
| – Strength Index Reading (3 Year Range): | Bearish | Bullish | Bearish-Extreme |
| NET POSITION MOVEMENT INDEX: | |||
| – 6-Week Change in Strength Index: | 2.3 | -1.0 | -7.5 |
COFFEE Futures:
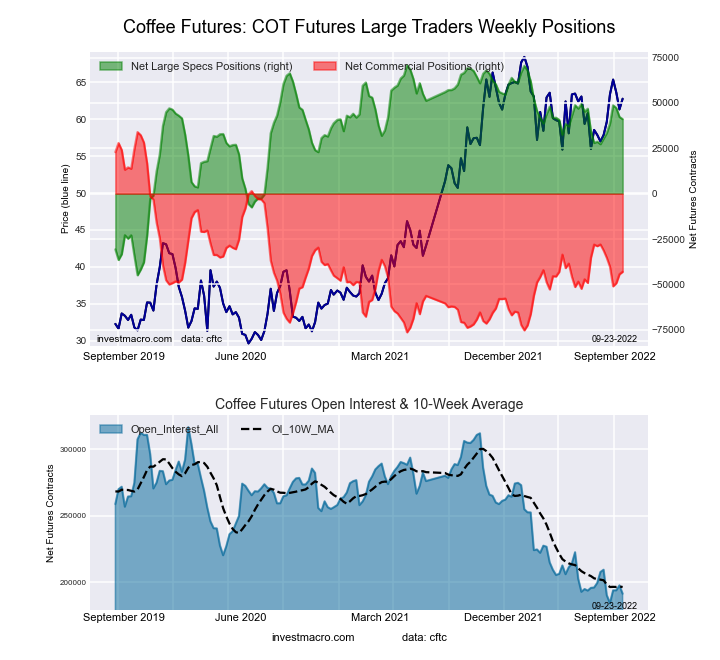 The COFFEE large speculator standing this week reached a net position of 41,072 contracts in the data reported through Tuesday. This was a weekly decline of -1,195 contracts from the previous week which had a total of 42,267 net contracts.
This week’s current strength score (the trader positioning range over the past three years, measured from 0 to 100) shows the speculators are currently Bullish with a score of 74.3 percent. The commercials are Bearish with a score of 30.2 percent and the small traders (not shown in chart) are Bearish-Extreme with a score of 17.2 percent.
| COFFEE Futures Statistics | SPECULATORS | COMMERCIALS | SMALL TRADERS |
| – Percent of Open Interest Longs: | 27.4 | 47.4 | 4.7 |
| – Percent of Open Interest Shorts: | 5.9 | 69.9 | 3.7 |
| – Net Position: | 41,072 | -42,998 | 1,926 |
| – Gross Longs: | 52,377 | 90,726 | 9,048 |
| – Gross Shorts: | 11,305 | 133,724 | 7,122 |
| – Long to Short Ratio: | 4.6 to 1 | 0.7 to 1 | 1.3 to 1 |
| NET POSITION TREND: | |||
| – Strength Index Score (3 Year Range Pct): | 74.3 | 30.2 | 17.2 |
| – Strength Index Reading (3 Year Range): | Bullish | Bearish | Bearish-Extreme |
| NET POSITION MOVEMENT INDEX: | |||
| – 6-Week Change in Strength Index: | 9.2 | -10.6 | 10.2 |
SOYBEANS Futures:
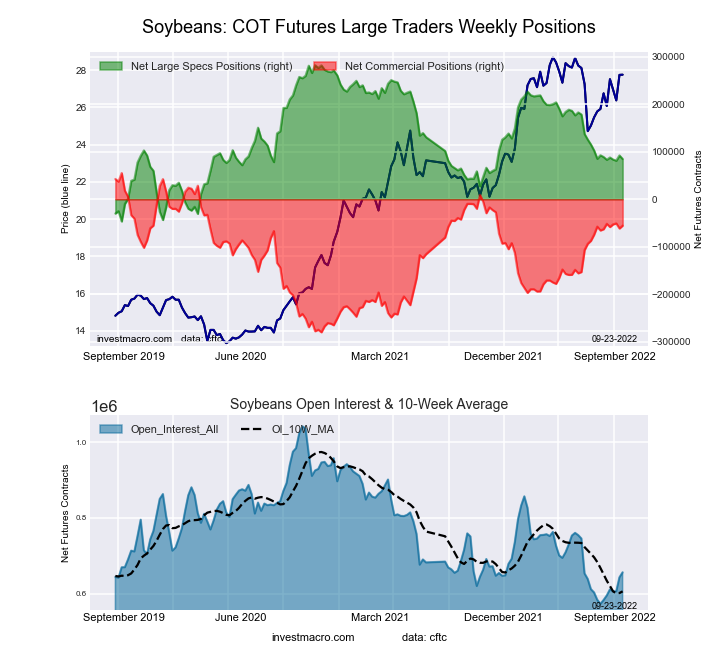 The SOYBEANS large speculator standing this week reached a net position of 84,773 contracts in the data reported through Tuesday. This was a weekly reduction of -7,337 contracts from the previous week which had a total of 92,110 net contracts.
This week’s current strength score (the trader positioning range over the past three years, measured from 0 to 100) shows the speculators are currently Bearish with a score of 39.4 percent. The commercials are Bullish with a score of 69.6 percent and the small traders (not shown in chart) are Bearish with a score of 21.5 percent.
| SOYBEANS Futures Statistics | SPECULATORS | COMMERCIALS | SMALL TRADERS |
| – Percent of Open Interest Longs: | 24.3 | 54.6 | 6.2 |
| – Percent of Open Interest Shorts: | 11.4 | 63.0 | 10.7 |
| – Net Position: | 84,773 | -55,485 | -29,288 |
| – Gross Longs: | 159,789 | 358,172 | 40,819 |
| – Gross Shorts: | 75,016 | 413,657 | 70,107 |
| – Long to Short Ratio: | 2.1 to 1 | 0.9 to 1 | 0.6 to 1 |
| NET POSITION TREND: | |||
| – Strength Index Score (3 Year Range Pct): | 39.4 | 69.6 | 21.5 |
| – Strength Index Reading (3 Year Range): | Bearish | Bullish | Bearish |
| NET POSITION MOVEMENT INDEX: | |||
| – 6-Week Change in Strength Index: | -1.3 | 2.3 | -5.7 |
SOYBEAN OIL Futures:
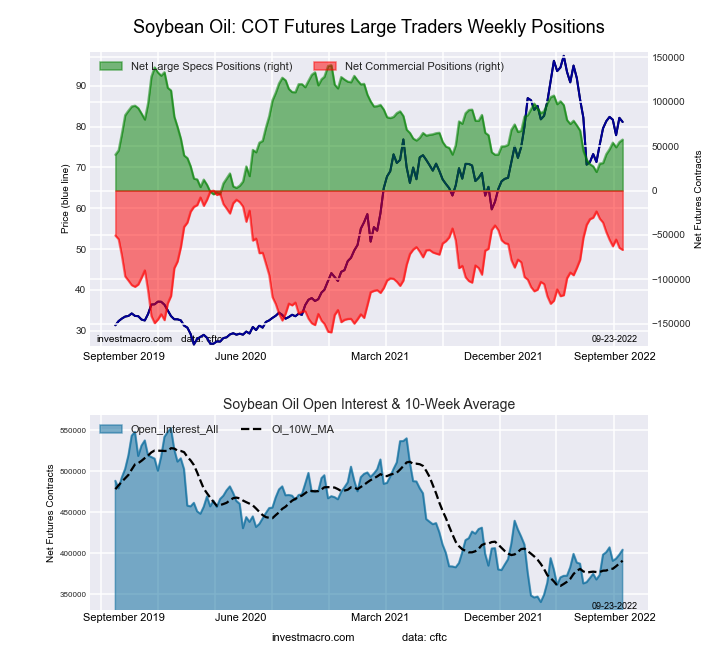 The SOYBEAN OIL large speculator standing this week reached a net position of 57,411 contracts in the data reported through Tuesday. This was a weekly rise of 2,830 contracts from the previous week which had a total of 54,581 net contracts.
This week’s current strength score (the trader positioning range over the past three years, measured from 0 to 100) shows the speculators are currently Bearish with a score of 42.4 percent. The commercials are Bullish with a score of 58.2 percent and the small traders (not shown in chart) are Bearish with a score of 48.3 percent.
| SOYBEAN OIL Futures Statistics | SPECULATORS | COMMERCIALS | SMALL TRADERS |
| – Percent of Open Interest Longs: | 22.1 | 50.3 | 7.9 |
| – Percent of Open Interest Shorts: | 7.9 | 66.8 | 5.6 |
| – Net Position: | 57,411 | -66,740 | 9,329 |
| – Gross Longs: | 89,528 | 203,403 | 31,920 |
| – Gross Shorts: | 32,117 | 270,143 | 22,591 |
| – Long to Short Ratio: | 2.8 to 1 | 0.8 to 1 | 1.4 to 1 |
| NET POSITION TREND: | |||
| – Strength Index Score (3 Year Range Pct): | 42.4 | 58.2 | 48.3 |
| – Strength Index Reading (3 Year Range): | Bearish | Bullish | Bearish |
| NET POSITION MOVEMENT INDEX: | |||
| – 6-Week Change in Strength Index: | 18.2 | -19.3 | 16.3 |
SOYBEAN MEAL Futures:
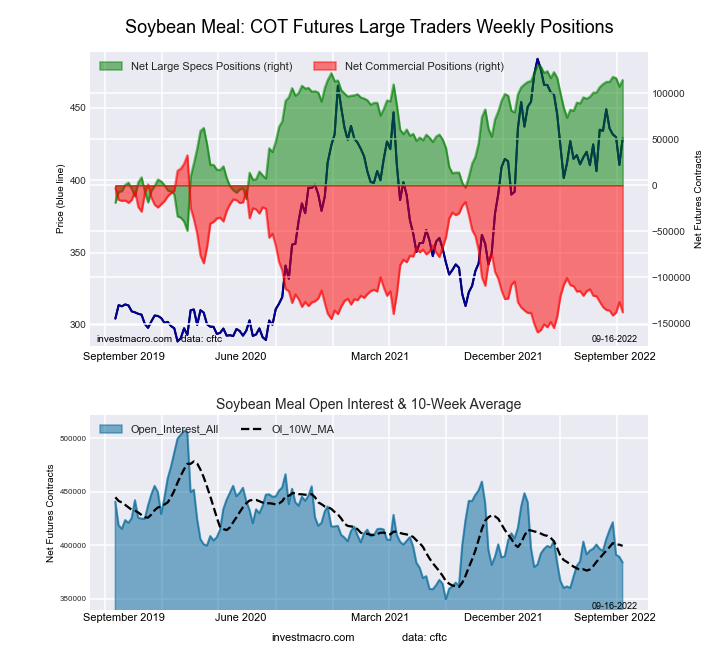
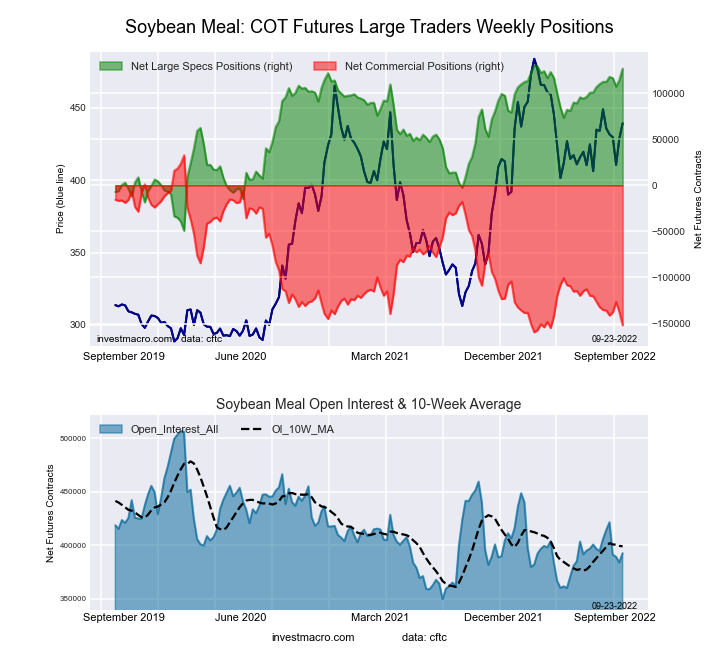 The SOYBEAN MEAL large speculator standing this week reached a net position of 126,470 contracts in the data reported through Tuesday. This was a weekly rise of 12,293 contracts from the previous week which had a total of 114,177 net contracts.
This week’s current strength score (the trader positioning range over the past three years, measured from 0 to 100) shows the speculators are currently Bullish-Extreme with a score of 97.9 percent. The commercials are Bearish-Extreme with a score of 4.0 percent and the small traders (not shown in chart) are Bullish with a score of 64.4 percent.
| SOYBEAN MEAL Futures Statistics | SPECULATORS | COMMERCIALS | SMALL TRADERS |
| – Percent of Open Interest Longs: | 35.2 | 39.9 | 12.9 |
| – Percent of Open Interest Shorts: | 3.0 | 78.6 | 6.4 |
| – Net Position: | 126,470 | -151,854 | 25,384 |
| – Gross Longs: | 138,080 | 156,677 | 50,445 |
| – Gross Shorts: | 11,610 | 308,531 | 25,061 |
| – Long to Short Ratio: | 11.9 to 1 | 0.5 to 1 | 2.0 to 1 |
| NET POSITION TREND: | |||
| – Strength Index Score (3 Year Range Pct): | 97.9 | 4.0 | 64.4 |
| – Strength Index Reading (3 Year Range): | Bullish-Extreme | Bearish-Extreme | Bullish |
| NET POSITION MOVEMENT INDEX: | |||
| – 6-Week Change in Strength Index: | 8.0 | -8.7 | 12.2 |
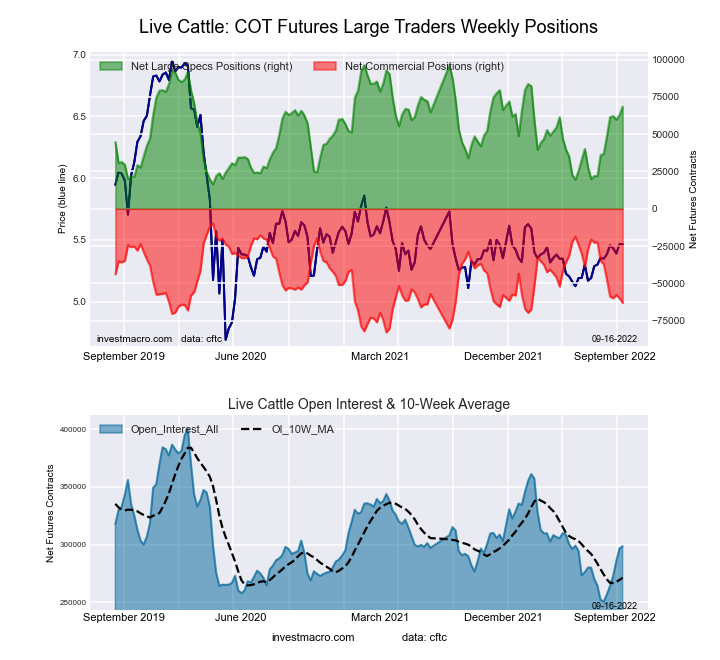
LIVE CATTLE Futures:
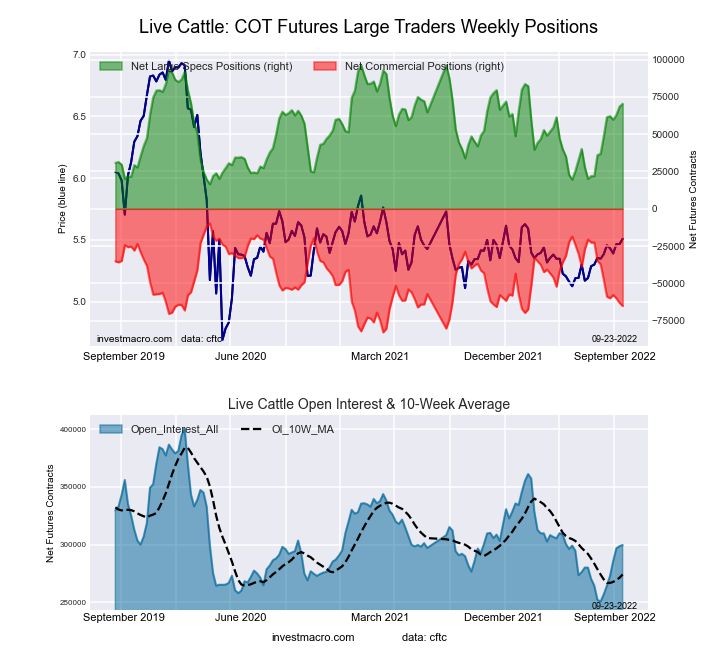 The LIVE CATTLE large speculator standing this week reached a net position of 70,367 contracts in the data reported through Tuesday. This was a weekly rise of 1,947 contracts from the previous week which had a total of 68,420 net contracts.
This week’s current strength score (the trader positioning range over the past three years, measured from 0 to 100) shows the speculators are currently Bullish with a score of 67.6 percent. The commercials are Bearish with a score of 24.2 percent and the small traders (not shown in chart) are Bullish with a score of 75.4 percent.
| LIVE CATTLE Futures Statistics | SPECULATORS | COMMERCIALS | SMALL TRADERS |
| – Percent of Open Interest Longs: | 40.2 | 32.4 | 10.9 |
| – Percent of Open Interest Shorts: | 16.7 | 54.1 | 12.7 |
| – Net Position: | 70,367 | -65,032 | -5,335 |
| – Gross Longs: | 120,432 | 96,998 | 32,801 |
| – Gross Shorts: | 50,065 | 162,030 | 38,136 |
| – Long to Short Ratio: | 2.4 to 1 | 0.6 to 1 | 0.9 to 1 |
| NET POSITION TREND: | |||
| – Strength Index Score (3 Year Range Pct): | 67.6 | 24.2 | 75.4 |
| – Strength Index Reading (3 Year Range): | Bullish | Bearish | Bullish |
| NET POSITION MOVEMENT INDEX: | |||
| – 6-Week Change in Strength Index: | 27.3 | -24.1 | -17.4 |
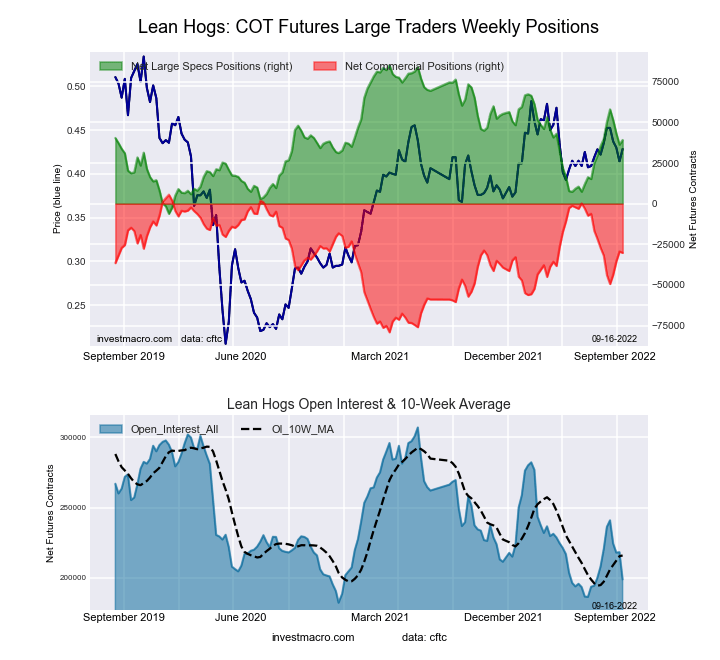
LEAN HOGS Futures:
 The LEAN HOGS large speculator standing this week reached a net position of 50,115 contracts in the data reported through Tuesday. This was a weekly lift of 10,953 contracts from the previous week which had a total of 39,162 net contracts.
This week’s current strength score (the trader positioning range over the past three years, measured from 0 to 100) shows the speculators are currently Bullish with a score of 61.3 percent. The commercials are Bearish with a score of 44.4 percent and the small traders (not shown in chart) are Bullish with a score of 52.2 percent.
| LEAN HOGS Futures Statistics | SPECULATORS | COMMERCIALS | SMALL TRADERS |
| – Percent of Open Interest Longs: | 42.8 | 34.3 | 9.2 |
| – Percent of Open Interest Shorts: | 18.8 | 54.3 | 13.3 |
| – Net Position: | 50,115 | -41,565 | -8,550 |
| – Gross Longs: | 89,178 | 71,385 | 19,095 |
| – Gross Shorts: | 39,063 | 112,950 | 27,645 |
| – Long to Short Ratio: | 2.3 to 1 | 0.6 to 1 | 0.7 to 1 |
| NET POSITION TREND: | |||
| – Strength Index Score (3 Year Range Pct): | 61.3 | 44.4 | 52.2 |
| – Strength Index Reading (3 Year Range): | Bullish | Bearish | Bullish |
| NET POSITION MOVEMENT INDEX: | |||
| – 6-Week Change in Strength Index: | -0.1 | 2.8 | -11.7 |
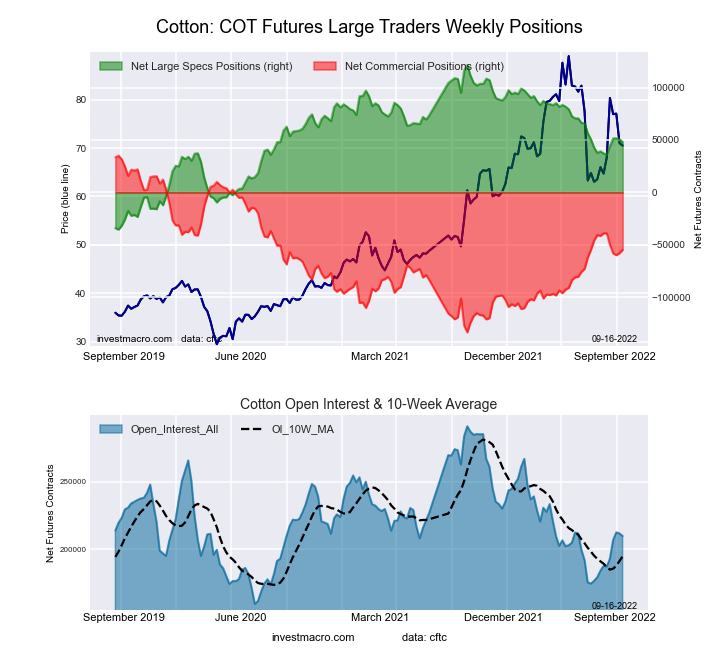
COTTON Futures:
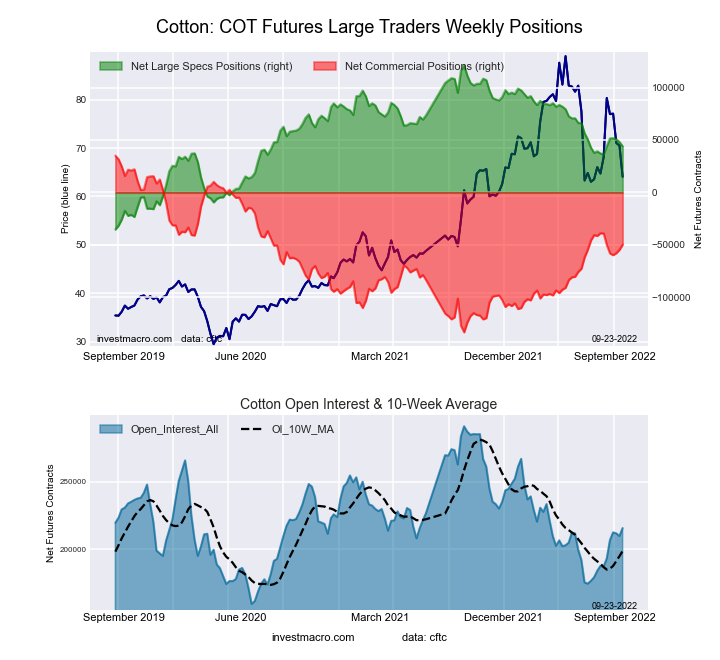 The COTTON large speculator standing this week reached a net position of 43,954 contracts in the data reported through Tuesday. This was a weekly decline of -4,086 contracts from the previous week which had a total of 48,040 net contracts.
This week’s current strength score (the trader positioning range over the past three years, measured from 0 to 100) shows the speculators are currently Bearish with a score of 46.5 percent. The commercials are Bullish with a score of 53.8 percent and the small traders (not shown in chart) are Bearish with a score of 47.6 percent.
| COTTON Futures Statistics | SPECULATORS | COMMERCIALS | SMALL TRADERS |
| – Percent of Open Interest Longs: | 33.1 | 47.5 | 6.8 |
| – Percent of Open Interest Shorts: | 12.7 | 70.5 | 4.1 |
| – Net Position: | 43,954 | -49,713 | 5,759 |
| – Gross Longs: | 71,269 | 102,276 | 14,638 |
| – Gross Shorts: | 27,315 | 151,989 | 8,879 |
| – Long to Short Ratio: | 2.6 to 1 | 0.7 to 1 | 1.6 to 1 |
| NET POSITION TREND: | |||
| – Strength Index Score (3 Year Range Pct): | 46.5 | 53.8 | 47.6 |
| – Strength Index Reading (3 Year Range): | Bearish | Bullish | Bearish |
| NET POSITION MOVEMENT INDEX: | |||
| – 6-Week Change in Strength Index: | 5.3 | -6.9 | 19.3 |
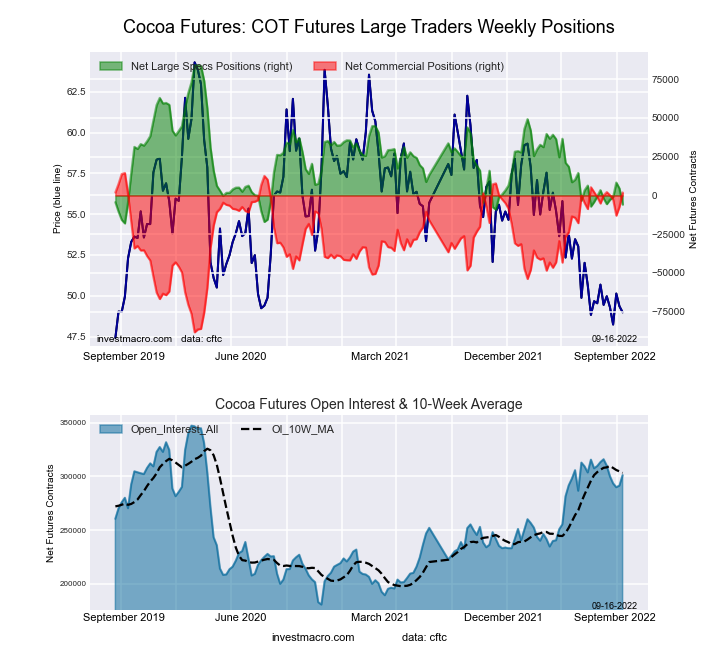
COCOA Futures:
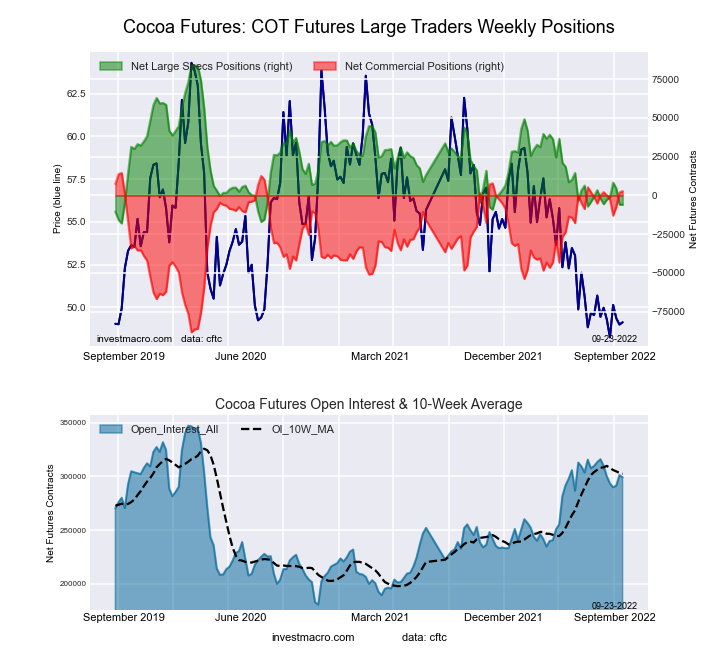 The COCOA large speculator standing this week reached a net position of -5,941 contracts in the data reported through Tuesday. This was a weekly decrease of -67 contracts from the previous week which had a total of -5,874 net contracts.
This week’s current strength score (the trader positioning range over the past three years, measured from 0 to 100) shows the speculators are currently Bearish-Extreme with a score of 11.0 percent. The commercials are Bullish-Extreme with a score of 90.3 percent and the small traders (not shown in chart) are Bearish with a score of 28.1 percent.
| COCOA Futures Statistics | SPECULATORS | COMMERCIALS | SMALL TRADERS |
| – Percent of Open Interest Longs: | 32.7 | 46.3 | 4.6 |
| – Percent of Open Interest Shorts: | 34.7 | 45.4 | 3.5 |
| – Net Position: | -5,941 | 2,779 | 3,162 |
| – Gross Longs: | 97,755 | 138,572 | 13,754 |
| – Gross Shorts: | 103,696 | 135,793 | 10,592 |
| – Long to Short Ratio: | 0.9 to 1 | 1.0 to 1 | 1.3 to 1 |
| NET POSITION TREND: | |||
| – Strength Index Score (3 Year Range Pct): | 11.0 | 90.3 | 28.1 |
| – Strength Index Reading (3 Year Range): | Bearish-Extreme | Bullish-Extreme | Bearish |
| NET POSITION MOVEMENT INDEX: | |||
| – 6-Week Change in Strength Index: | -0.4 | 0.6 | -2.5 |
WHEAT Futures:
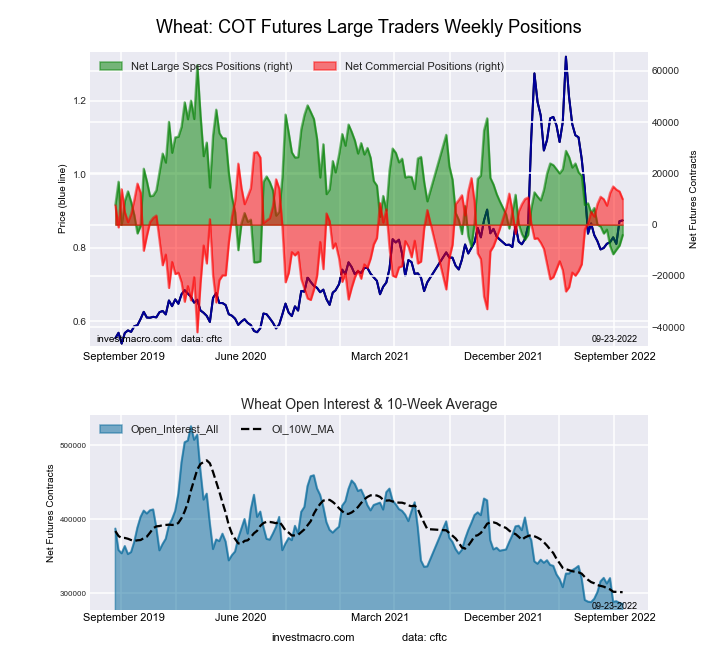 The WHEAT large speculator standing this week reached a net position of -4,029 contracts in the data reported through Tuesday. This was a weekly gain of 4,099 contracts from the previous week which had a total of -8,128 net contracts.
This week’s current strength score (the trader positioning range over the past three years, measured from 0 to 100) shows the speculators are currently Bearish-Extreme with a score of 13.8 percent. The commercials are Bullish with a score of 73.9 percent and the small traders (not shown in chart) are Bullish with a score of 79.5 percent.
| WHEAT Futures Statistics | SPECULATORS | COMMERCIALS | SMALL TRADERS |
| – Percent of Open Interest Longs: | 31.0 | 39.6 | 9.9 |
| – Percent of Open Interest Shorts: | 32.5 | 36.1 | 12.0 |
| – Net Position: | -4,029 | 9,982 | -5,953 |
| – Gross Longs: | 88,644 | 113,055 | 28,213 |
| – Gross Shorts: | 92,673 | 103,073 | 34,166 |
| – Long to Short Ratio: | 1.0 to 1 | 1.1 to 1 | 0.8 to 1 |
| NET POSITION TREND: | |||
| – Strength Index Score (3 Year Range Pct): | 13.8 | 73.9 | 79.5 |
| – Strength Index Reading (3 Year Range): | Bearish-Extreme | Bullish | Bullish |
| NET POSITION MOVEMENT INDEX: | |||
| – 6-Week Change in Strength Index: | -0.8 | 0.1 | 2.9 |
Article By InvestMacro – Receive our weekly COT Newsletter
*COT Report: The COT data, released weekly to the public each Friday, is updated through the most recent Tuesday (data is 3 days old) and shows a quick view of how large speculators or non-commercials (for-profit traders) were positioned in the futures markets.
The CFTC categorizes trader positions according to commercial hedgers (traders who use futures contracts for hedging as part of the business), non-commercials (large traders who speculate to realize trading profits) and nonreportable traders (usually small traders/speculators) as well as their open interest (contracts open in the market at time of reporting). See CFTC criteria here.


