
By InvestMacro
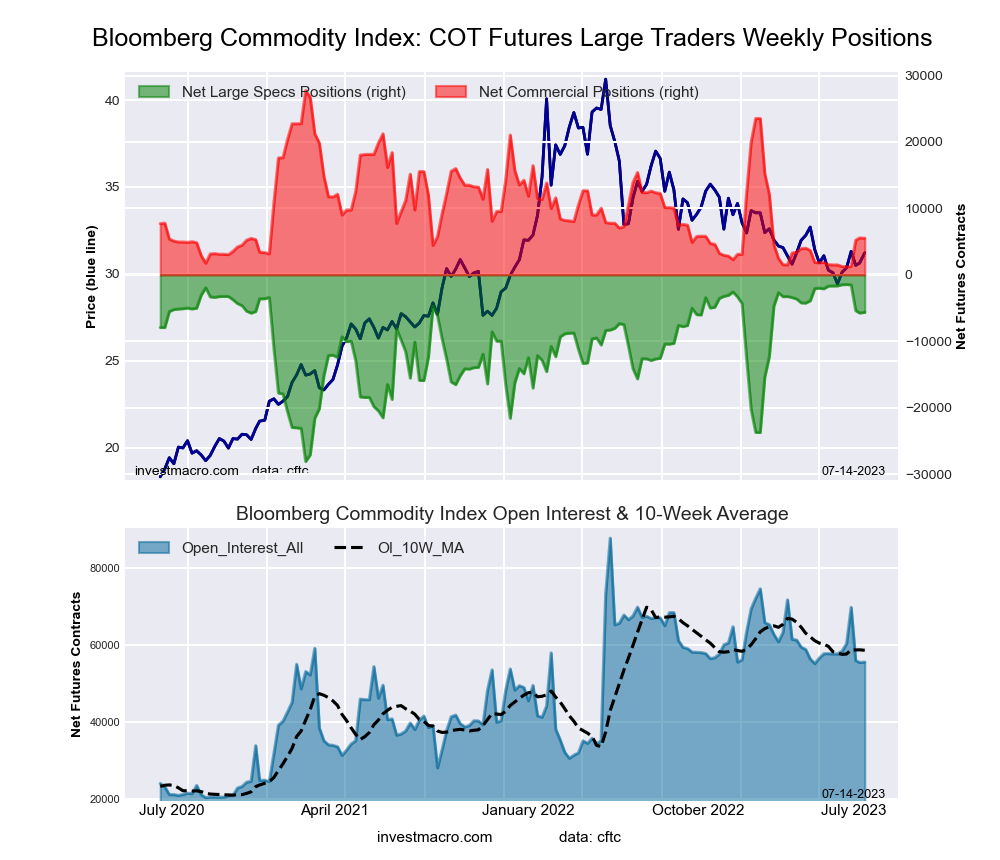
Here are the latest charts and statistics for the Commitment of Traders (COT) reports data published by the Commodities Futures Trading Commission (CFTC).
The latest COT data is updated through Tuesday July 18th and shows a quick view of how large traders (for-profit speculators and commercial entities) were positioned in the futures markets.
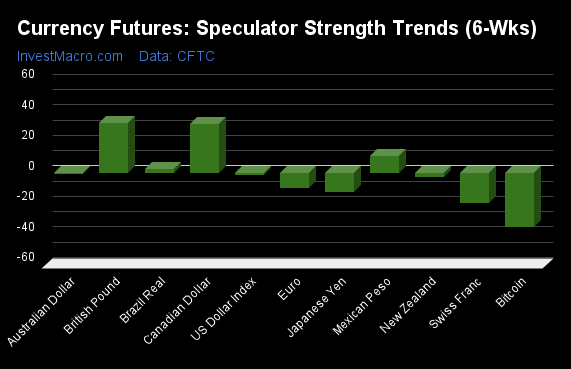
Weekly Speculator Changes led by Soybeans & Corn
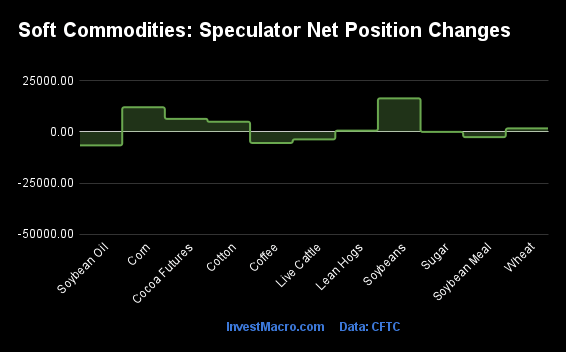
The COT soft commodities markets speculator bets were higher this week as seven out of the eleven softs markets we cover had higher positioning while the other four markets had lower speculator contracts.
Leading the gains for the softs markets was Soybeans (16,420 contracts) with Corn (12,059 contracts), Lean Hogs (628 contracts), Cocoa (6,373 contracts), Cotton (4,986 contracts), Wheat (1,708 contracts) and Sugar (2 contracts) also having positive weeks.
The markets with the declines in speculator bets this week were Coffee (-18,522 contracts) with Soybean Meal (-2,570 contracts), Live Cattle (-3,657 contracts) and Soybean Oil (-6,592 contracts) also seeing lower bets on the week.
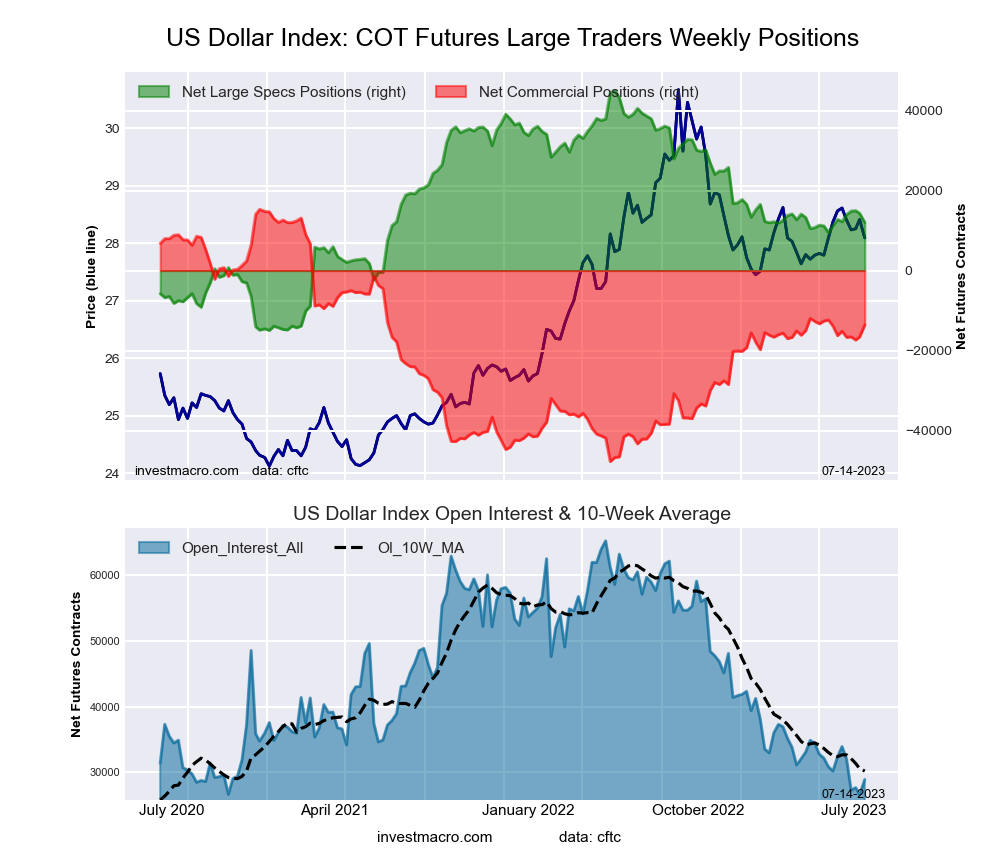
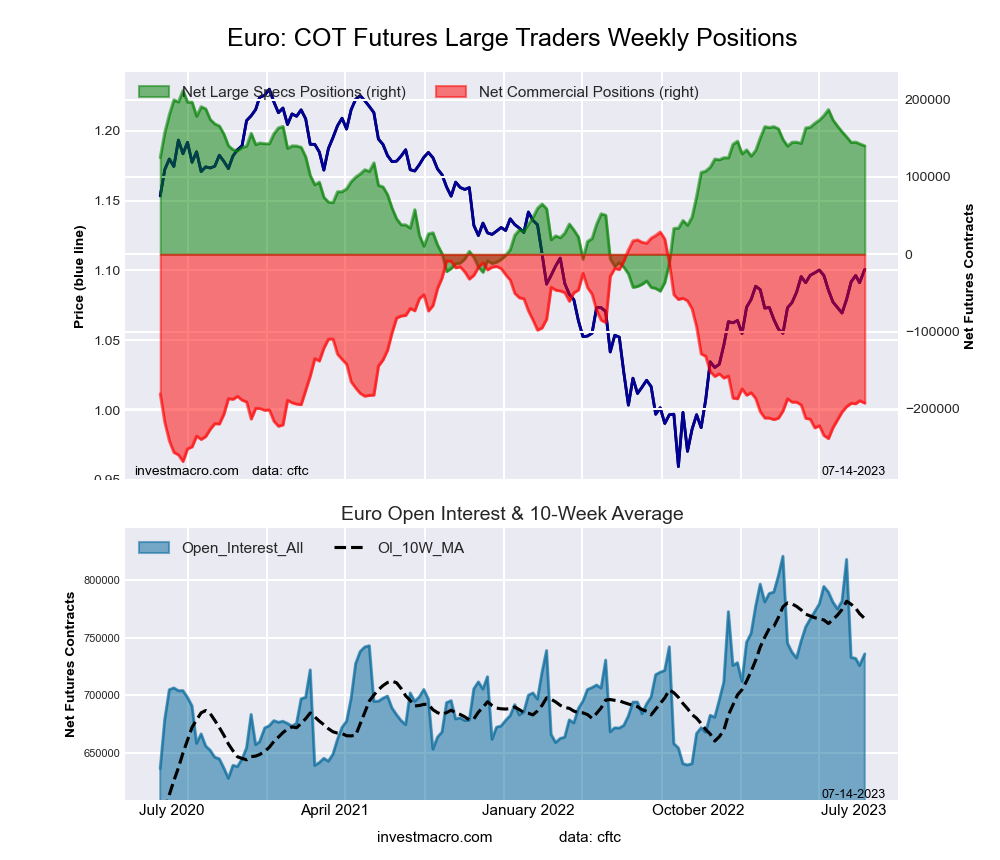
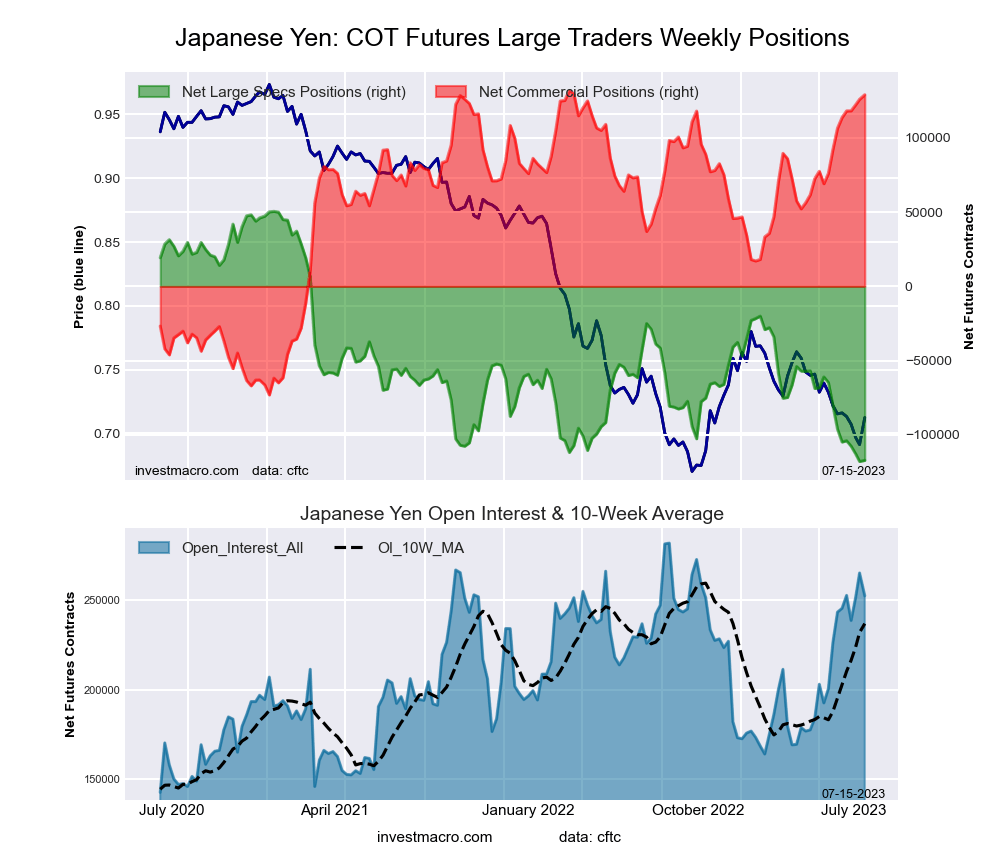
| Jul-18-2023 | OI | OI-Index | Spec-Net | Spec-Index | Com-Net | COM-Index | Smalls-Net | Smalls-Index |
|---|---|---|---|---|---|---|---|---|
| WTI Crude | 1,768,189 | 33 | 206,099 | 17 | -233,490 | 84 | 27,391 | 34 |
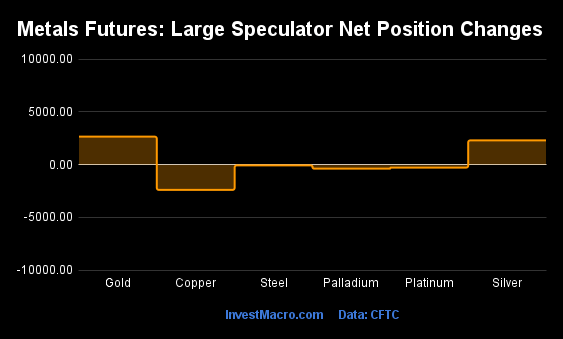
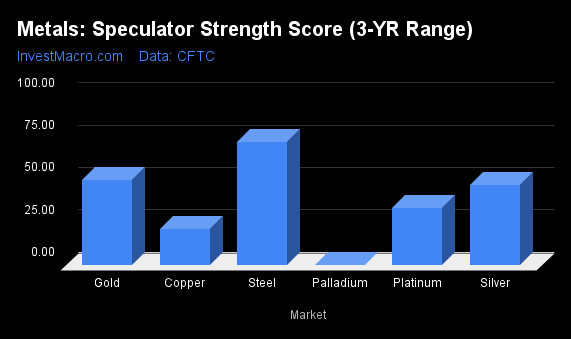
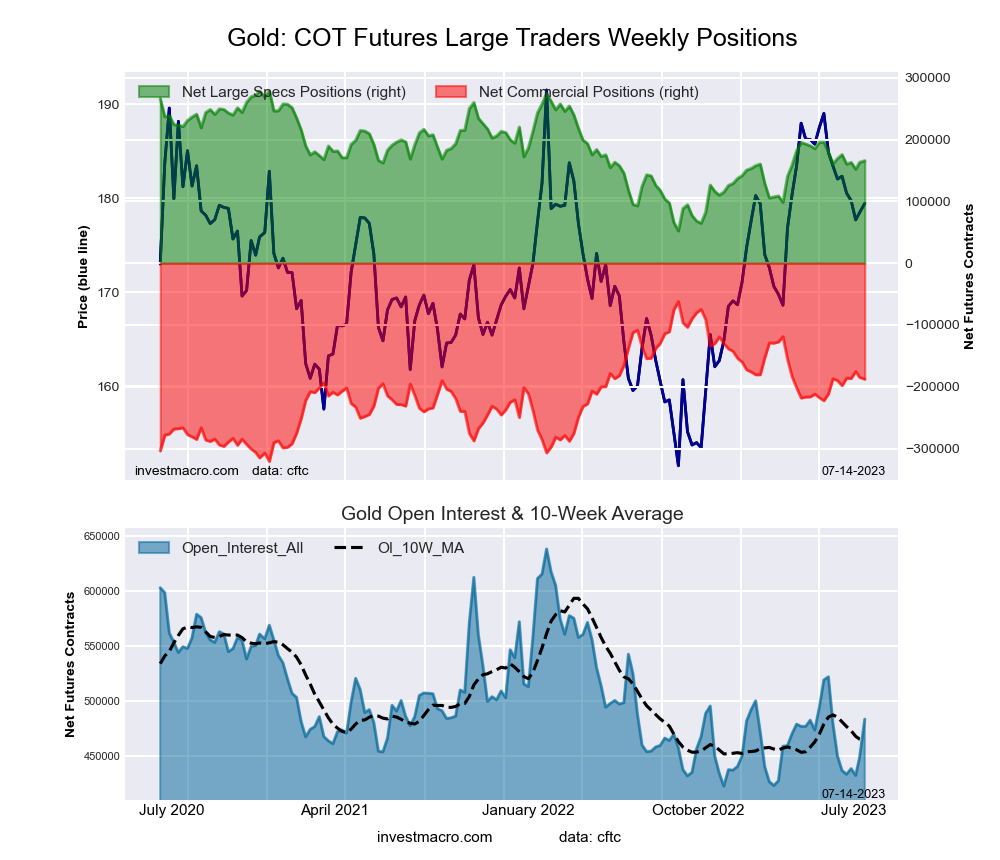
| Gold | 482,104 | 28 | 193,348 | 62 | -213,715 | 41 | 20,367 | 31 |
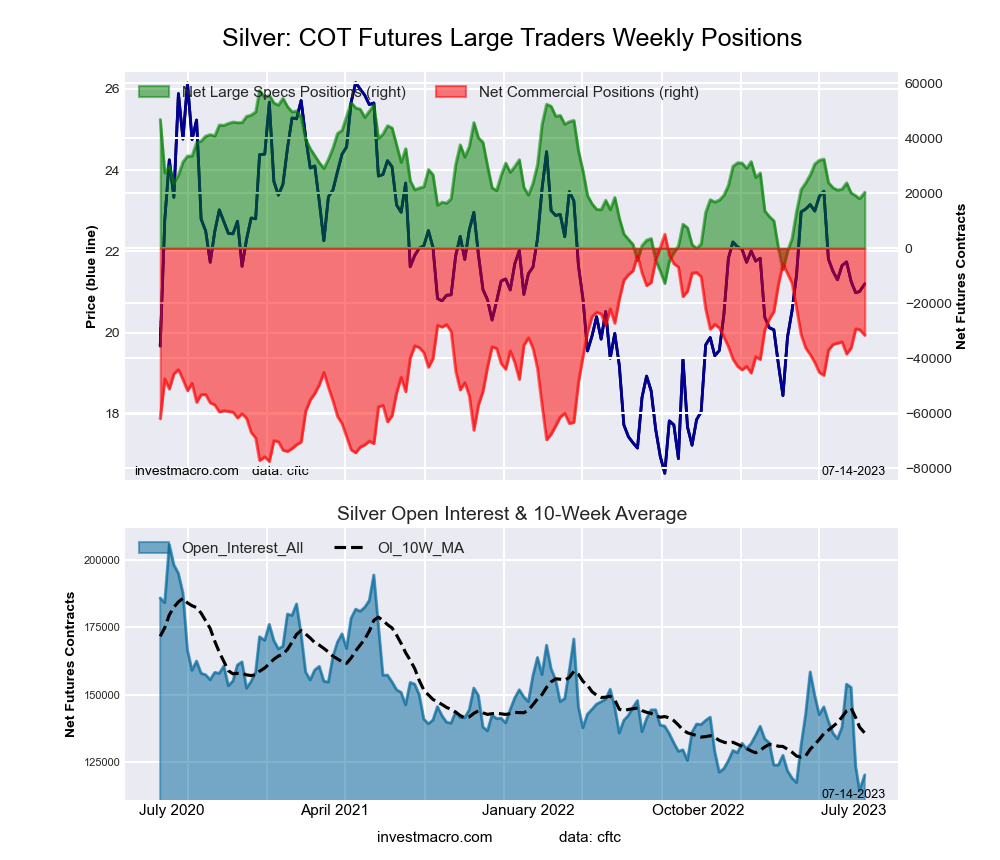
| Silver | 146,863 | 36 | 43,862 | 81 | -55,983 | 26 | 12,121 | 34 |
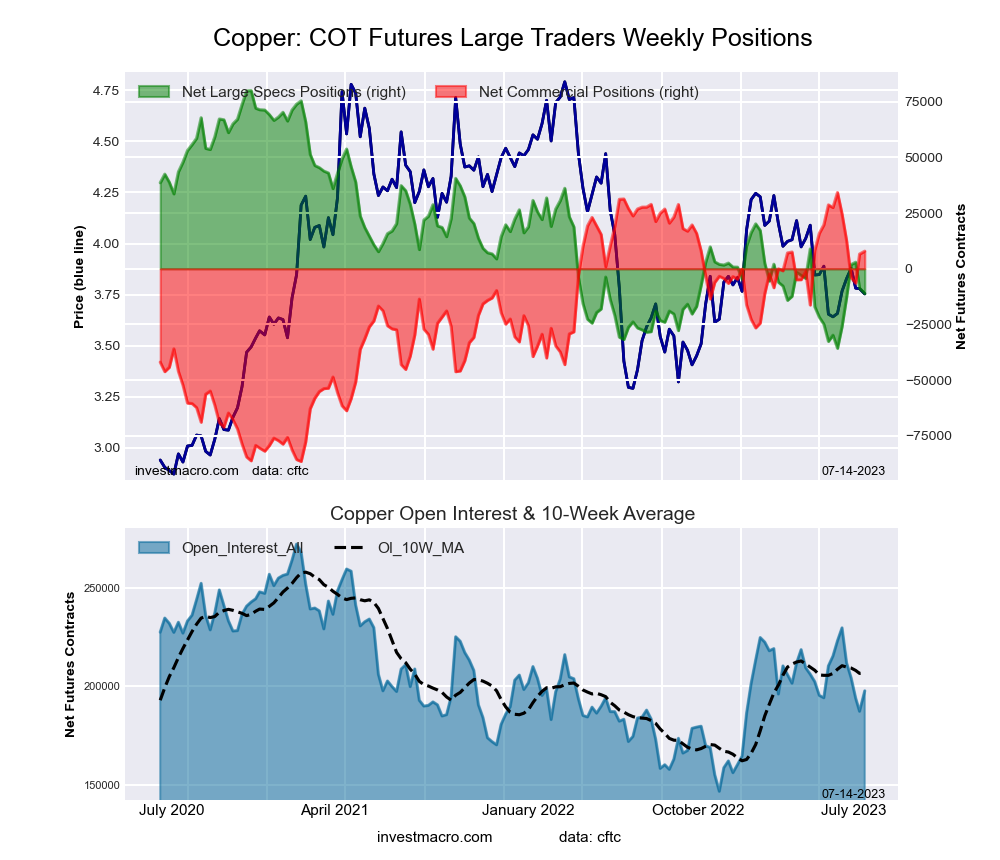
| Copper | 216,862 | 56 | -3,550 | 28 | -1,054 | 71 | 4,604 | 48 |
| Palladium | 16,017 | 100 | -8,350 | 0 | 8,837 | 100 | -487 | 12 |
| Platinum | 65,834 | 54 | 15,736 | 52 | -19,674 | 53 | 3,938 | 21 |
| Natural Gas | 1,234,296 | 56 | -95,762 | 34 | 65,084 | 65 | 30,678 | 53 |
| Brent | 128,248 | 2 | -45,770 | 22 | 42,386 | 79 | 3,384 | 55 |
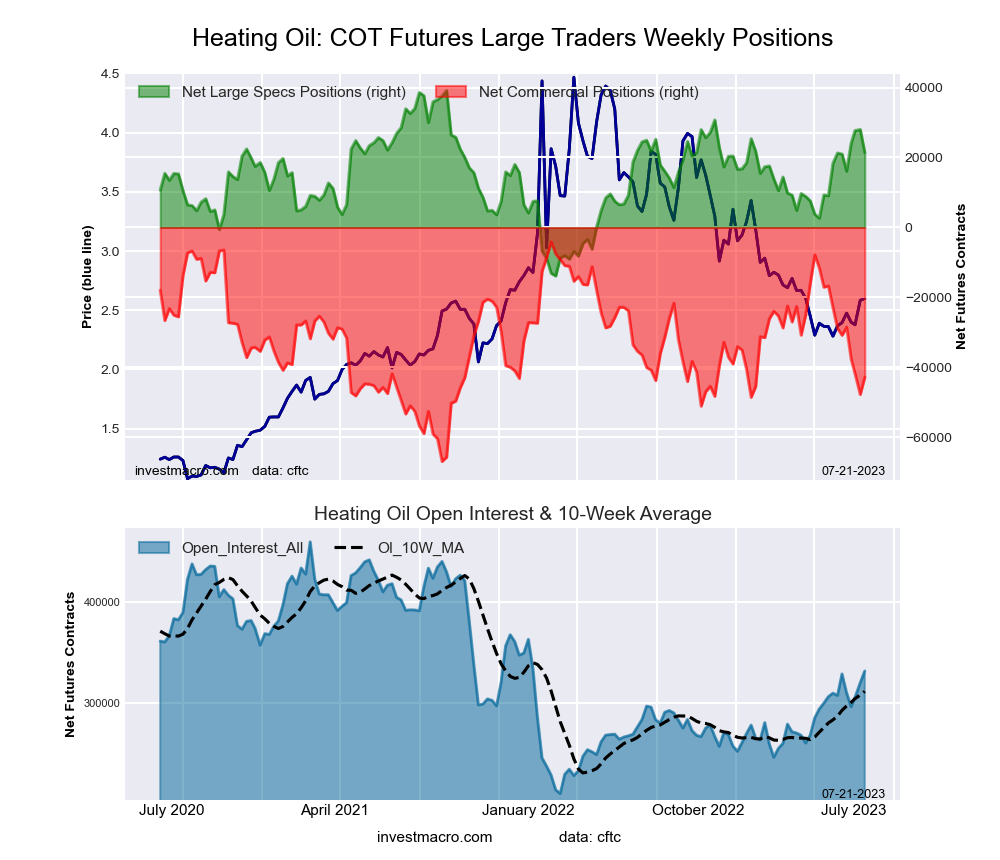
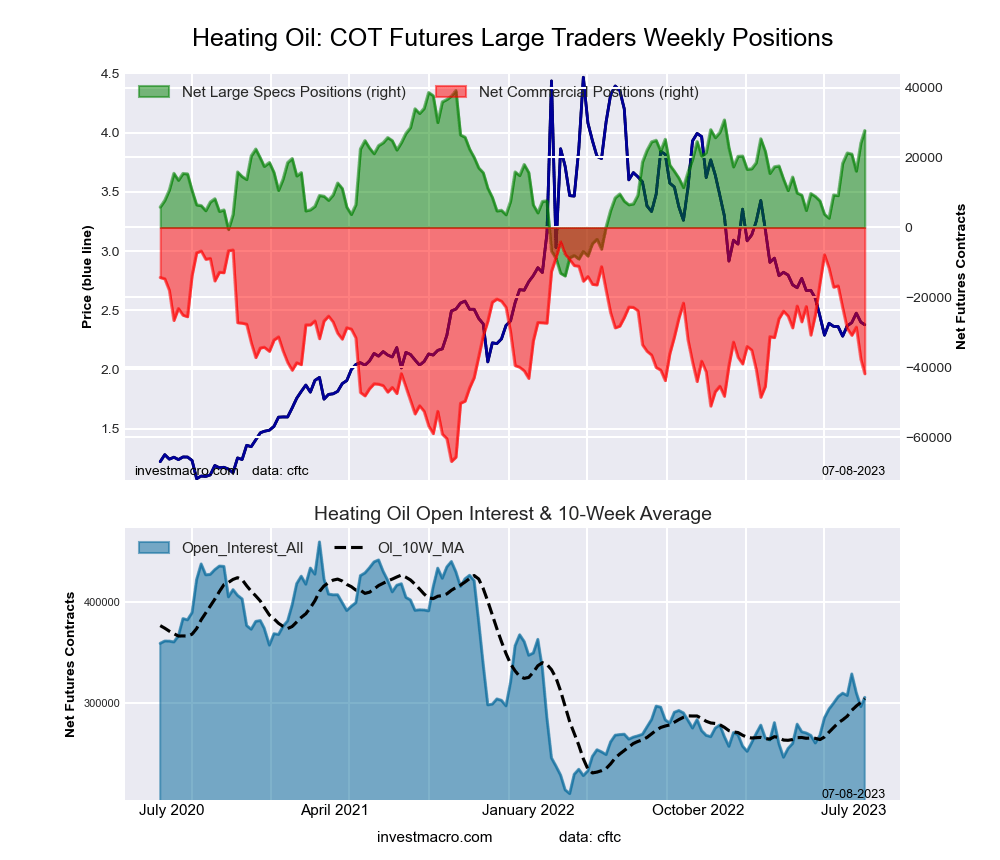
| Heating Oil | 331,790 | 49 | 21,392 | 67 | -42,785 | 38 | 21,393 | 72 |
| Soybeans | 659,917 | 19 | 107,283 | 31 | -81,463 | 69 | -25,820 | 40 |
| Corn | 1,285,176 | 13 | 19,870 | 24 | 31,268 | 81 | -51,138 | 41 |
| Coffee | 180,118 | 3 | 8,495 | 36 | -8,052 | 68 | -443 | 7 |
| Sugar | 881,020 | 44 | 196,306 | 60 | -226,229 | 41 | 29,923 | 41 |
| Wheat | 303,407 | 10 | -38,703 | 39 | 43,035 | 63 | -4,332 | 58 |
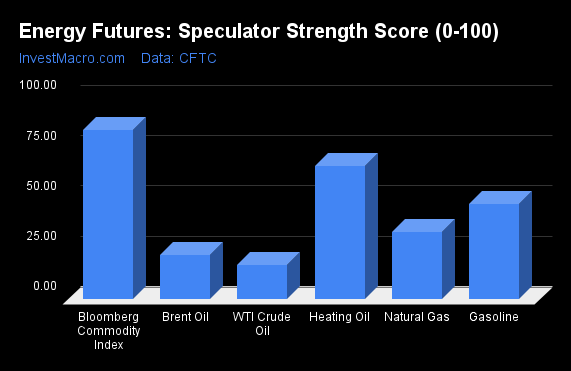
Strength Scores led by Cocoa & Live Cattle
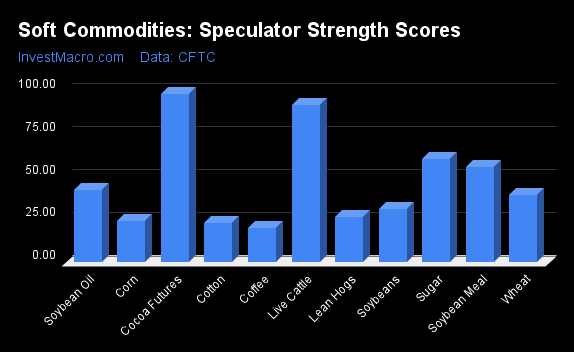
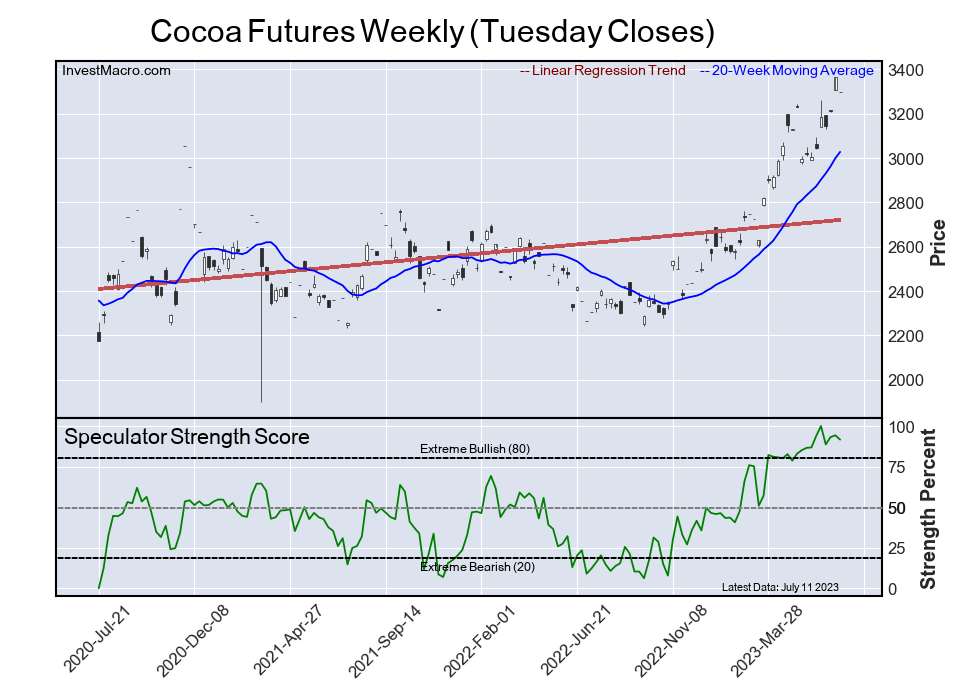
COT Strength Scores (a normalized measure of Speculator positions over a 3-Year range, from 0 to 100 where above 80 is Extreme-Bullish and below 20 is Extreme-Bearish) showed that Cocoa (98 percent) and Live Cattle (92 percent) lead the softs markets this week. Sugar (60 percent), Soybean Meal (56 percent) and Soybean Oil (42 percent) come in as the next highest in the weekly strength scores.
On the downside, Cotton (23 percent) and Corn (24 percent) come in at the lowest strength levels currently. The next lowest strength scores are the Lean Hogs (26 percent) and the Soybeans (31 percent).
Strength Statistics:
Corn (24.3 percent) vs Corn previous week (22.6 percent)
Sugar (60.3 percent) vs Sugar previous week (60.3 percent)
Coffee (36.1 percent) vs Coffee previous week (61.8 percent)
Soybeans (31.3 percent) vs Soybeans previous week (24.9 percent)
Soybean Oil (42.3 percent) vs Soybean Oil previous week (46.1 percent)
Soybean Meal (55.6 percent) vs Soybean Meal previous week (57.0 percent)
Live Cattle (92.0 percent) vs Live Cattle previous week (96.0 percent)
Lean Hogs (26.3 percent) vs Lean Hogs previous week (25.8 percent)
Cotton (22.6 percent) vs Cotton previous week (18.9 percent)
Cocoa (98.3 percent) vs Cocoa previous week (91.1 percent)
Wheat (39.3 percent) vs Wheat previous week (38.1 percent)
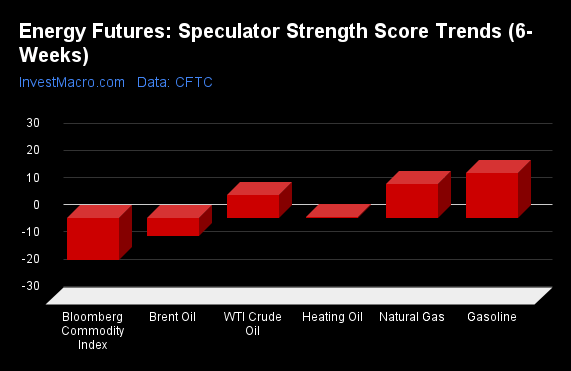
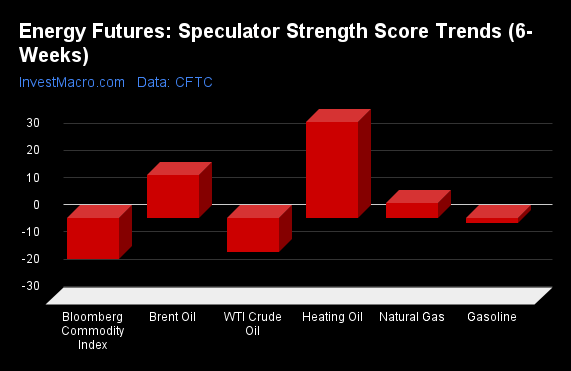
Wheat & Soybean Oil top the 6-Week Strength Trends
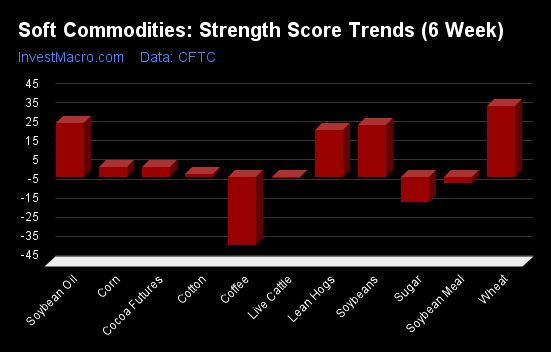
COT Strength Score Trends (or move index, calculates the 6-week changes in strength scores) showed that Wheat (37 percent) and Soybean Oil (28 percent) lead the past six weeks trends for soft commodities. Soybeans (27 percent), Lean Hogs (24 percent) and Corn (5 percent) are the next highest positive movers in the latest trends data.
Coffee (-23 percent) leads the downside trend scores currently with Sugar (-13 percent), Soybean Meal (-3 percent) and Live Cattle (-1 percent) following next with lower trend scores.
Strength Trend Statistics:
Corn (5.0 percent) vs Corn previous week (4.0 percent)
Sugar (-13.3 percent) vs Sugar previous week (-19.2 percent)
Coffee (-23.1 percent) vs Coffee previous week (-0.0 percent)
Soybeans (26.8 percent) vs Soybeans previous week (24.0 percent)
Soybean Oil (28.3 percent) vs Soybean Oil previous week (46.1 percent)
Soybean Meal (-3.4 percent) vs Soybean Meal previous week (2.9 percent)
Live Cattle (-0.8 percent) vs Live Cattle previous week (7.7 percent)
Lean Hogs (24.2 percent) vs Lean Hogs previous week (25.8 percent)
Cotton (1.5 percent) vs Cotton previous week (-0.8 percent)
Cocoa (4.9 percent) vs Cocoa previous week (5.2 percent)
Wheat (36.9 percent) vs Wheat previous week (38.1 percent)
Individual Soft Commodities Markets:
CORN Futures:
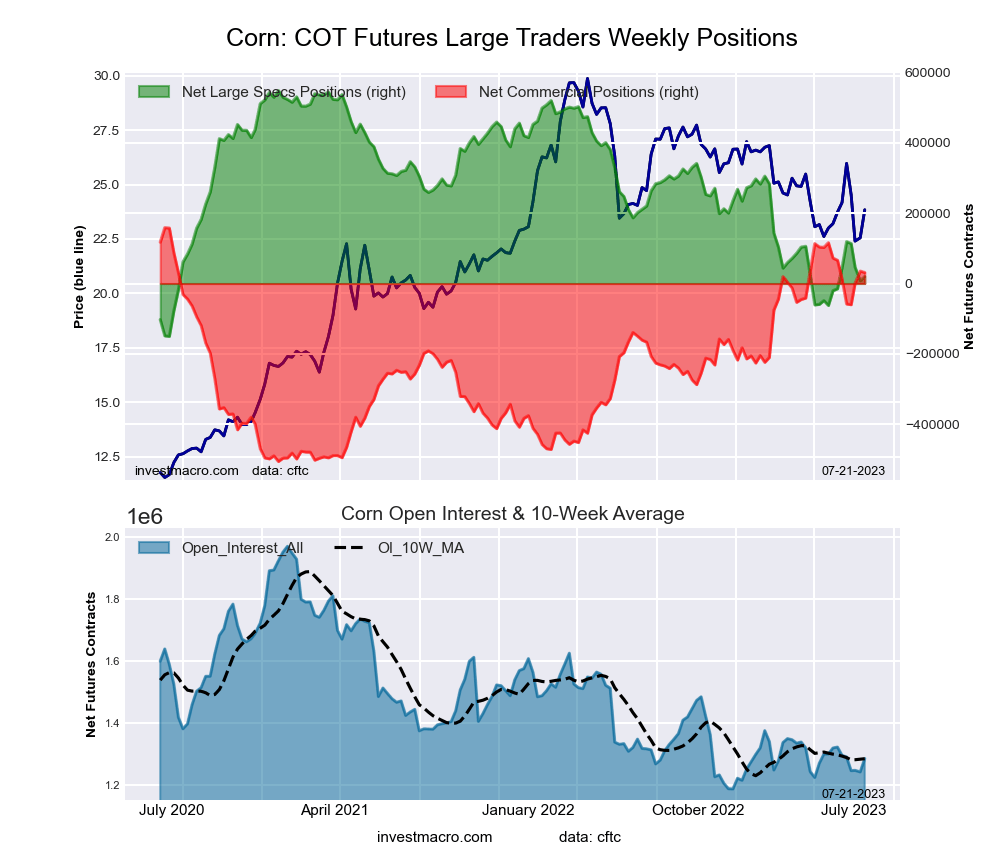 The CORN large speculator standing this week reached a net position of 19,870 contracts in the data reported through Tuesday. This was a weekly increase of 12,059 contracts from the previous week which had a total of 7,811 net contracts.
This week’s current strength score (the trader positioning range over the past three years, measured from 0 to 100) shows the speculators are currently Bearish with a score of 24.3 percent. The commercials are Bullish-Extreme with a score of 80.8 percent and the small traders (not shown in chart) are Bearish with a score of 40.8 percent.
Price Trend-Following Model: Weak Downtrend
Our weekly trend-following model classifies the current market price position as: Weak Downtrend. The current action for the model is considered to be: Hold – Maintain Short Position.
| CORN Futures Statistics | SPECULATORS | COMMERCIALS | SMALL TRADERS |
| – Percent of Open Interest Longs: | 21.1 | 48.6 | 9.5 |
| – Percent of Open Interest Shorts: | 19.5 | 46.2 | 13.5 |
| – Net Position: | 19,870 | 31,268 | -51,138 |
| – Gross Longs: | 270,722 | 624,697 | 122,460 |
| – Gross Shorts: | 250,852 | 593,429 | 173,598 |
| – Long to Short Ratio: | 1.1 to 1 | 1.1 to 1 | 0.7 to 1 |
| NET POSITION TREND: | |||
| – Strength Index Score (3 Year Range Pct): | 24.3 | 80.8 | 40.8 |
| – Strength Index Reading (3 Year Range): | Bearish | Bullish-Extreme | Bearish |
| NET POSITION MOVEMENT INDEX: | |||
| – 6-Week Change in Strength Index: | 5.0 | -5.3 | 0.3 |
SUGAR Futures:
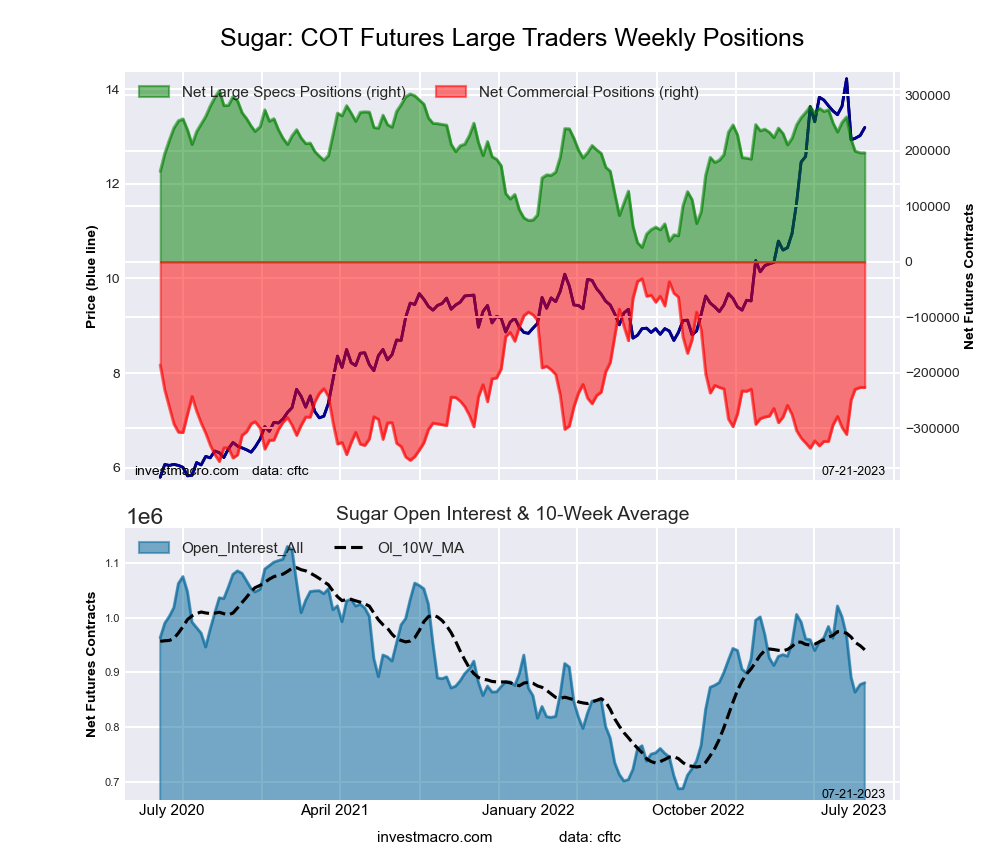 The SUGAR large speculator standing this week reached a net position of 196,306 contracts in the data reported through Tuesday. This was a weekly lift of 2 contracts from the previous week which had a total of 196,304 net contracts.
This week’s current strength score (the trader positioning range over the past three years, measured from 0 to 100) shows the speculators are currently Bullish with a score of 60.3 percent. The commercials are Bearish with a score of 40.5 percent and the small traders (not shown in chart) are Bearish with a score of 41.3 percent.
Price Trend-Following Model: Uptrend
Our weekly trend-following model classifies the current market price position as: Uptrend. The current action for the model is considered to be: Hold – Maintain Long Position.
| SUGAR Futures Statistics | SPECULATORS | COMMERCIALS | SMALL TRADERS |
| – Percent of Open Interest Longs: | 31.8 | 43.8 | 8.8 |
| – Percent of Open Interest Shorts: | 9.6 | 69.5 | 5.4 |
| – Net Position: | 196,306 | -226,229 | 29,923 |
| – Gross Longs: | 280,498 | 386,226 | 77,931 |
| – Gross Shorts: | 84,192 | 612,455 | 48,008 |
| – Long to Short Ratio: | 3.3 to 1 | 0.6 to 1 | 1.6 to 1 |
| NET POSITION TREND: | |||
| – Strength Index Score (3 Year Range Pct): | 60.3 | 40.5 | 41.3 |
| – Strength Index Reading (3 Year Range): | Bullish | Bearish | Bearish |
| NET POSITION MOVEMENT INDEX: | |||
| – 6-Week Change in Strength Index: | -13.3 | 15.9 | -19.2 |
COFFEE Futures:
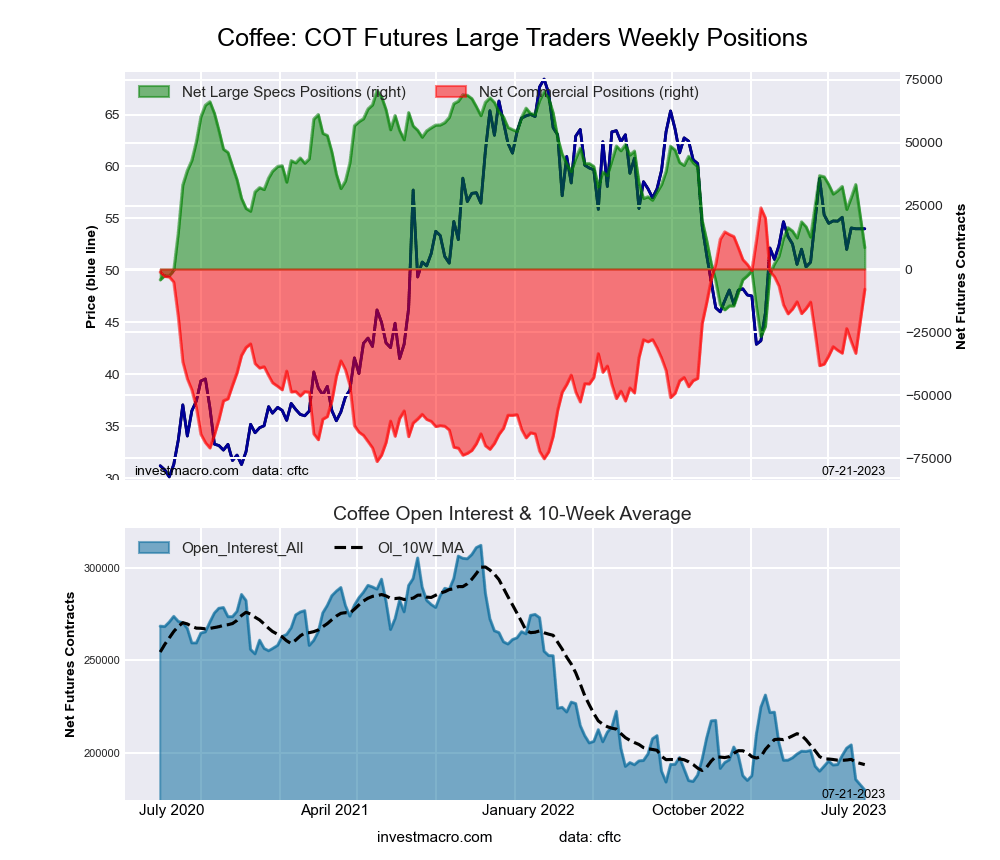 The COFFEE large speculator standing this week reached a net position of 8,495 contracts in the data reported through Tuesday. This was a weekly fall of -18,522 contracts from the previous week which had a total of 33,494 net contracts.
This week’s current strength score (the trader positioning range over the past three years, measured from 0 to 100) shows the speculators are currently Bearish with a score of 36.1 percent. The commercials are Bullish with a score of 67.9 percent and the small traders (not shown in chart) are Bearish-Extreme with a score of 7.3 percent.
Price Trend-Following Model: Uptrend
Our weekly trend-following model classifies the current market price position as: Uptrend. The current action for the model is considered to be: Hold – Maintain Long Position.
| COFFEE Futures Statistics | SPECULATORS | COMMERCIALS | SMALL TRADERS |
| – Percent of Open Interest Longs: | 23.4 | 47.0 | 3.7 |
| – Percent of Open Interest Shorts: | 18.7 | 51.4 | 3.9 |
| – Net Position: | 8,495 | -8,052 | -443 |
| – Gross Longs: | 42,190 | 84,606 | 6,662 |
| – Gross Shorts: | 33,695 | 92,658 | 7,105 |
| – Long to Short Ratio: | 1.3 to 1 | 0.9 to 1 | 0.9 to 1 |
| NET POSITION TREND: | |||
| – Strength Index Score (3 Year Range Pct): | 36.1 | 67.9 | 7.3 |
| – Strength Index Reading (3 Year Range): | Bearish | Bullish | Bearish-Extreme |
| NET POSITION MOVEMENT INDEX: | |||
| – 6-Week Change in Strength Index: | -23.1 | 24.0 | -19.8 |
SOYBEANS Futures:
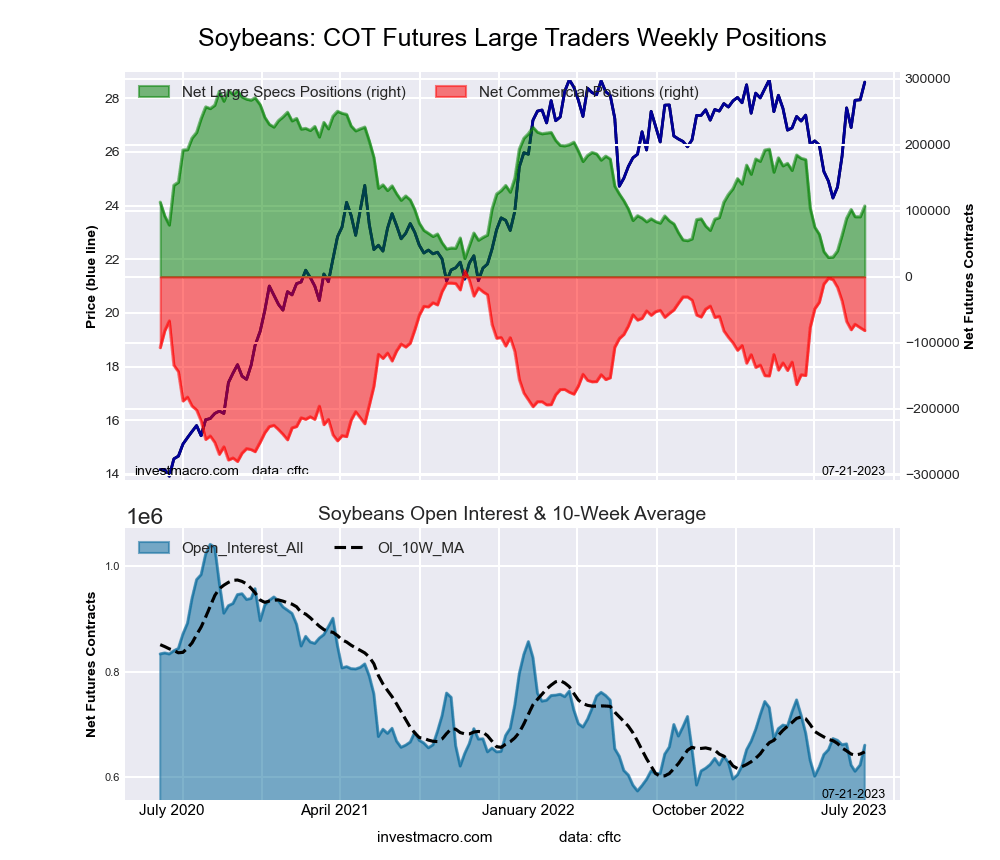 The SOYBEANS large speculator standing this week reached a net position of 107,283 contracts in the data reported through Tuesday. This was a weekly lift of 16,420 contracts from the previous week which had a total of 90,863 net contracts.
This week’s current strength score (the trader positioning range over the past three years, measured from 0 to 100) shows the speculators are currently Bearish with a score of 31.3 percent. The commercials are Bullish with a score of 68.7 percent and the small traders (not shown in chart) are Bearish with a score of 39.7 percent.
Price Trend-Following Model: Strong Uptrend
Our weekly trend-following model classifies the current market price position as: Strong Uptrend. The current action for the model is considered to be: New Buy – Long Position.
| SOYBEANS Futures Statistics | SPECULATORS | COMMERCIALS | SMALL TRADERS |
| – Percent of Open Interest Longs: | 28.1 | 48.6 | 7.3 |
| – Percent of Open Interest Shorts: | 11.8 | 60.9 | 11.3 |
| – Net Position: | 107,283 | -81,463 | -25,820 |
| – Gross Longs: | 185,158 | 320,592 | 48,459 |
| – Gross Shorts: | 77,875 | 402,055 | 74,279 |
| – Long to Short Ratio: | 2.4 to 1 | 0.8 to 1 | 0.7 to 1 |
| NET POSITION TREND: | |||
| – Strength Index Score (3 Year Range Pct): | 31.3 | 68.7 | 39.7 |
| – Strength Index Reading (3 Year Range): | Bearish | Bullish | Bearish |
| NET POSITION MOVEMENT INDEX: | |||
| – 6-Week Change in Strength Index: | 26.8 | -22.6 | -6.3 |
SOYBEAN OIL Futures:
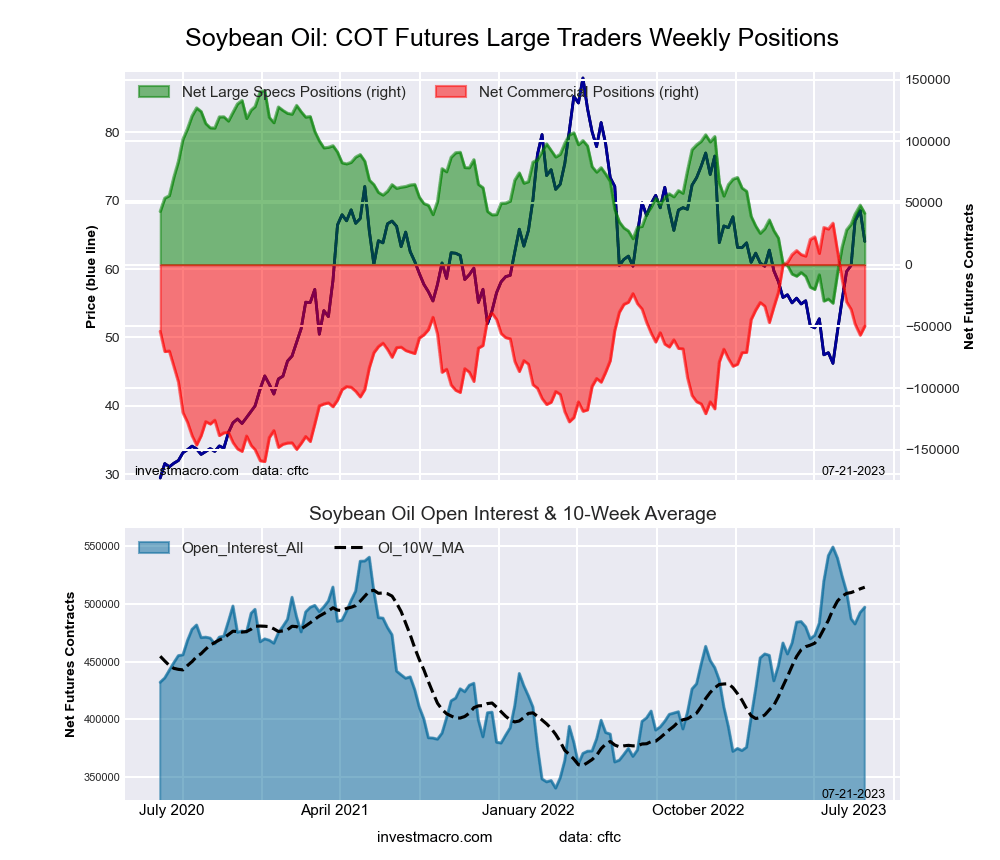 The SOYBEAN OIL large speculator standing this week reached a net position of 41,627 contracts in the data reported through Tuesday. This was a weekly reduction of -6,592 contracts from the previous week which had a total of 48,219 net contracts.
This week’s current strength score (the trader positioning range over the past three years, measured from 0 to 100) shows the speculators are currently Bearish with a score of 42.3 percent. The commercials are Bullish with a score of 56.8 percent and the small traders (not shown in chart) are Bearish with a score of 44.2 percent.
Price Trend-Following Model: Strong Uptrend
Our weekly trend-following model classifies the current market price position as: Strong Uptrend. The current action for the model is considered to be: Hold – Maintain Long Position.
| SOYBEAN OIL Futures Statistics | SPECULATORS | COMMERCIALS | SMALL TRADERS |
| – Percent of Open Interest Longs: | 18.5 | 56.2 | 7.0 |
| – Percent of Open Interest Shorts: | 10.1 | 66.2 | 5.4 |
| – Net Position: | 41,627 | -49,860 | 8,233 |
| – Gross Longs: | 91,700 | 279,250 | 34,970 |
| – Gross Shorts: | 50,073 | 329,110 | 26,737 |
| – Long to Short Ratio: | 1.8 to 1 | 0.8 to 1 | 1.3 to 1 |
| NET POSITION TREND: | |||
| – Strength Index Score (3 Year Range Pct): | 42.3 | 56.8 | 44.2 |
| – Strength Index Reading (3 Year Range): | Bearish | Bullish | Bearish |
| NET POSITION MOVEMENT INDEX: | |||
| – 6-Week Change in Strength Index: | 28.3 | -31.4 | 44.2 |
SOYBEAN MEAL Futures:
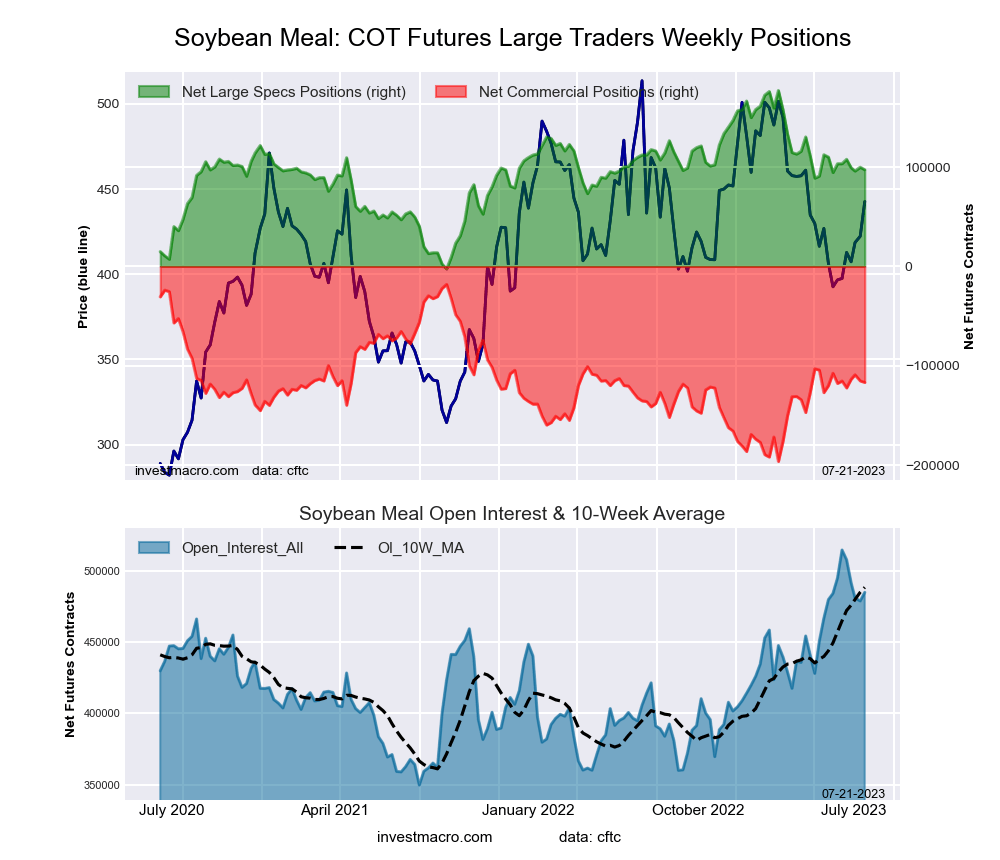 The SOYBEAN MEAL large speculator standing this week reached a net position of 97,251 contracts in the data reported through Tuesday. This was a weekly decrease of -2,570 contracts from the previous week which had a total of 99,821 net contracts.
This week’s current strength score (the trader positioning range over the past three years, measured from 0 to 100) shows the speculators are currently Bullish with a score of 55.6 percent. The commercials are Bearish with a score of 44.7 percent and the small traders (not shown in chart) are Bearish with a score of 42.4 percent.
Price Trend-Following Model: Weak Downtrend
Our weekly trend-following model classifies the current market price position as: Weak Downtrend. The current action for the model is considered to be: Hold – Maintain Short Position.
| SOYBEAN MEAL Futures Statistics | SPECULATORS | COMMERCIALS | SMALL TRADERS |
| – Percent of Open Interest Longs: | 24.2 | 37.9 | 9.8 |
| – Percent of Open Interest Shorts: | 4.1 | 62.0 | 5.8 |
| – Net Position: | 97,251 | -116,636 | 19,385 |
| – Gross Longs: | 117,168 | 183,807 | 47,602 |
| – Gross Shorts: | 19,917 | 300,443 | 28,217 |
| – Long to Short Ratio: | 5.9 to 1 | 0.6 to 1 | 1.7 to 1 |
| NET POSITION TREND: | |||
| – Strength Index Score (3 Year Range Pct): | 55.6 | 44.7 | 42.4 |
| – Strength Index Reading (3 Year Range): | Bullish | Bearish | Bearish |
| NET POSITION MOVEMENT INDEX: | |||
| – 6-Week Change in Strength Index: | -3.4 | 0.6 | 22.7 |
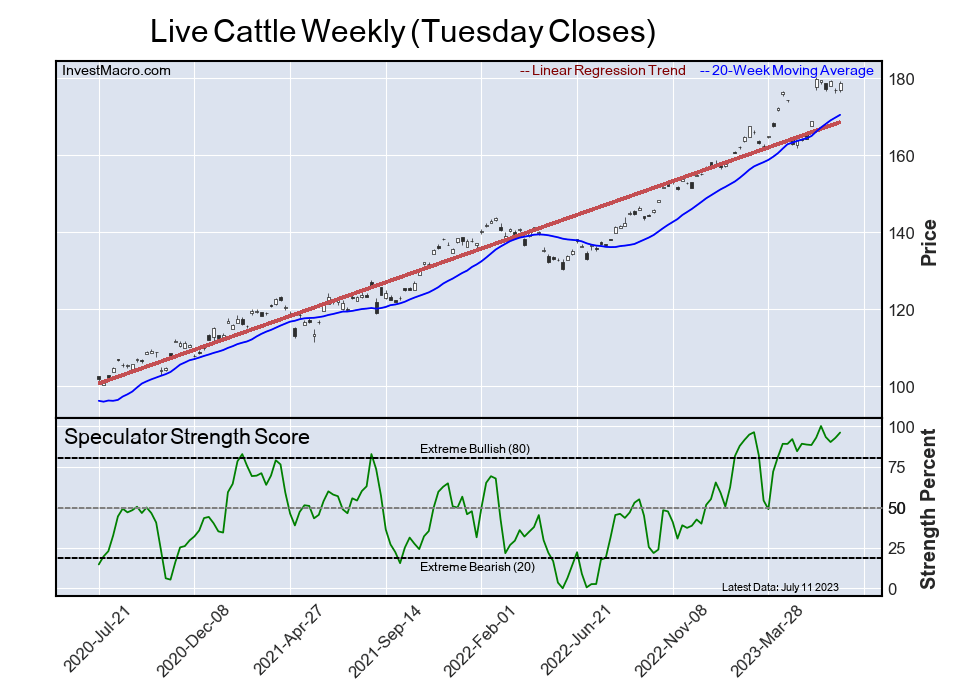
LIVE CATTLE Futures:
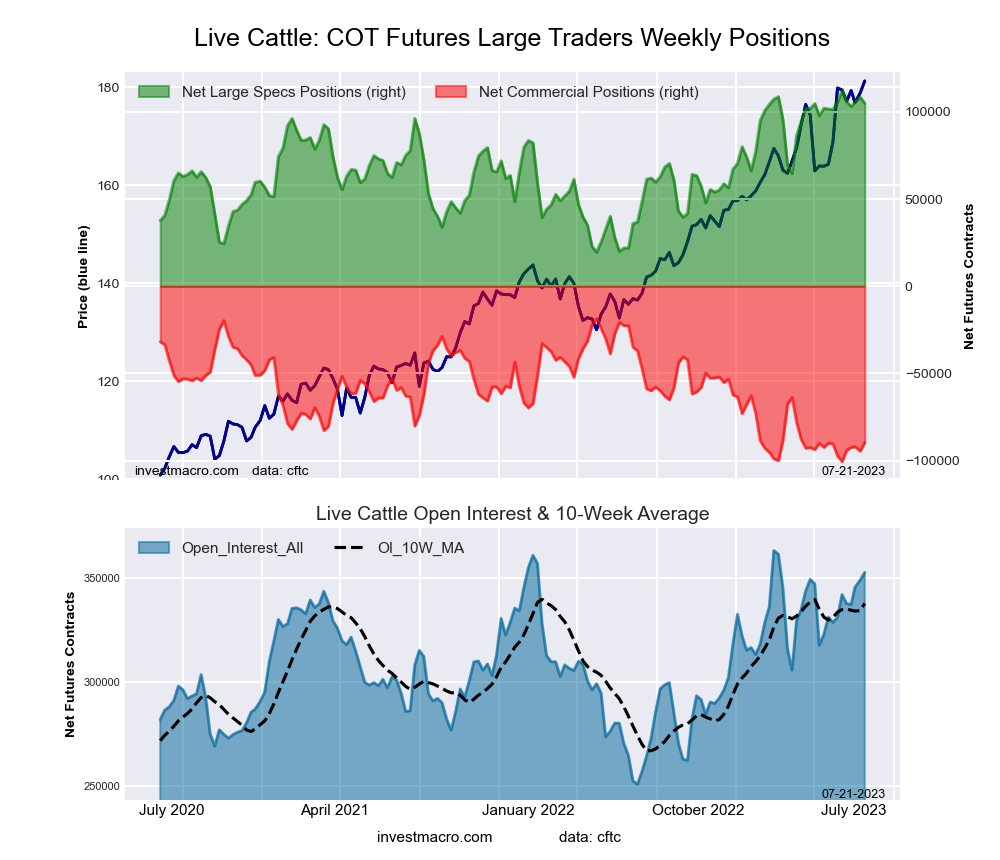 The LIVE CATTLE large speculator standing this week reached a net position of 104,844 contracts in the data reported through Tuesday. This was a weekly decline of -3,657 contracts from the previous week which had a total of 108,501 net contracts.
This week’s current strength score (the trader positioning range over the past three years, measured from 0 to 100) shows the speculators are currently Bullish-Extreme with a score of 92.0 percent. The commercials are Bearish-Extreme with a score of 13.2 percent and the small traders (not shown in chart) are Bearish-Extreme with a score of 4.8 percent.
Price Trend-Following Model: Strong Uptrend
Our weekly trend-following model classifies the current market price position as: Strong Uptrend. The current action for the model is considered to be: Hold – Maintain Long Position.
| LIVE CATTLE Futures Statistics | SPECULATORS | COMMERCIALS | SMALL TRADERS |
| – Percent of Open Interest Longs: | 43.7 | 29.3 | 8.3 |
| – Percent of Open Interest Shorts: | 14.0 | 54.7 | 12.6 |
| – Net Position: | 104,844 | -89,634 | -15,210 |
| – Gross Longs: | 154,268 | 103,445 | 29,170 |
| – Gross Shorts: | 49,424 | 193,079 | 44,380 |
| – Long to Short Ratio: | 3.1 to 1 | 0.5 to 1 | 0.7 to 1 |
| NET POSITION TREND: | |||
| – Strength Index Score (3 Year Range Pct): | 92.0 | 13.2 | 4.8 |
| – Strength Index Reading (3 Year Range): | Bullish-Extreme | Bearish-Extreme | Bearish-Extreme |
| NET POSITION MOVEMENT INDEX: | |||
| – 6-Week Change in Strength Index: | -0.8 | 9.4 | -38.4 |
LEAN HOGS Futures:
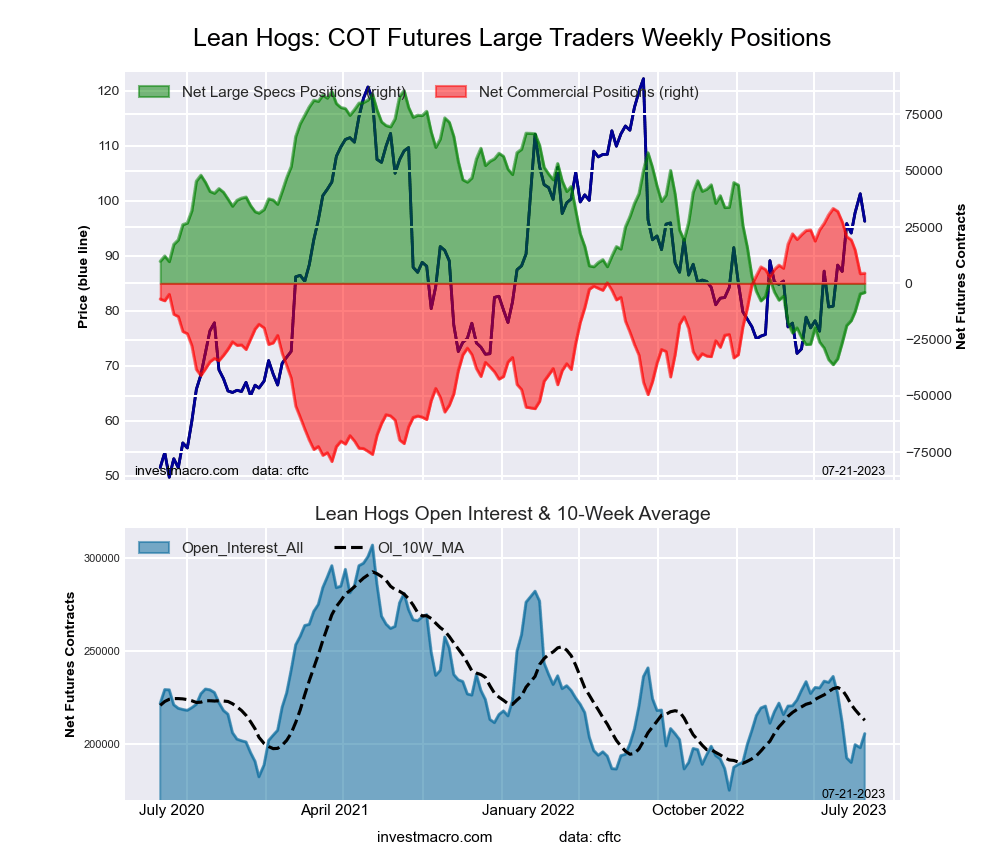 The LEAN HOGS large speculator standing this week reached a net position of -4,061 contracts in the data reported through Tuesday. This was a weekly gain of 628 contracts from the previous week which had a total of -4,689 net contracts.
This week’s current strength score (the trader positioning range over the past three years, measured from 0 to 100) shows the speculators are currently Bearish with a score of 26.3 percent. The commercials are Bullish with a score of 74.4 percent and the small traders (not shown in chart) are Bullish-Extreme with a score of 81.6 percent.
Price Trend-Following Model: Strong Uptrend
Our weekly trend-following model classifies the current market price position as: Strong Uptrend. The current action for the model is considered to be: Hold – Maintain Long Position.
| LEAN HOGS Futures Statistics | SPECULATORS | COMMERCIALS | SMALL TRADERS |
| – Percent of Open Interest Longs: | 31.1 | 37.9 | 10.0 |
| – Percent of Open Interest Shorts: | 33.1 | 35.8 | 10.2 |
| – Net Position: | -4,061 | 4,462 | -401 |
| – Gross Longs: | 63,838 | 77,936 | 20,508 |
| – Gross Shorts: | 67,899 | 73,474 | 20,909 |
| – Long to Short Ratio: | 0.9 to 1 | 1.1 to 1 | 1.0 to 1 |
| NET POSITION TREND: | |||
| – Strength Index Score (3 Year Range Pct): | 26.3 | 74.4 | 81.6 |
| – Strength Index Reading (3 Year Range): | Bearish | Bullish | Bullish-Extreme |
| NET POSITION MOVEMENT INDEX: | |||
| – 6-Week Change in Strength Index: | 24.2 | -24.5 | -8.7 |
COTTON Futures:
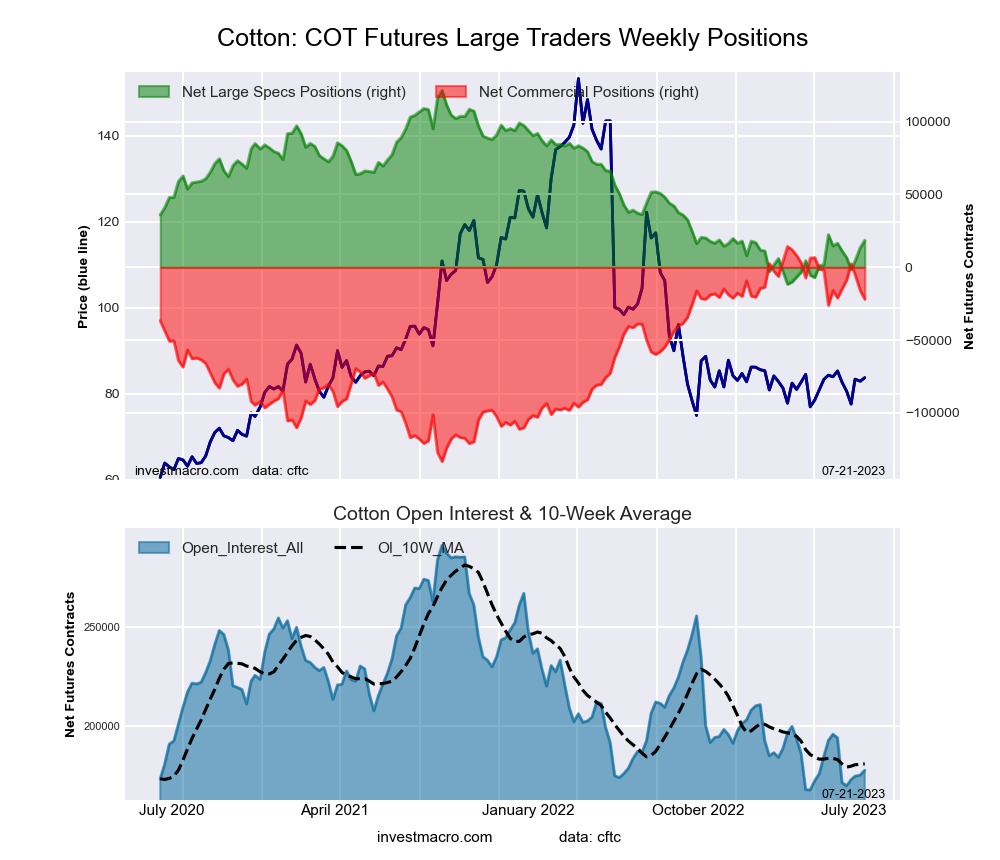 The COTTON large speculator standing this week reached a net position of 18,481 contracts in the data reported through Tuesday. This was a weekly rise of 4,986 contracts from the previous week which had a total of 13,495 net contracts.
This week’s current strength score (the trader positioning range over the past three years, measured from 0 to 100) shows the speculators are currently Bearish with a score of 22.6 percent. The commercials are Bullish with a score of 75.5 percent and the small traders (not shown in chart) are Bearish with a score of 36.9 percent.
Price Trend-Following Model: Strong Uptrend
Our weekly trend-following model classifies the current market price position as: Strong Uptrend. The current action for the model is considered to be: Hold – Maintain Long Position.
| COTTON Futures Statistics | SPECULATORS | COMMERCIALS | SMALL TRADERS |
| – Percent of Open Interest Longs: | 32.3 | 49.6 | 7.6 |
| – Percent of Open Interest Shorts: | 21.9 | 61.9 | 5.7 |
| – Net Position: | 18,481 | -21,929 | 3,448 |
| – Gross Longs: | 57,414 | 88,259 | 13,524 |
| – Gross Shorts: | 38,933 | 110,188 | 10,076 |
| – Long to Short Ratio: | 1.5 to 1 | 0.8 to 1 | 1.3 to 1 |
| NET POSITION TREND: | |||
| – Strength Index Score (3 Year Range Pct): | 22.6 | 75.5 | 36.9 |
| – Strength Index Reading (3 Year Range): | Bearish | Bullish | Bearish |
| NET POSITION MOVEMENT INDEX: | |||
| – 6-Week Change in Strength Index: | 1.5 | -0.6 | -6.7 |
COCOA Futures:
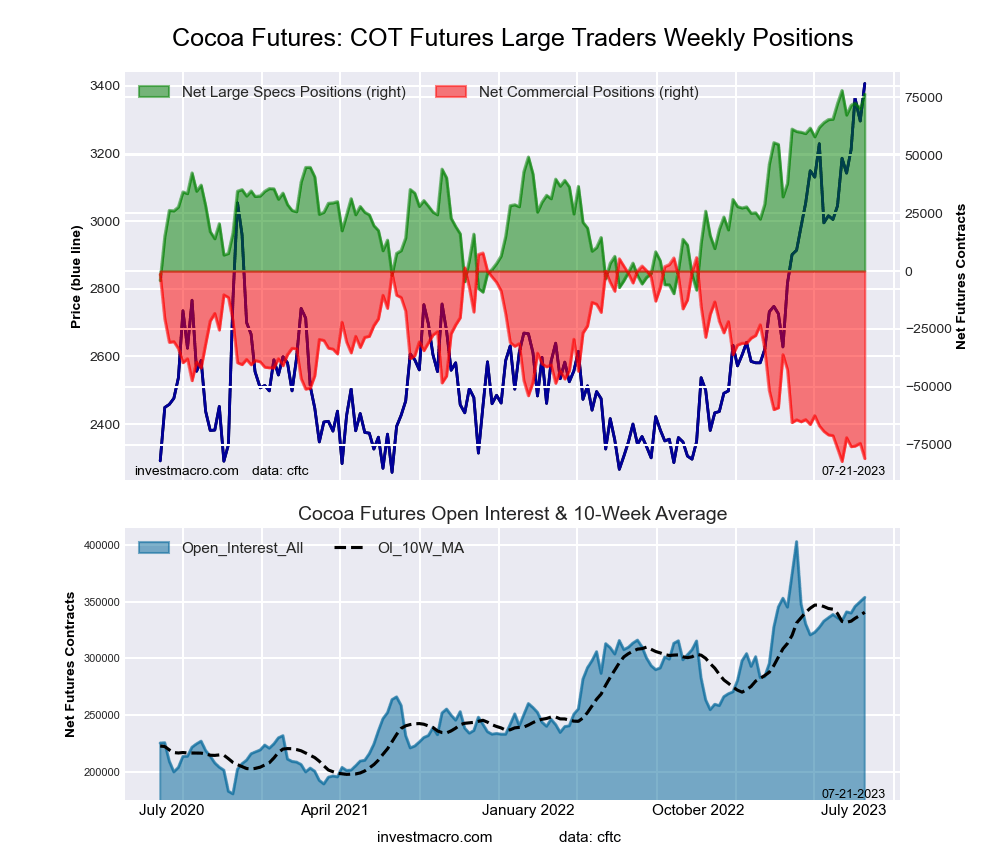 The COCOA large speculator standing this week reached a net position of 76,488 contracts in the data reported through Tuesday. This was a weekly boost of 6,373 contracts from the previous week which had a total of 70,115 net contracts.
This week’s current strength score (the trader positioning range over the past three years, measured from 0 to 100) shows the speculators are currently Bullish-Extreme with a score of 98.3 percent. The commercials are Bearish-Extreme with a score of 1.4 percent and the small traders (not shown in chart) are Bearish with a score of 41.3 percent.
Price Trend-Following Model: Strong Uptrend
Our weekly trend-following model classifies the current market price position as: Strong Uptrend. The current action for the model is considered to be: Hold – Maintain Long Position.
| COCOA Futures Statistics | SPECULATORS | COMMERCIALS | SMALL TRADERS |
| – Percent of Open Interest Longs: | 41.2 | 27.9 | 4.0 |
| – Percent of Open Interest Shorts: | 19.6 | 50.8 | 2.8 |
| – Net Position: | 76,488 | -80,964 | 4,476 |
| – Gross Longs: | 145,705 | 98,622 | 14,265 |
| – Gross Shorts: | 69,217 | 179,586 | 9,789 |
| – Long to Short Ratio: | 2.1 to 1 | 0.5 to 1 | 1.5 to 1 |
| NET POSITION TREND: | |||
| – Strength Index Score (3 Year Range Pct): | 98.3 | 1.4 | 41.3 |
| – Strength Index Reading (3 Year Range): | Bullish-Extreme | Bearish-Extreme | Bearish |
| NET POSITION MOVEMENT INDEX: | |||
| – 6-Week Change in Strength Index: | 4.9 | -4.9 | 1.6 |
WHEAT Futures:
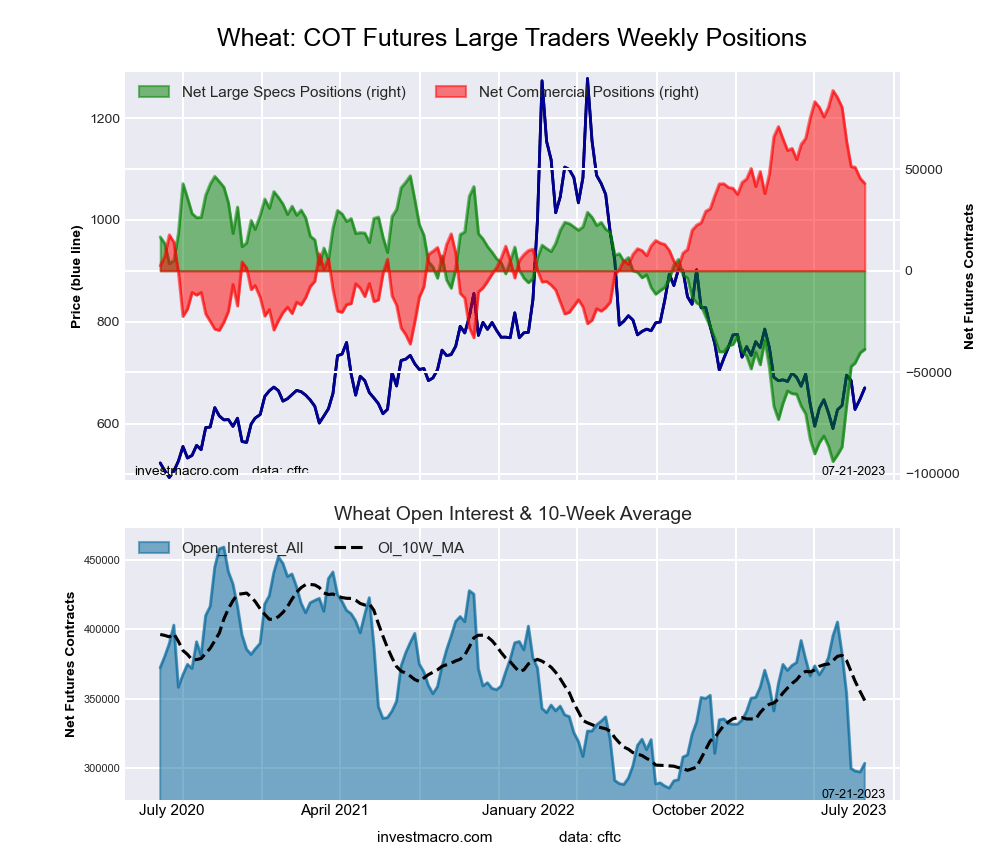 The WHEAT large speculator standing this week reached a net position of -38,703 contracts in the data reported through Tuesday. This was a weekly rise of 1,708 contracts from the previous week which had a total of -40,411 net contracts.
This week’s current strength score (the trader positioning range over the past three years, measured from 0 to 100) shows the speculators are currently Bearish with a score of 39.3 percent. The commercials are Bullish with a score of 63.3 percent and the small traders (not shown in chart) are Bullish with a score of 58.2 percent.
Price Trend-Following Model: Weak Downtrend
Our weekly trend-following model classifies the current market price position as: Weak Downtrend. The current action for the model is considered to be: Hold – Maintain Short Position.
| WHEAT Futures Statistics | SPECULATORS | COMMERCIALS | SMALL TRADERS |
| – Percent of Open Interest Longs: | 28.3 | 39.3 | 9.2 |
| – Percent of Open Interest Shorts: | 41.1 | 25.1 | 10.6 |
| – Net Position: | -38,703 | 43,035 | -4,332 |
| – Gross Longs: | 85,918 | 119,240 | 27,939 |
| – Gross Shorts: | 124,621 | 76,205 | 32,271 |
| – Long to Short Ratio: | 0.7 to 1 | 1.6 to 1 | 0.9 to 1 |
| NET POSITION TREND: | |||
| – Strength Index Score (3 Year Range Pct): | 39.3 | 63.3 | 58.2 |
| – Strength Index Reading (3 Year Range): | Bearish | Bullish | Bullish |
| NET POSITION MOVEMENT INDEX: | |||
| – 6-Week Change in Strength Index: | 36.9 | -33.9 | -33.2 |
Article By InvestMacro – Receive our weekly COT Newsletter
*COT Report: The COT data, released weekly to the public each Friday, is updated through the most recent Tuesday (data is 3 days old) and shows a quick view of how large speculators or non-commercials (for-profit traders) were positioned in the futures markets.
The CFTC categorizes trader positions according to commercial hedgers (traders who use futures contracts for hedging as part of the business), non-commercials (large traders who speculate to realize trading profits) and nonreportable traders (usually small traders/speculators) as well as their open interest (contracts open in the market at time of reporting). See CFTC criteria here.


