By InvestMacro
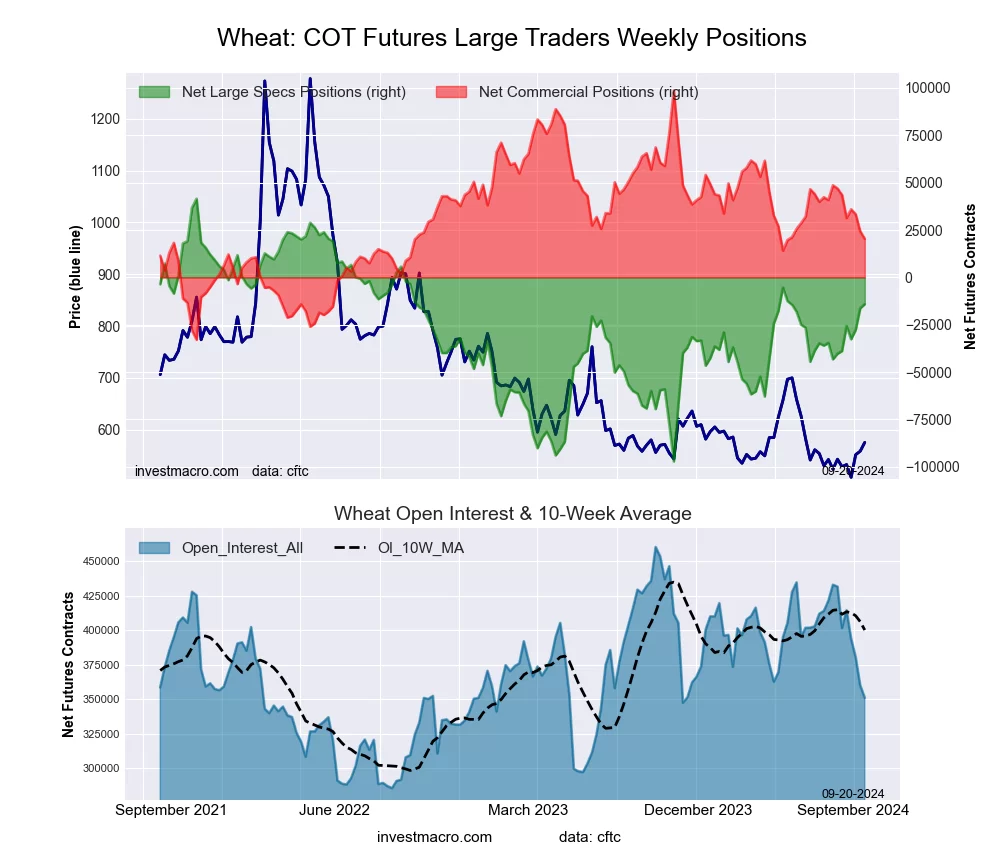
Here are the latest charts and statistics for the Commitment of Traders (COT) data published by the Commodities Futures Trading Commission (CFTC).
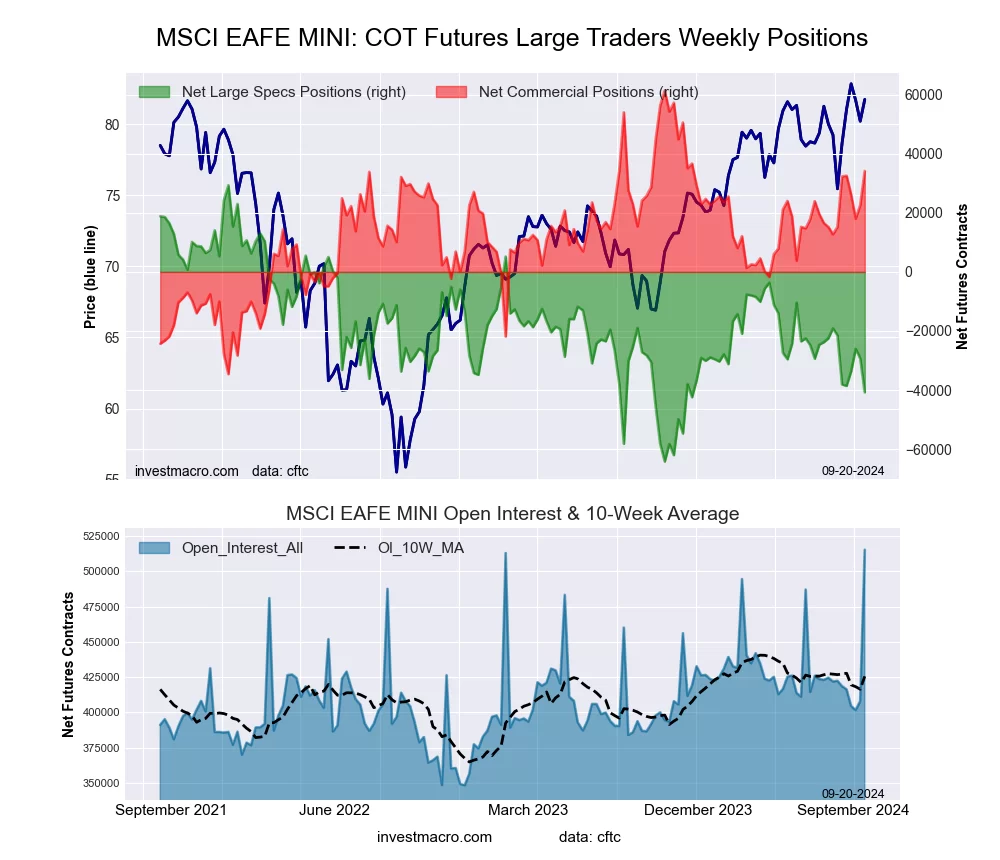
The latest COT data is updated through Tuesday September 17th and shows a quick view of how large market participants (for-profit speculators and commercial traders) were positioned in the futures markets. All currency positions are in direct relation to the US dollar where, for example, a bet for the euro is a bet that the euro will rise versus the dollar while a bet against the euro will be a bet that the euro will decline versus the dollar.
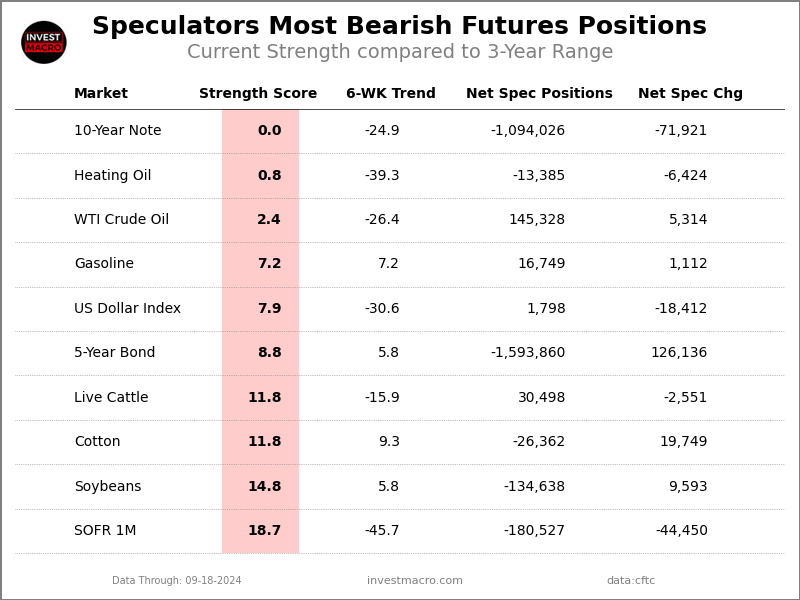
Weekly Speculator Bets led by the Swiss Franc & New Zealand Dollar
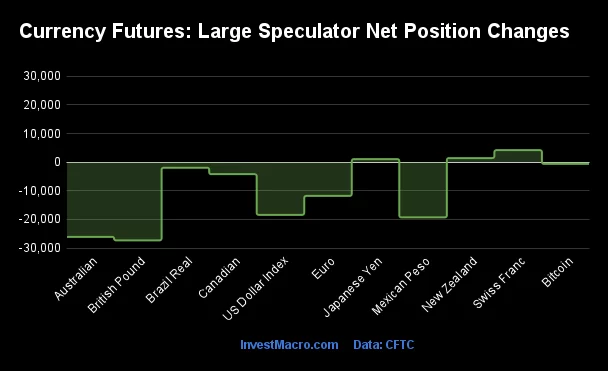
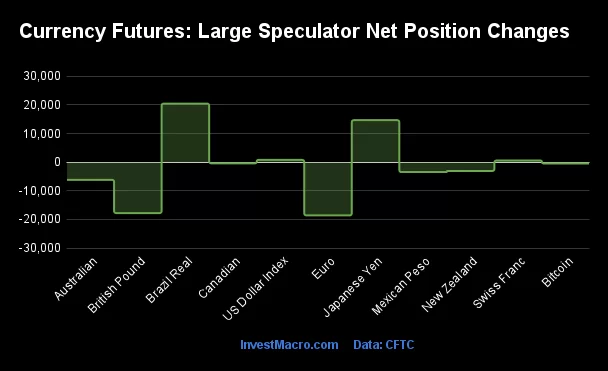
The COT currency market speculator bets were lower this week as just three out of the eleven currency markets we cover had higher positioning while the other eight markets had lower speculator contracts.
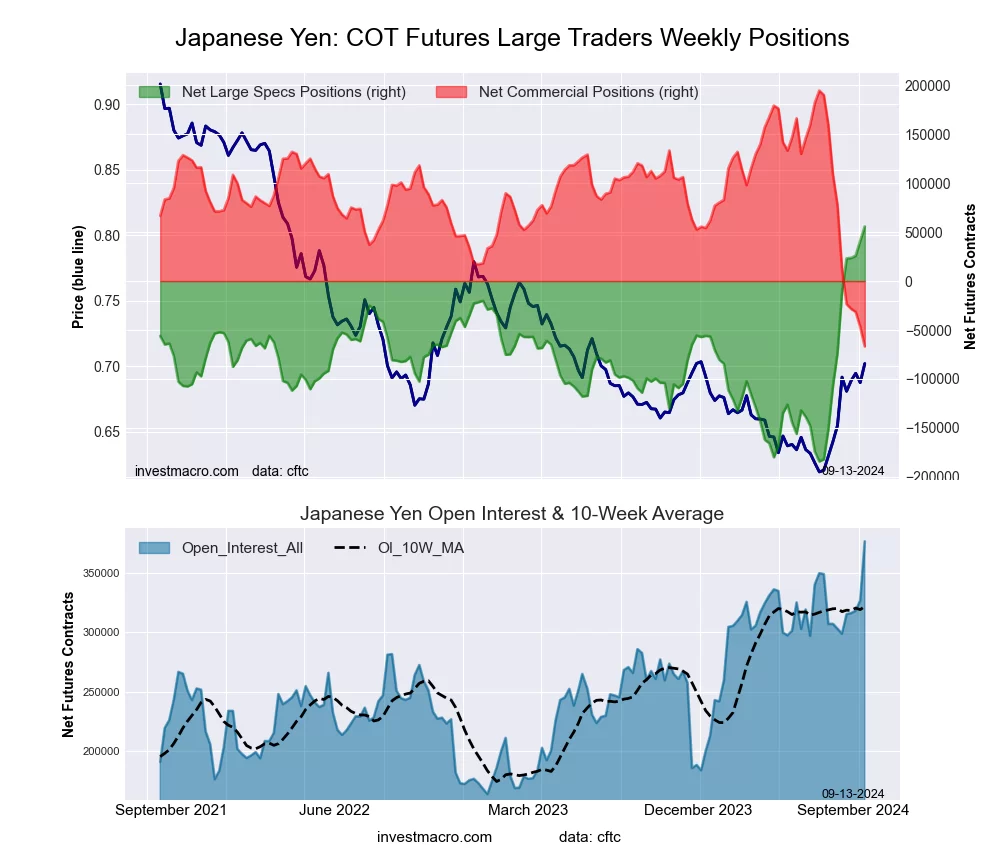
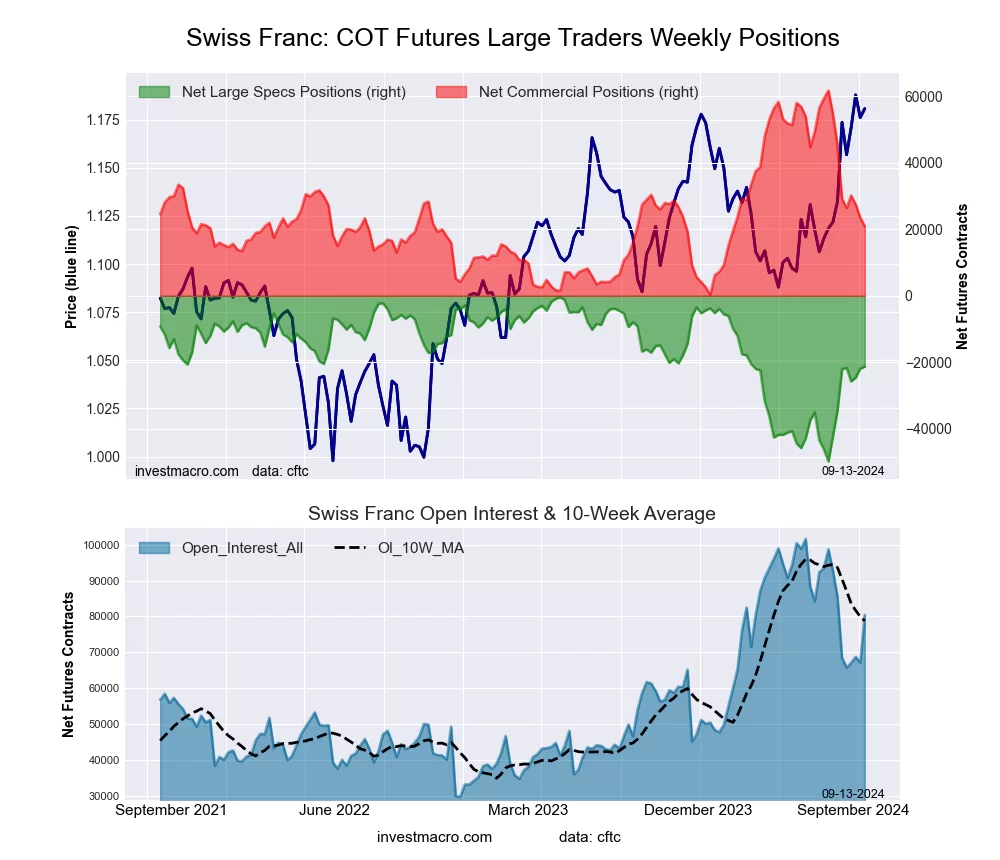
Leading the gains for the currency markets was the Swiss Franc (4,196 contracts) with the New Zealand Dollar (1,425 contracts) and the Japanese Yen (1,070 contracts) also recording positive weeks.
The currencies seeing declines in speculator bets on the week were the British Pound (-27,309 contracts), the Australian Dollar (-26,080 contracts), the Mexican Peso (-19,303 contracts), the US Dollar Index (-18,412 contracts), the EuroFX (-11,787 contracts), the Canadian Dollar (-4,197 contracts), the Brazilian Real (-1,942 contracts) and Bitcoin (-620 contracts) also registering lower bets on the week.
Currency Speculators pared back bets before Fed Interest Rate Reduction
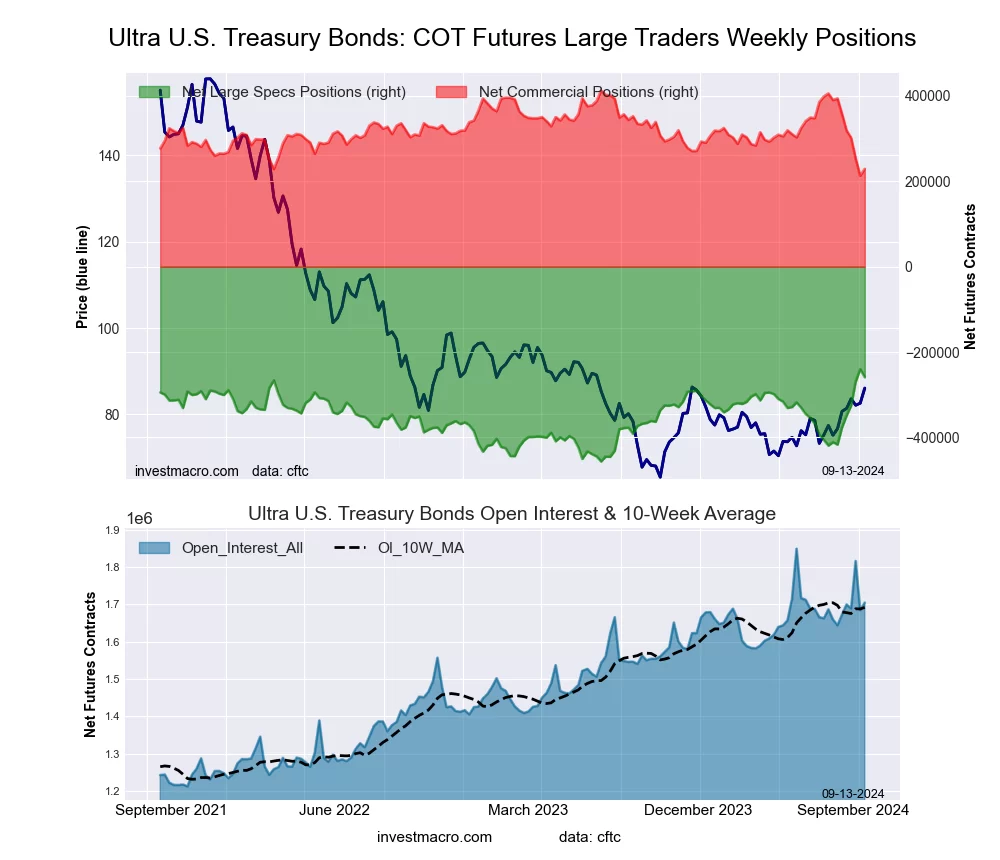
Highlighting the COT data for the week was the sharp pullback in positions for most of the major currencies. The COT data is updated through Tuesday, September 17th which was one day before the Federal Reserve decreased the US interest rate by 50 basis points. The uncertainty of the Fed meeting outcome spurred speculators to reduce their positions and this can be seen by the strong decline in the open interest levels this week. Open interest measures the amount of open positions in the market and a fall in open interest means those positions were closed out or found an offsetting buyer or seller. Many of the major currencies experienced the largest open interest decreases of the year on Tuesday.
Weekly Forex Roundup:
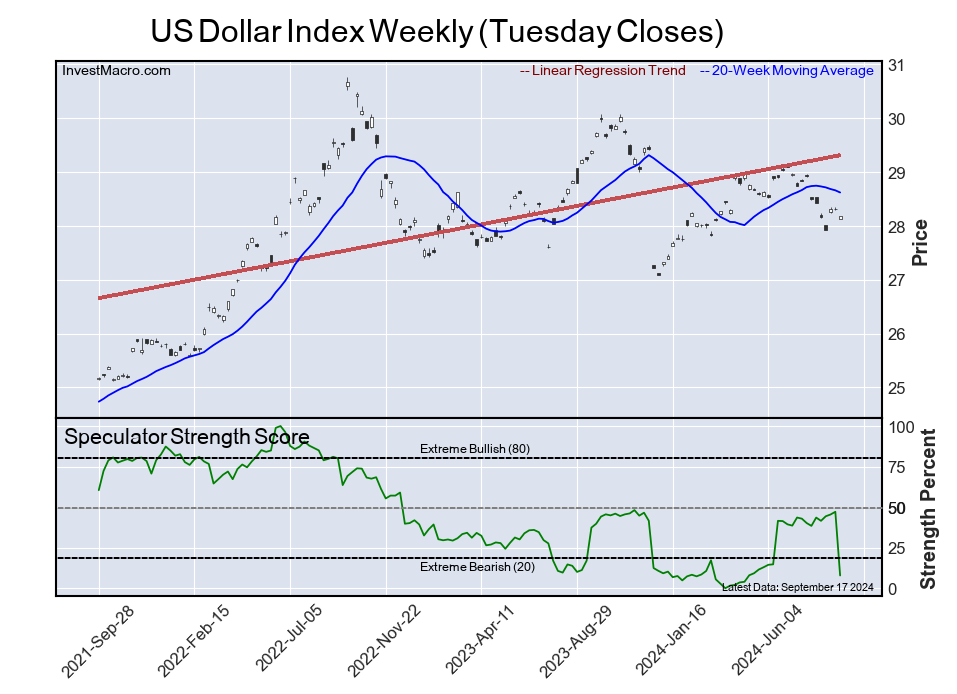
The US dollar index saw the fourth highest weekly decline in speculator bets on record this week with a shortfall by -18,412 contracts. This broke a three-week streak of rising bullish positions and drops the overall bullish level back to just +1,798 contracts – the lowest level since May. The dollar index exchange rate is hovering around the significant level of 100.00 with this week’s close at 100.74 and has decreased in seven out of the past eight weeks.
The Australian dollar speculators dropped their bets by over -26,000 contracts this week to bring the total spec standing to -40,122 contracts. The AUD speculator standing remains bearish but has come off the lows of earlier in the year. The AUD positioning had fallen to a record bearish level in March at a total of -107,538 contracts before turning around. The AUD exchange rate has been bouncing around in a range approximately between 0.60 and 0.70 for the past few years and is currently near the top of that range at 0.6807 this week.
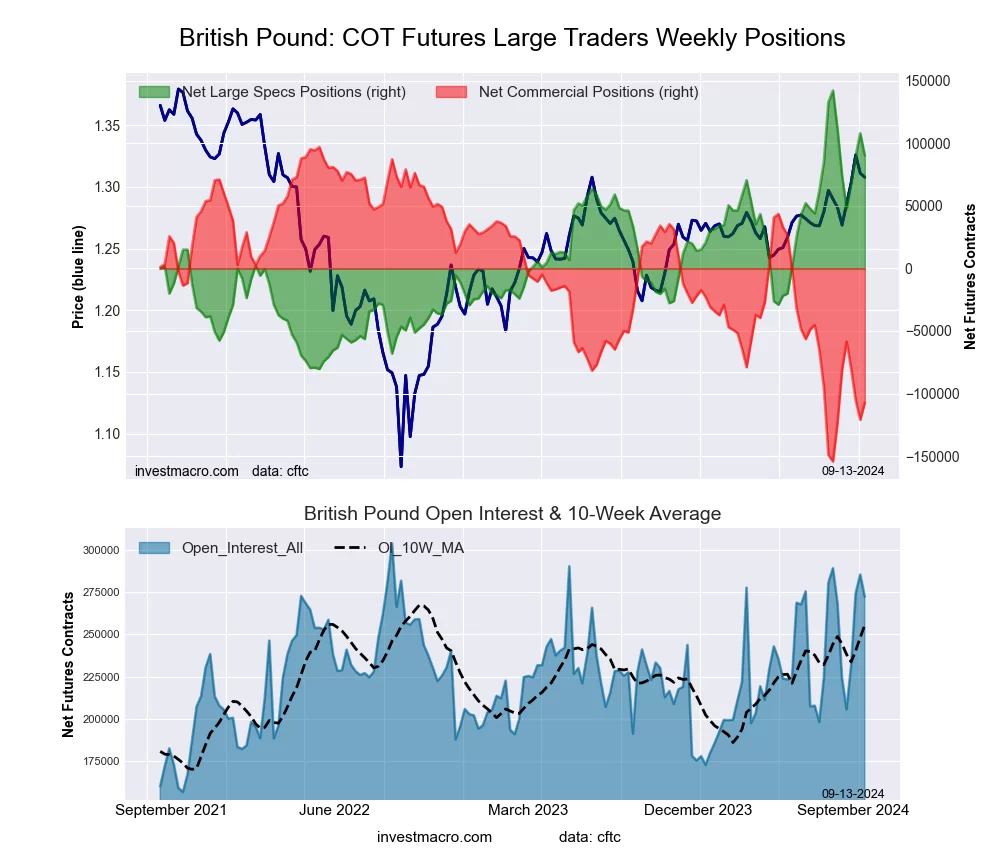
The British pound sterling bets dropped by -27,309 contracts this week following a decline by -17,790 contracts last week. The overall position remains bullish with a total standing of +62,979 contracts this week. The GBP positioning has had a strong bullish tilt this year and hit an all-time record high position in July at a total of +142,183 contracts. The GBP exchange versus the USD has been on the rise as well with the GBP hitting the highest level since 2022 with a close at 1.3322 this week. The GBP is now up over 25 percent from the low-point reached in September of 2022.
The Mexican peso positioning fell sharply this week by over -18,000 contracts. The peso speculator positions have been deteriorating sharply since June and have now fallen for eleven straight weeks through Tuesday. From March 5th to June 11th, the peso spec standing had been over +100,000 contracts in each of those fifteen weeks. Since then, peso bets have declined and now stand at just +7,723 contracts which is the lowest level since March 7th of 2023, a span of eighty weeks. The peso exchange rate has been on the downtrend since hitting an almost decade high in April of this year. The peso has fallen by approximately fifteen percent since the April high and has declined for four out of the past five weeks.
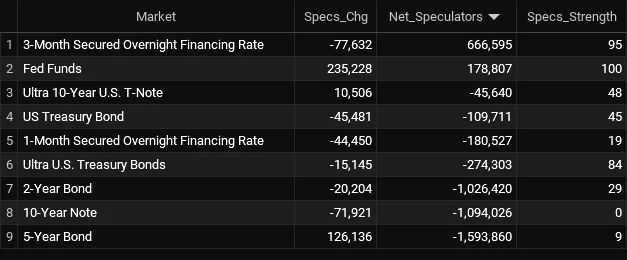
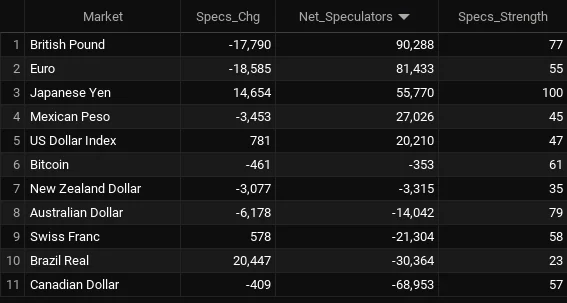
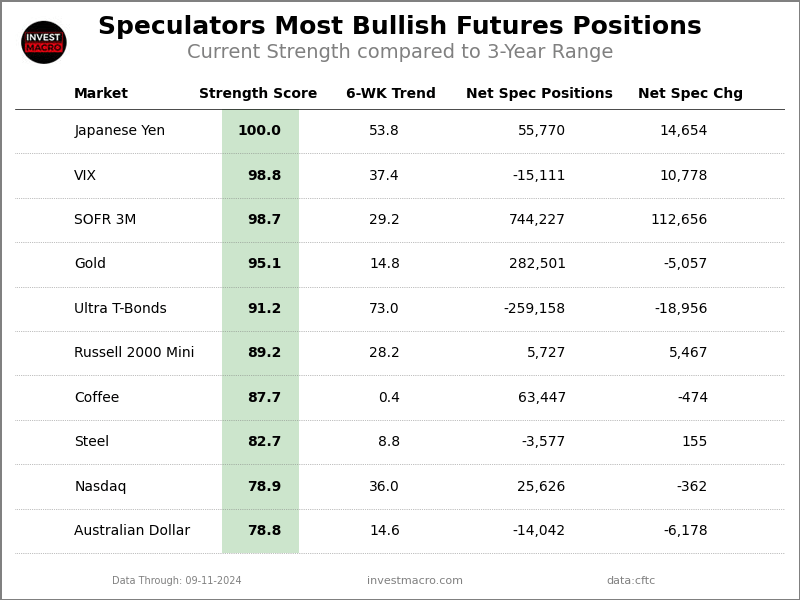
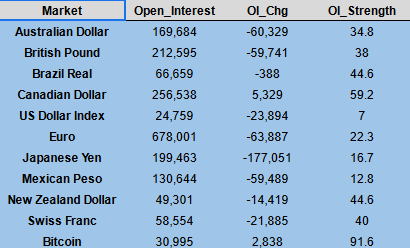
Currencies Net Speculators Leaderboard
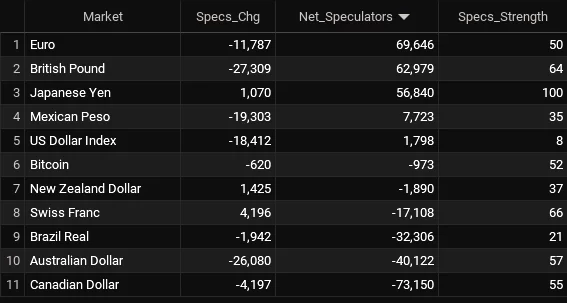
Legend: Weekly Speculators Change | Speculators Current Net Position | Speculators Strength Score compared to last 3-Years (0-100 range)
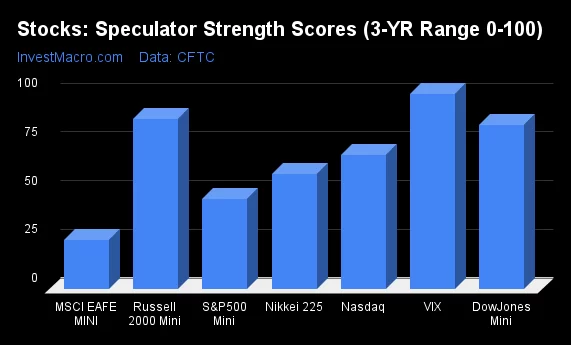
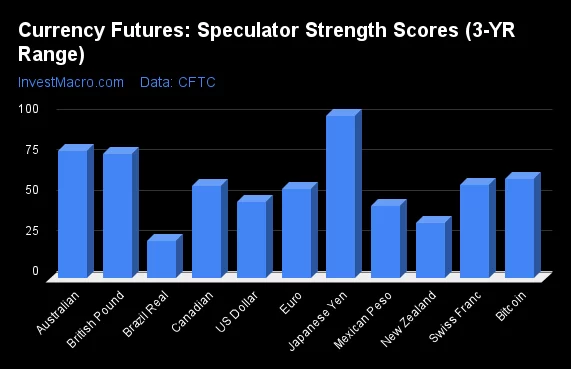
Strength Scores led by the Japanese Yen
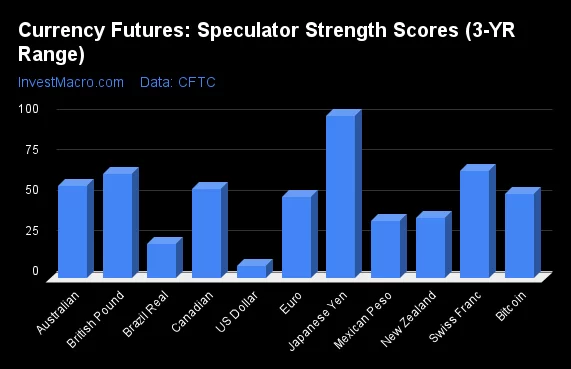
COT Strength Scores (a normalized measure of Speculator positions over a 3-Year range, from 0 to 100 where above 80 is Extreme-Bullish and below 20 is Extreme-Bearish) showed that the Japanese Yen (100 percent) led the currency markets this week. The Swiss Franc (66 percent), the British Pound (64 percent), Australian Dollar (57 percent) and the Canadian Dollar (55 percent) came in as the next highest in the weekly strength scores.
On the downside, the US Dollar Index (8 percent) came in at the lowest strength levels currently and is in Extreme-Bearish territory (below 20 percent). The next lowest strength scores are the Brazilian Real (21 percent), the Mexican Peso (35 percent) and the New Zealand Dollar (37 percent).
Strength Statistics:
US Dollar Index (7.9 percent) vs US Dollar Index previous week (47.1 percent)
EuroFX (50.0 percent) vs EuroFX previous week (55.0 percent)
British Pound Sterling (64.4 percent) vs British Pound Sterling previous week (76.7 percent)
Japanese Yen (100.0 percent) vs Japanese Yen previous week (99.6 percent)
Swiss Franc (66.2 percent) vs Swiss Franc previous week (57.7 percent)
Canadian Dollar (55.2 percent) vs Canadian Dollar previous week (57.1 percent)
Australian Dollar (56.8 percent) vs Australian Dollar previous week (78.8 percent)
New Zealand Dollar (37.3 percent) vs New Zealand Dollar previous week (34.5 percent)
Mexican Peso (35.3 percent) vs Mexican Peso previous week (44.7 percent)
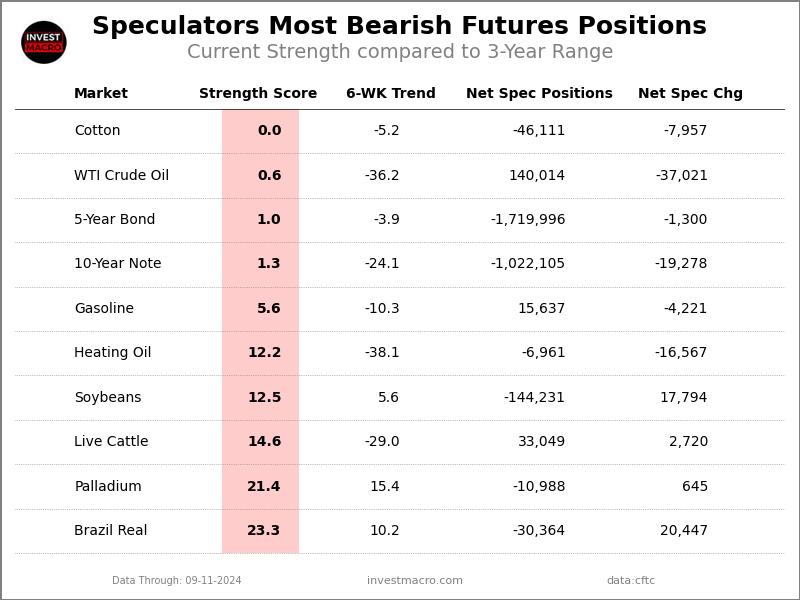
Brazilian Real (21.4 percent) vs Brazilian Real previous week (23.3 percent)
Bitcoin (51.8 percent) vs Bitcoin previous week (61.1 percent)
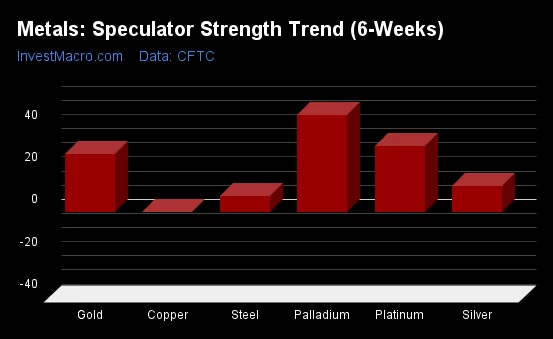
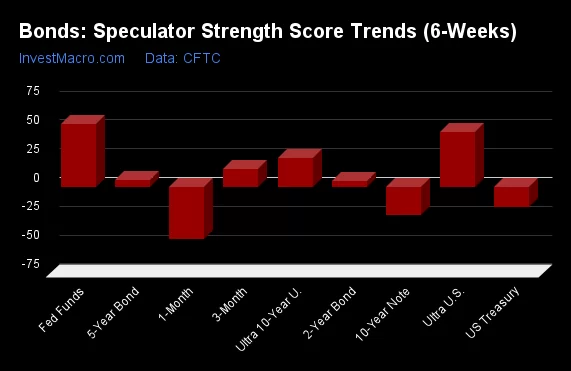
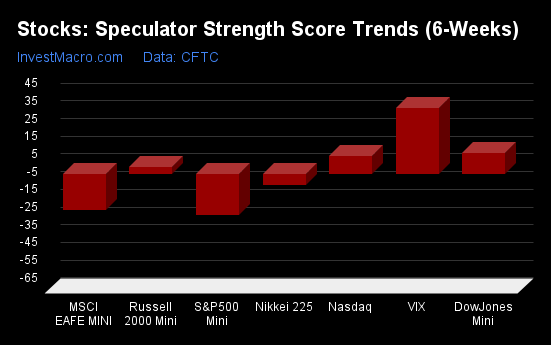
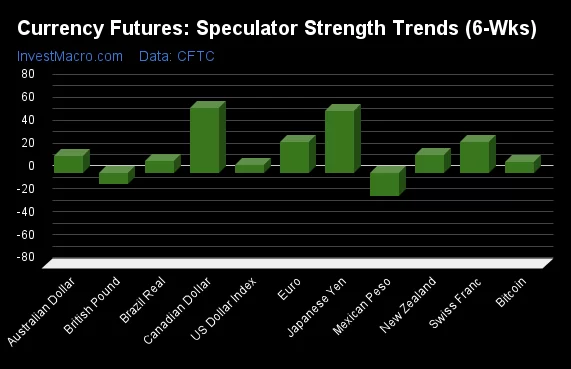
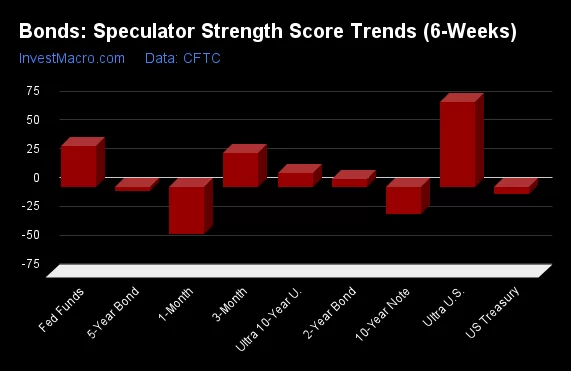
Canadian Dollar & New Zealand Dollar top the 6-Week Strength Trends
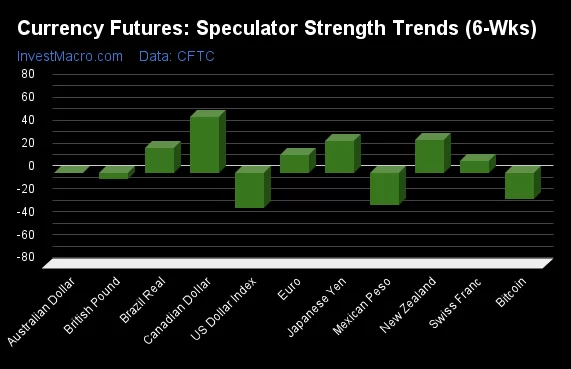
COT Strength Score Trends (or move index, calculates the 6-week changes in strength scores) showed that the Canadian Dollar (49 percent) and the New Zealand Dollar (29 percent) lead the past six weeks trends for the currencies. The Japanese Yen (28 percent), the Brazilian Real (21 percent) and the EuroFX (15 percent) are the next highest positive movers in the latest trends data.
The US Dollar Index (-31 percent) leads the downside trend scores currently with the Mexican Peso (-28 percent), Bitcoin (-23 percent) and the British Pound (-5 percent) following next with lower trend scores.
Strength Trend Statistics:
US Dollar Index (-30.6 percent) vs US Dollar Index previous week (6.9 percent)
EuroFX (15.4 percent) vs EuroFX previous week (27.1 percent)
British Pound Sterling (-5.1 percent) vs British Pound Sterling previous week (-9.5 percent)
Japanese Yen (28.3 percent) vs Japanese Yen previous week (53.6 percent)
Swiss Franc (10.1 percent) vs Swiss Franc previous week (26.8 percent)
Canadian Dollar (48.6 percent) vs Canadian Dollar previous week (57.1 percent)
Australian Dollar (0.1 percent) vs Australian Dollar previous week (14.6 percent)
New Zealand Dollar (28.6 percent) vs New Zealand Dollar previous week (15.6 percent)
Mexican Peso (-28.3 percent) vs Mexican Peso previous week (-19.9 percent)
Brazilian Real (21.4 percent) vs Brazilian Real previous week (10.2 percent)
Bitcoin (-22.7 percent) vs Bitcoin previous week (9.8 percent)
Individual COT Forex Markets:
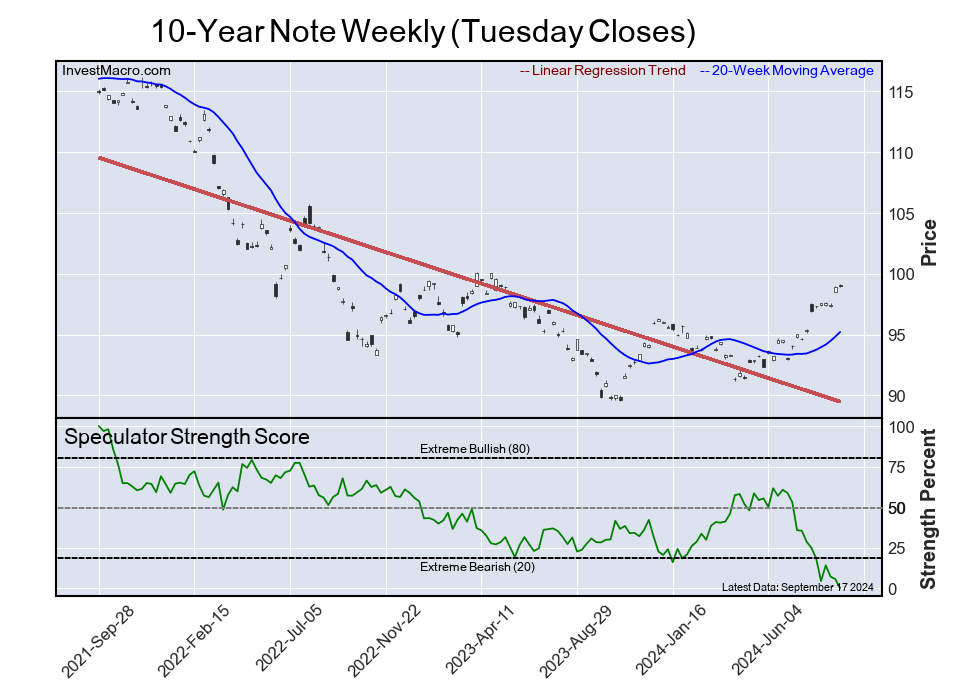
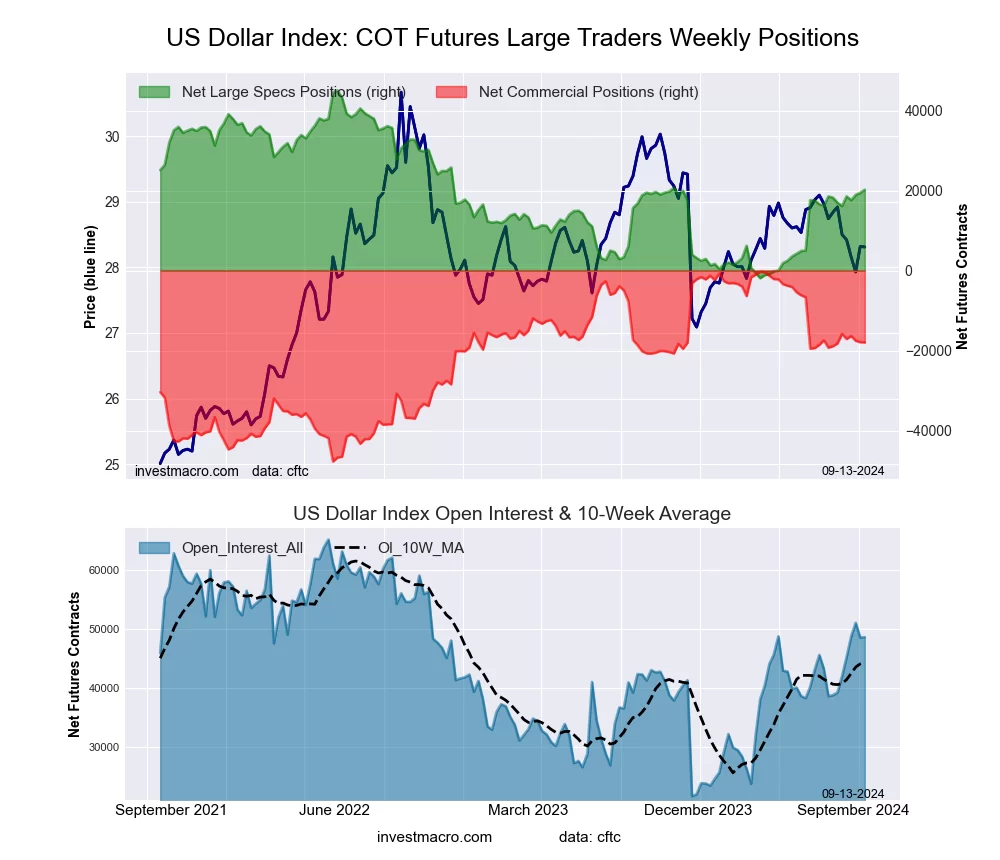
US Dollar Index Futures:
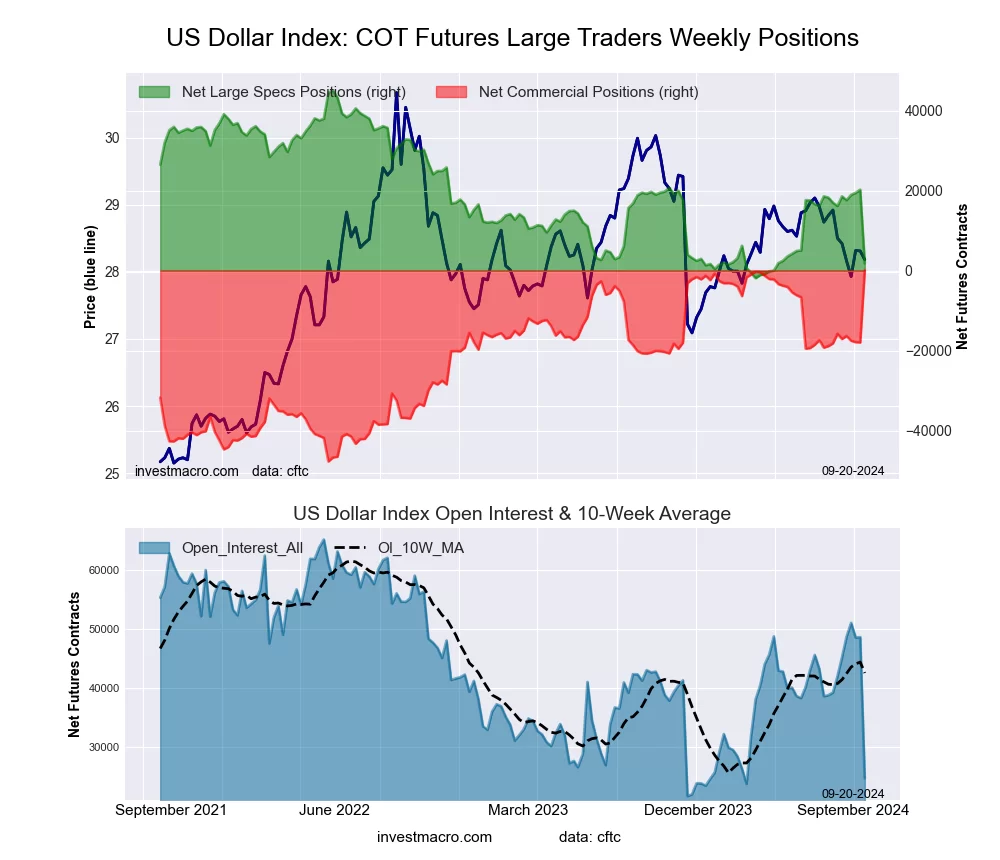 The US Dollar Index large speculator standing this week came in at a net position of 1,798 contracts in the data reported through Tuesday. This was a weekly fall of -18,412 contracts from the previous week which had a total of 20,210 net contracts.
This week’s current strength score (the trader positioning range over the past three years, measured from 0 to 100) shows the speculators are currently Bearish-Extreme with a score of 7.9 percent. The commercials are Bullish-Extreme with a score of 100.0 percent and the small traders (not shown in chart) are Bearish-Extreme with a score of 3.5 percent.
Price Trend-Following Model: Strong Downtrend
Our weekly trend-following model classifies the current market price position as: Strong Downtrend. The current action for the model is considered to be: Hold – Maintain Short Position.
| US DOLLAR INDEX Statistics | SPECULATORS | COMMERCIALS | SMALL TRADERS |
| – Percent of Open Interest Longs: | 64.2 | 22.0 | 7.8 |
| – Percent of Open Interest Shorts: | 56.9 | 21.6 | 15.4 |
| – Net Position: | 1,798 | 83 | -1,881 |
| – Gross Longs: | 15,897 | 5,438 | 1,935 |
| – Gross Shorts: | 14,099 | 5,355 | 3,816 |
| – Long to Short Ratio: | 1.1 to 1 | 1.0 to 1 | 0.5 to 1 |
| NET POSITION TREND: | |||
| – Strength Index Score (3 Year Range Pct): | 7.9 | 100.0 | 3.5 |
| – Strength Index Reading (3 Year Range): | Bearish-Extreme | Bullish-Extreme | Bearish-Extreme |
| NET POSITION MOVEMENT INDEX: | |||
| – 6-Week Change in Strength Index: | -30.6 | 33.3 | -15.9 |
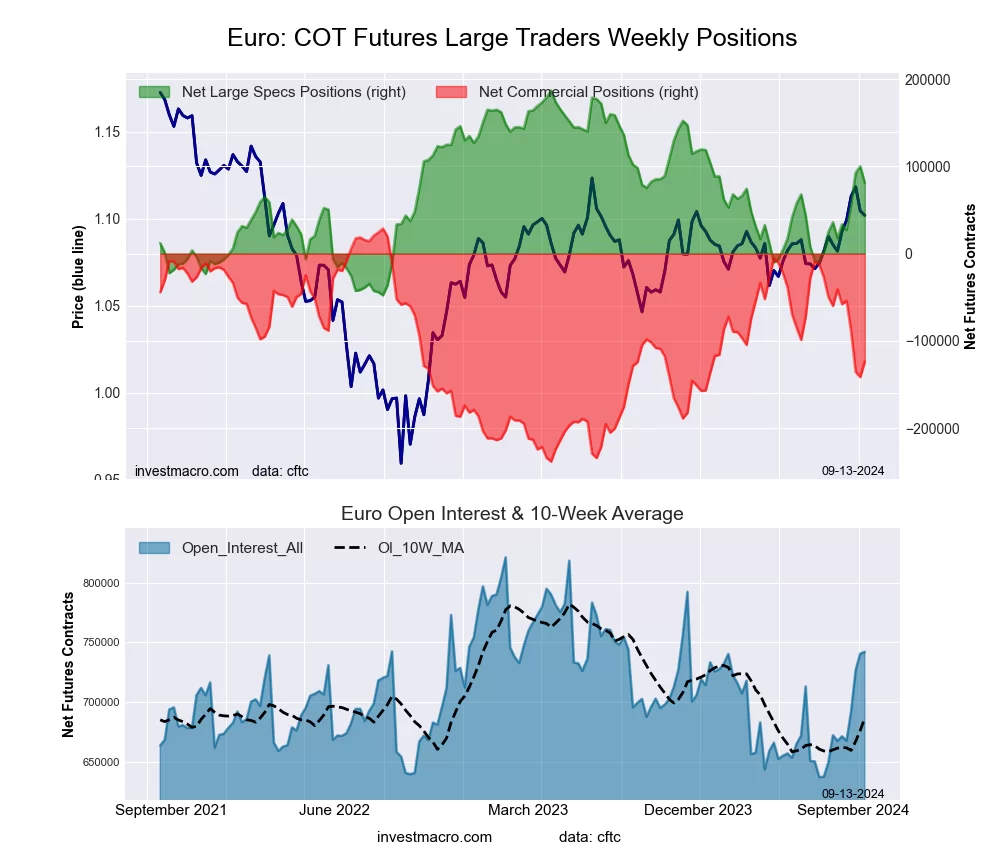
Euro Currency Futures:
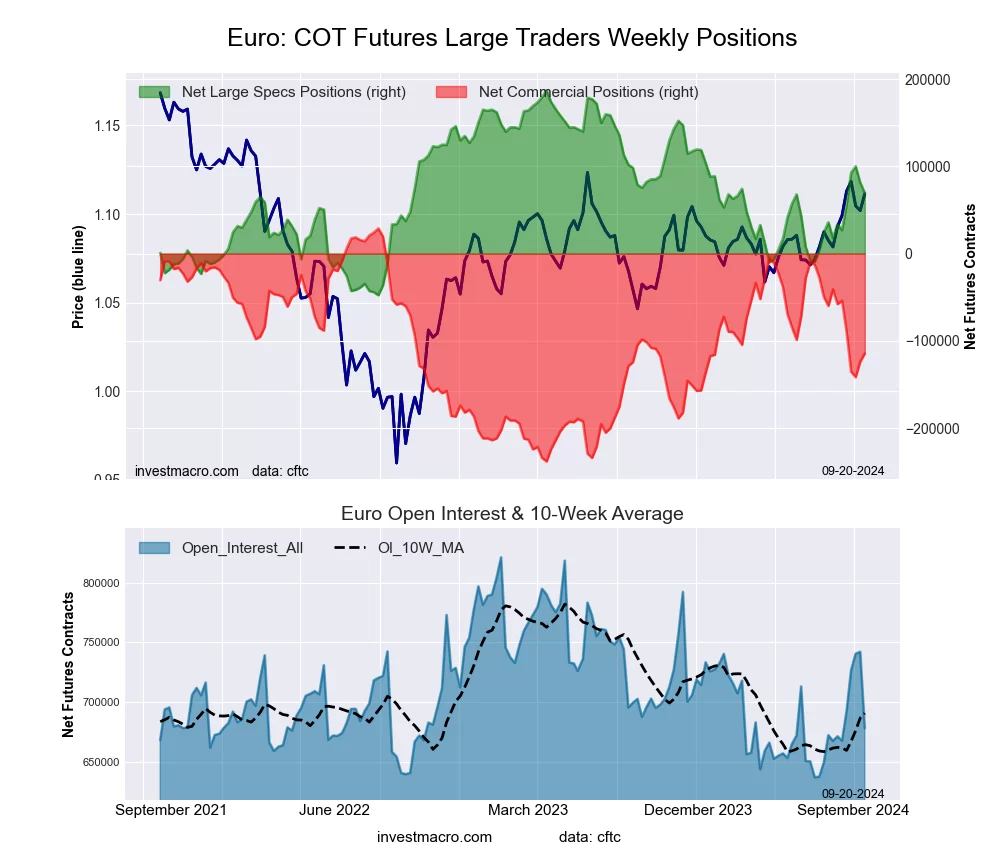 The Euro Currency large speculator standing this week came in at a net position of 69,646 contracts in the data reported through Tuesday. This was a weekly fall of -11,787 contracts from the previous week which had a total of 81,433 net contracts.
This week’s current strength score (the trader positioning range over the past three years, measured from 0 to 100) shows the speculators are currently Bearish with a score of 50.0 percent. The commercials are Bearish with a score of 46.4 percent and the small traders (not shown in chart) are Bullish with a score of 72.0 percent.
Price Trend-Following Model: Strong Uptrend
Our weekly trend-following model classifies the current market price position as: Strong Uptrend. The current action for the model is considered to be: Hold – Maintain Long Position.
| EURO Currency Statistics | SPECULATORS | COMMERCIALS | SMALL TRADERS |
| – Percent of Open Interest Longs: | 26.9 | 57.0 | 12.8 |
| – Percent of Open Interest Shorts: | 16.6 | 73.9 | 6.2 |
| – Net Position: | 69,646 | -114,402 | 44,756 |
| – Gross Longs: | 182,281 | 386,396 | 86,454 |
| – Gross Shorts: | 112,635 | 500,798 | 41,698 |
| – Long to Short Ratio: | 1.6 to 1 | 0.8 to 1 | 2.1 to 1 |
| NET POSITION TREND: | |||
| – Strength Index Score (3 Year Range Pct): | 50.0 | 46.4 | 72.0 |
| – Strength Index Reading (3 Year Range): | Bearish | Bearish | Bullish |
| NET POSITION MOVEMENT INDEX: | |||
| – 6-Week Change in Strength Index: | 15.4 | -21.2 | 46.7 |
British Pound Sterling Futures:
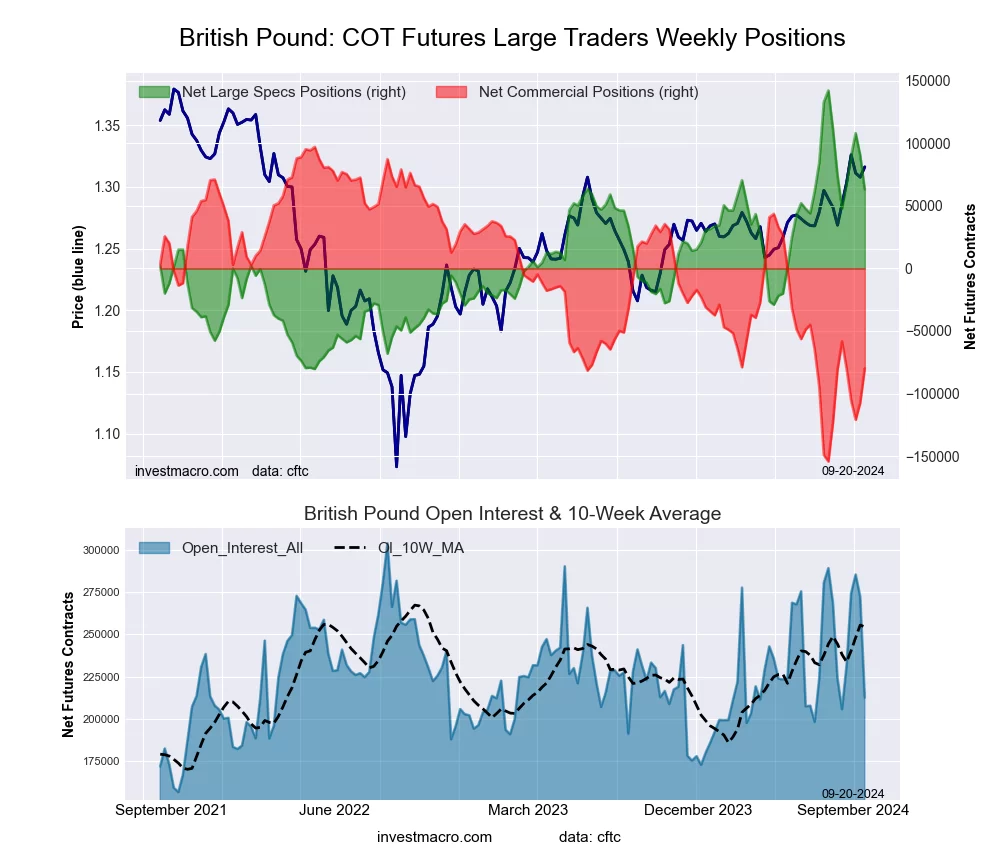 The British Pound Sterling large speculator standing this week came in at a net position of 62,979 contracts in the data reported through Tuesday. This was a weekly lowering of -27,309 contracts from the previous week which had a total of 90,288 net contracts.
This week’s current strength score (the trader positioning range over the past three years, measured from 0 to 100) shows the speculators are currently Bullish with a score of 64.4 percent. The commercials are Bearish with a score of 29.7 percent and the small traders (not shown in chart) are Bullish-Extreme with a score of 97.4 percent.
Price Trend-Following Model: Strong Uptrend
Our weekly trend-following model classifies the current market price position as: Strong Uptrend. The current action for the model is considered to be: Hold – Maintain Long Position.
| BRITISH POUND Statistics | SPECULATORS | COMMERCIALS | SMALL TRADERS |
| – Percent of Open Interest Longs: | 58.7 | 22.4 | 17.8 |
| – Percent of Open Interest Shorts: | 29.1 | 59.9 | 9.9 |
| – Net Position: | 62,979 | -79,751 | 16,772 |
| – Gross Longs: | 124,822 | 47,645 | 37,880 |
| – Gross Shorts: | 61,843 | 127,396 | 21,108 |
| – Long to Short Ratio: | 2.0 to 1 | 0.4 to 1 | 1.8 to 1 |
| NET POSITION TREND: | |||
| – Strength Index Score (3 Year Range Pct): | 64.4 | 29.7 | 97.4 |
| – Strength Index Reading (3 Year Range): | Bullish | Bearish | Bullish-Extreme |
| NET POSITION MOVEMENT INDEX: | |||
| – 6-Week Change in Strength Index: | -5.1 | 0.5 | 21.2 |
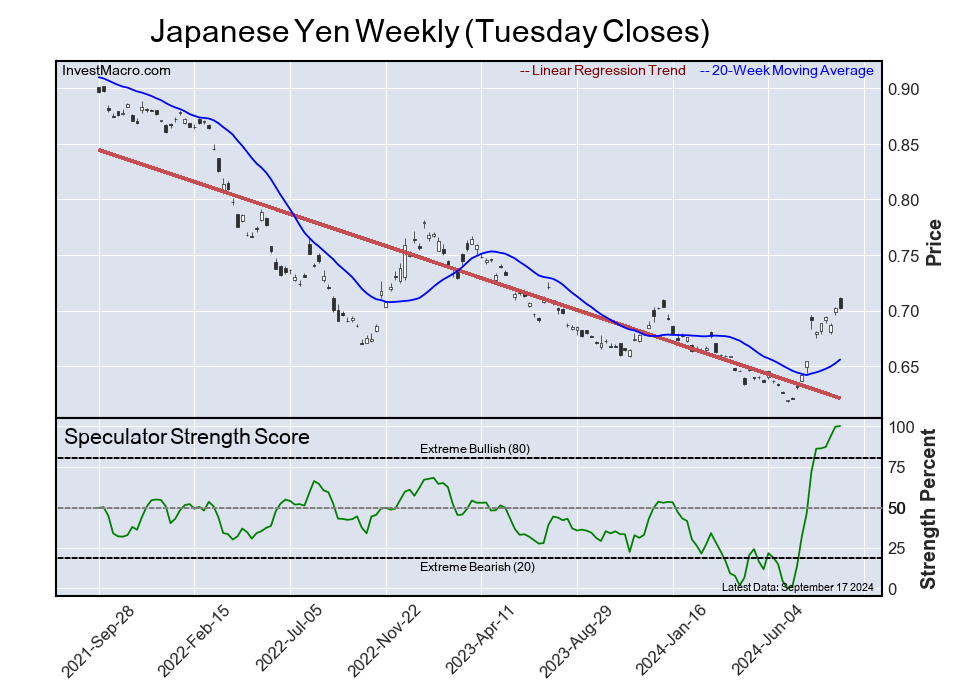
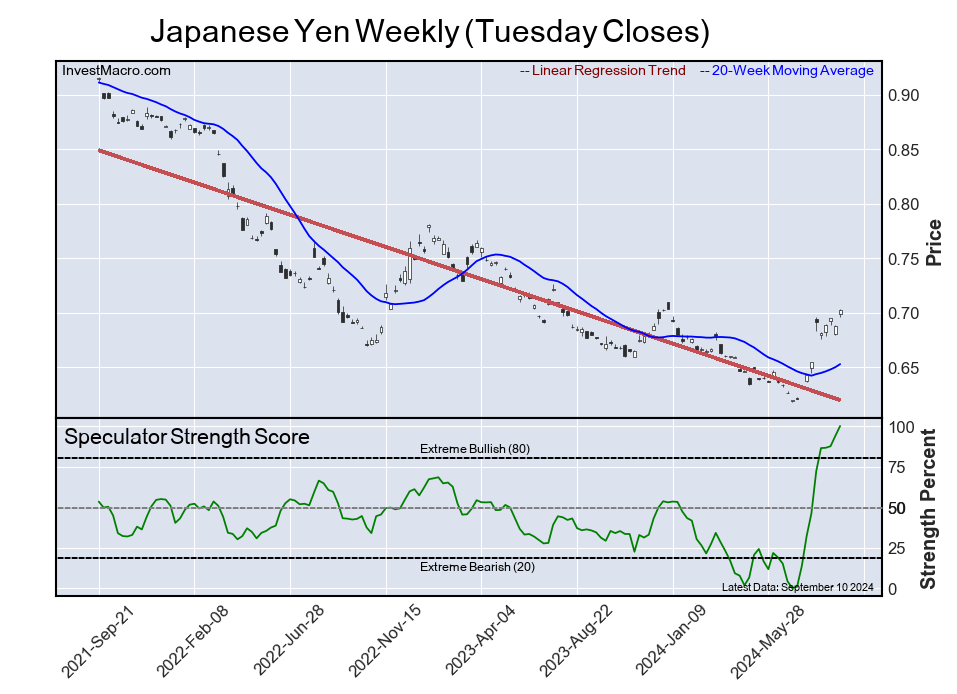
Japanese Yen Futures:
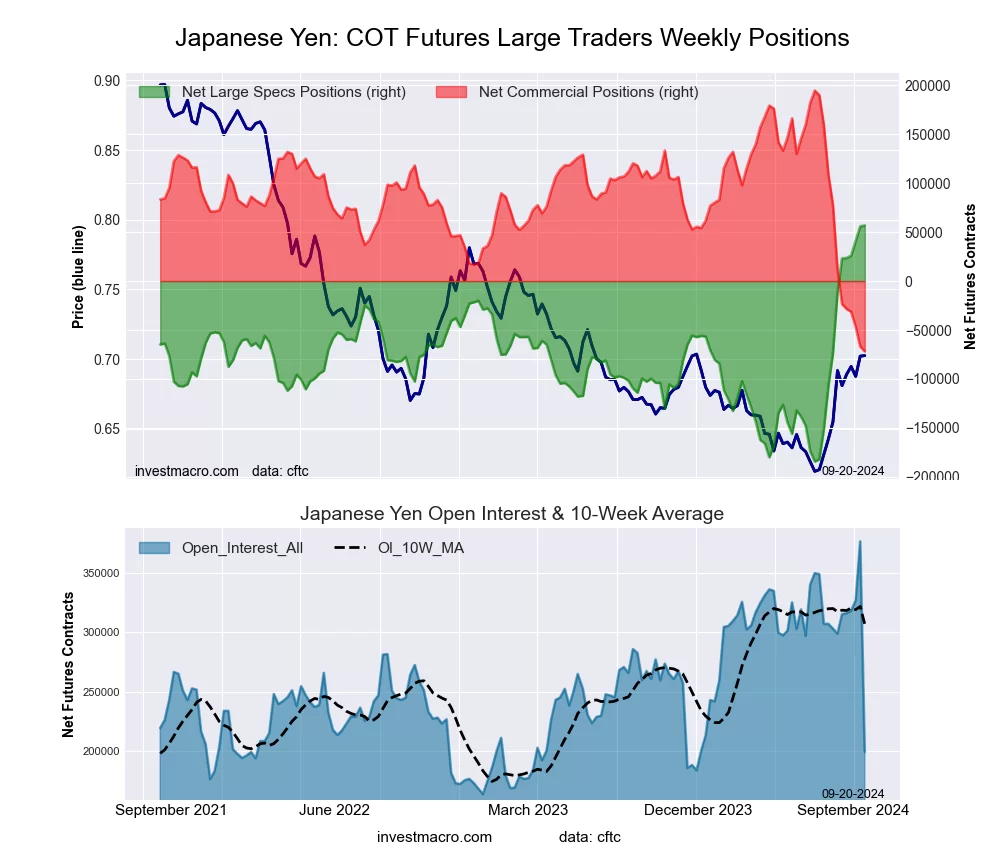 The Japanese Yen large speculator standing this week came in at a net position of 56,840 contracts in the data reported through Tuesday. This was a weekly advance of 1,070 contracts from the previous week which had a total of 55,770 net contracts.
This week’s current strength score (the trader positioning range over the past three years, measured from 0 to 100) shows the speculators are currently Bullish-Extreme with a score of 100.0 percent. The commercials are Bearish-Extreme with a score of 0.0 percent and the small traders (not shown in chart) are Bullish-Extreme with a score of 100.0 percent.
Price Trend-Following Model: Strong Uptrend
Our weekly trend-following model classifies the current market price position as: Strong Uptrend. The current action for the model is considered to be: Hold – Maintain Long Position.
| JAPANESE YEN Statistics | SPECULATORS | COMMERCIALS | SMALL TRADERS |
| – Percent of Open Interest Longs: | 48.8 | 28.5 | 21.3 |
| – Percent of Open Interest Shorts: | 20.3 | 64.6 | 13.8 |
| – Net Position: | 56,840 | -71,839 | 14,999 |
| – Gross Longs: | 97,332 | 56,915 | 42,545 |
| – Gross Shorts: | 40,492 | 128,754 | 27,546 |
| – Long to Short Ratio: | 2.4 to 1 | 0.4 to 1 | 1.5 to 1 |
| NET POSITION TREND: | |||
| – Strength Index Score (3 Year Range Pct): | 100.0 | 0.0 | 100.0 |
| – Strength Index Reading (3 Year Range): | Bullish-Extreme | Bearish-Extreme | Bullish-Extreme |
| NET POSITION MOVEMENT INDEX: | |||
| – 6-Week Change in Strength Index: | 28.3 | -31.5 | 38.3 |
Swiss Franc Futures:
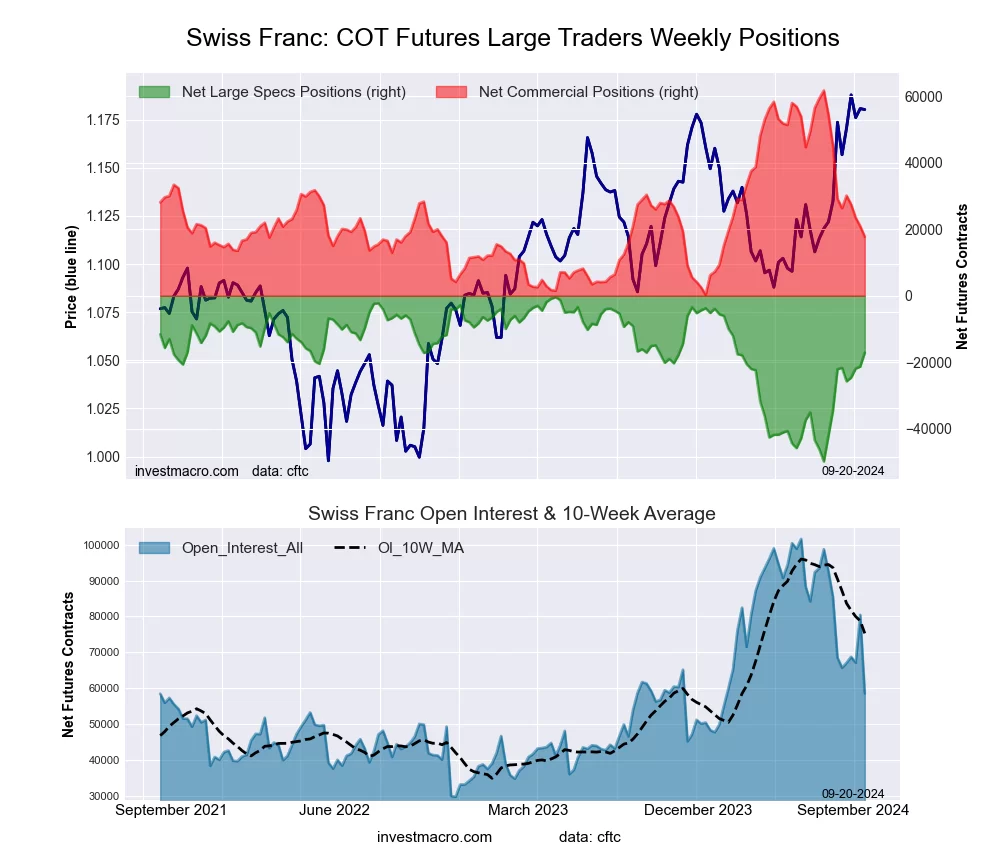 The Swiss Franc large speculator standing this week came in at a net position of -17,108 contracts in the data reported through Tuesday. This was a weekly rise of 4,196 contracts from the previous week which had a total of -21,304 net contracts.
This week’s current strength score (the trader positioning range over the past three years, measured from 0 to 100) shows the speculators are currently Bullish with a score of 66.2 percent. The commercials are Bearish with a score of 28.4 percent and the small traders (not shown in chart) are Bullish with a score of 74.4 percent.
Price Trend-Following Model: Uptrend
Our weekly trend-following model classifies the current market price position as: Uptrend. The current action for the model is considered to be: Hold – Maintain Long Position.
| SWISS FRANC Statistics | SPECULATORS | COMMERCIALS | SMALL TRADERS |
| – Percent of Open Interest Longs: | 14.7 | 59.7 | 24.6 |
| – Percent of Open Interest Shorts: | 43.9 | 29.5 | 25.6 |
| – Net Position: | -17,108 | 17,728 | -620 |
| – Gross Longs: | 8,579 | 34,982 | 14,395 |
| – Gross Shorts: | 25,687 | 17,254 | 15,015 |
| – Long to Short Ratio: | 0.3 to 1 | 2.0 to 1 | 1.0 to 1 |
| NET POSITION TREND: | |||
| – Strength Index Score (3 Year Range Pct): | 66.2 | 28.4 | 74.4 |
| – Strength Index Reading (3 Year Range): | Bullish | Bearish | Bullish |
| NET POSITION MOVEMENT INDEX: | |||
| – 6-Week Change in Strength Index: | 10.1 | -18.6 | 29.3 |
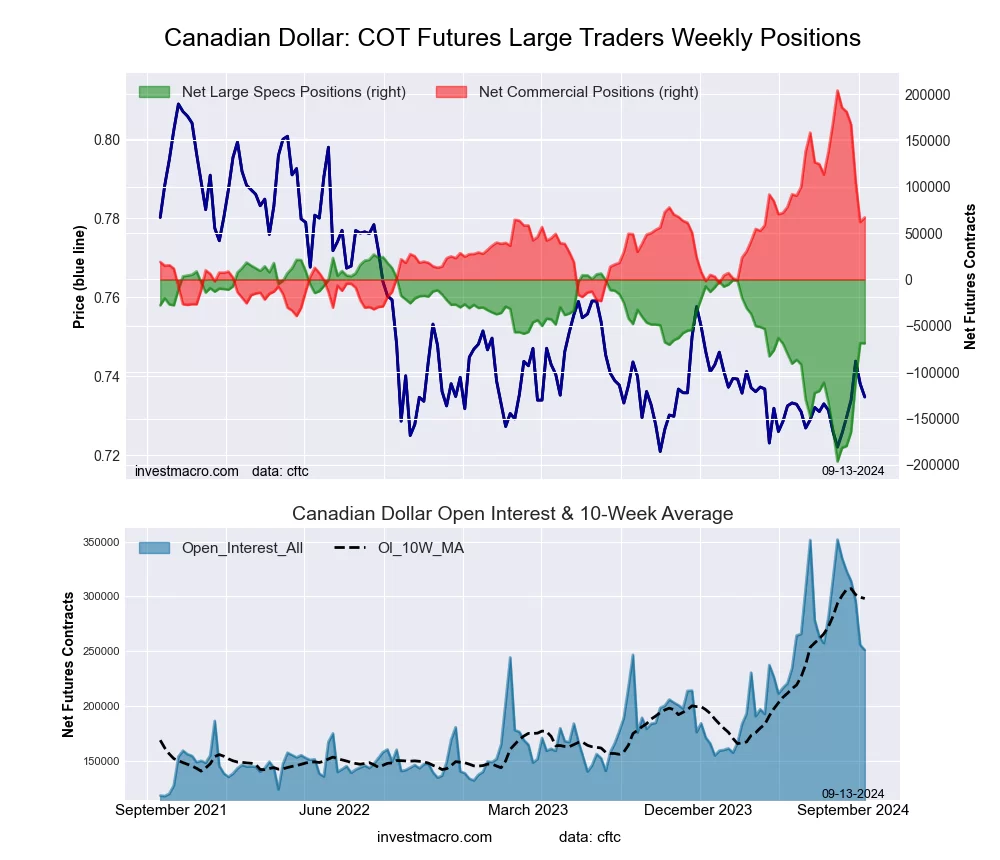
Canadian Dollar Futures:
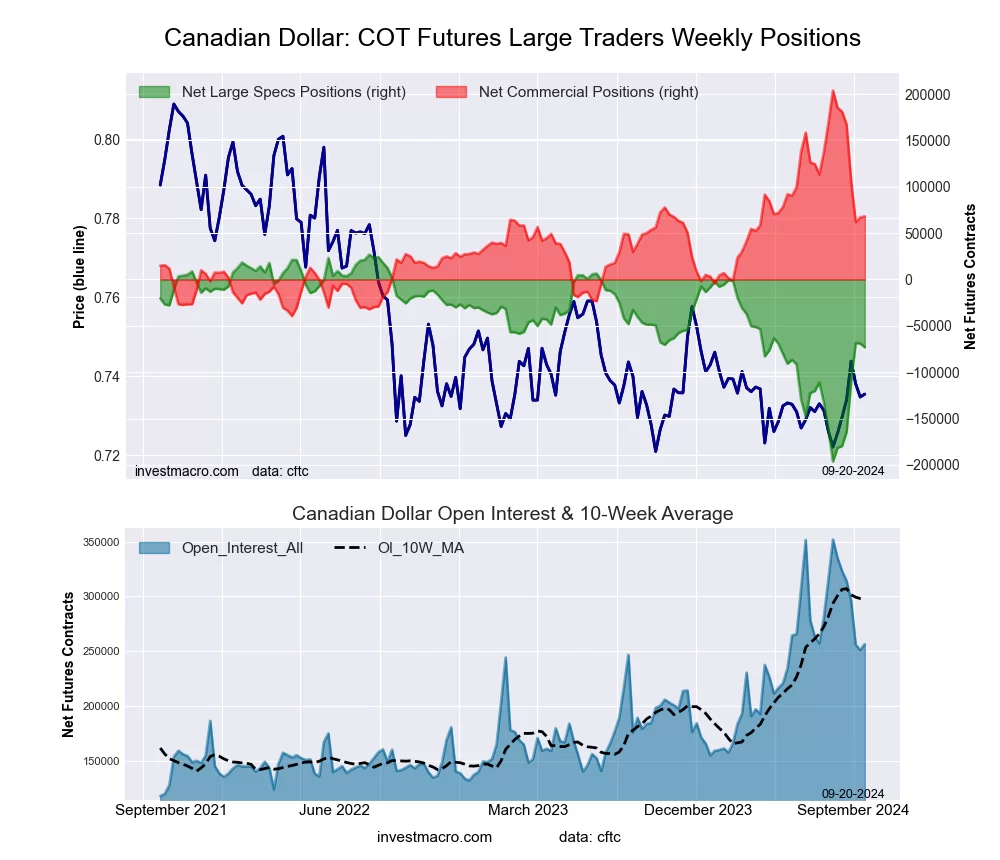 The Canadian Dollar large speculator standing this week came in at a net position of -73,150 contracts in the data reported through Tuesday. This was a weekly decline of -4,197 contracts from the previous week which had a total of -68,953 net contracts.
This week’s current strength score (the trader positioning range over the past three years, measured from 0 to 100) shows the speculators are currently Bullish with a score of 55.2 percent. The commercials are Bearish with a score of 44.2 percent and the small traders (not shown in chart) are Bearish with a score of 45.8 percent.
Price Trend-Following Model: Strong Uptrend
Our weekly trend-following model classifies the current market price position as: Strong Uptrend. The current action for the model is considered to be: Hold – Maintain Long Position.
| CANADIAN DOLLAR Statistics | SPECULATORS | COMMERCIALS | SMALL TRADERS |
| – Percent of Open Interest Longs: | 8.4 | 77.1 | 12.6 |
| – Percent of Open Interest Shorts: | 36.9 | 50.6 | 10.6 |
| – Net Position: | -73,150 | 68,061 | 5,089 |
| – Gross Longs: | 21,464 | 197,838 | 32,218 |
| – Gross Shorts: | 94,614 | 129,777 | 27,129 |
| – Long to Short Ratio: | 0.2 to 1 | 1.5 to 1 | 1.2 to 1 |
| NET POSITION TREND: | |||
| – Strength Index Score (3 Year Range Pct): | 55.2 | 44.2 | 45.8 |
| – Strength Index Reading (3 Year Range): | Bullish | Bearish | Bearish |
| NET POSITION MOVEMENT INDEX: | |||
| – 6-Week Change in Strength Index: | 48.6 | -48.3 | 26.2 |
Australian Dollar Futures:
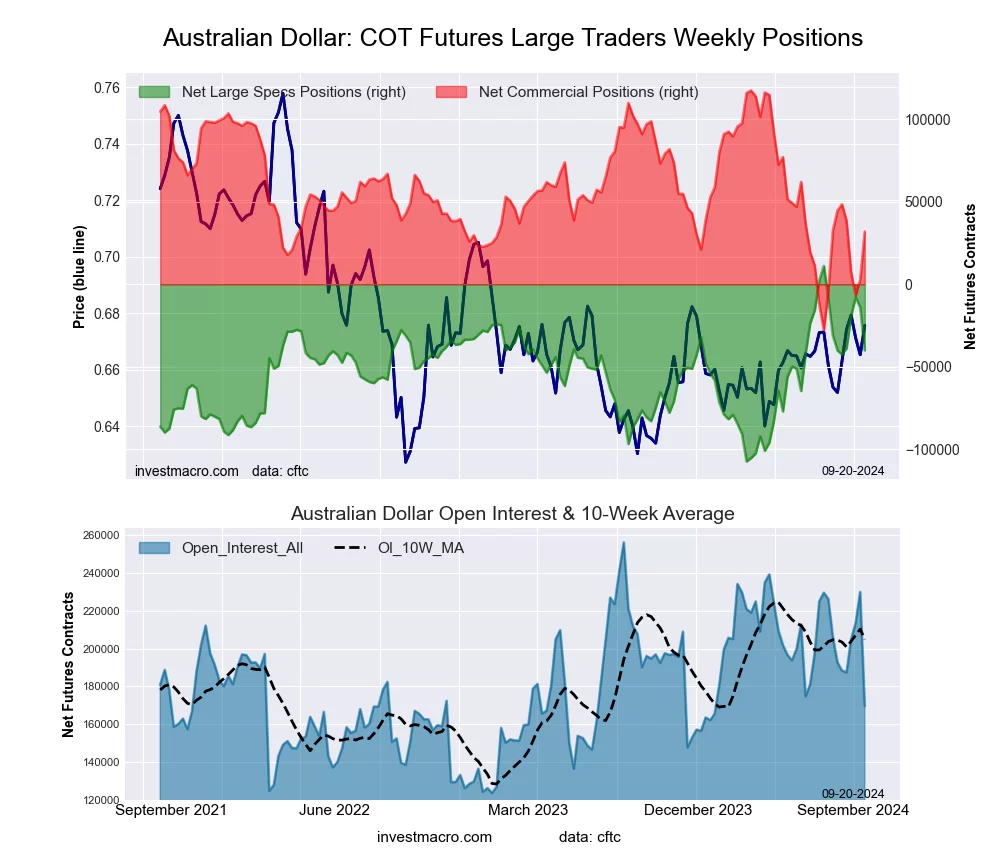 The Australian Dollar large speculator standing this week came in at a net position of -40,122 contracts in the data reported through Tuesday. This was a weekly fall of -26,080 contracts from the previous week which had a total of -14,042 net contracts.
This week’s current strength score (the trader positioning range over the past three years, measured from 0 to 100) shows the speculators are currently Bullish with a score of 56.8 percent. The commercials are Bearish with a score of 41.2 percent and the small traders (not shown in chart) are Bullish with a score of 76.2 percent.
Price Trend-Following Model: Strong Uptrend
Our weekly trend-following model classifies the current market price position as: Strong Uptrend. The current action for the model is considered to be: Hold – Maintain Long Position.
| AUSTRALIAN DOLLAR Statistics | SPECULATORS | COMMERCIALS | SMALL TRADERS |
| – Percent of Open Interest Longs: | 31.8 | 50.1 | 16.2 |
| – Percent of Open Interest Shorts: | 55.4 | 31.3 | 11.4 |
| – Net Position: | -40,122 | 31,978 | 8,144 |
| – Gross Longs: | 53,941 | 85,069 | 27,547 |
| – Gross Shorts: | 94,063 | 53,091 | 19,403 |
| – Long to Short Ratio: | 0.6 to 1 | 1.6 to 1 | 1.4 to 1 |
| NET POSITION TREND: | |||
| – Strength Index Score (3 Year Range Pct): | 56.8 | 41.2 | 76.2 |
| – Strength Index Reading (3 Year Range): | Bullish | Bearish | Bullish |
| NET POSITION MOVEMENT INDEX: | |||
| – 6-Week Change in Strength Index: | 0.1 | -8.8 | 35.0 |
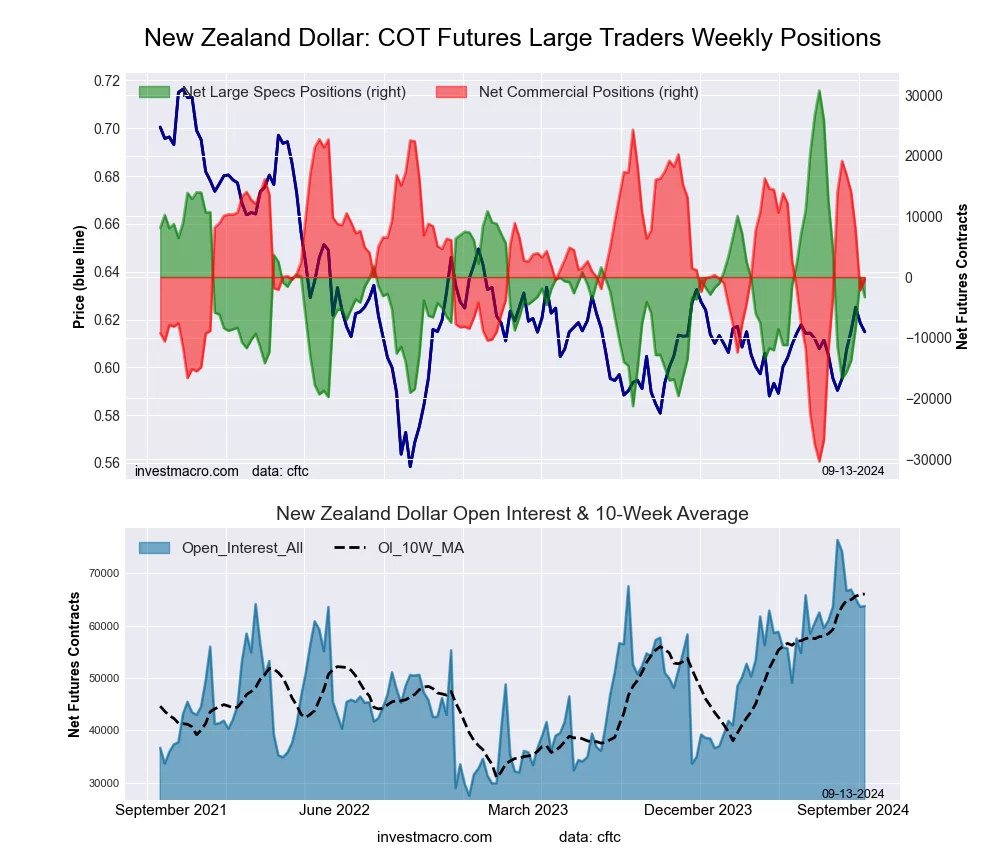
New Zealand Dollar Futures:
 The New Zealand Dollar large speculator standing this week came in at a net position of -1,890 contracts in the data reported through Tuesday. This was a weekly rise of 1,425 contracts from the previous week which had a total of -3,315 net contracts.
This week’s current strength score (the trader positioning range over the past three years, measured from 0 to 100) shows the speculators are currently Bearish with a score of 37.3 percent. The commercials are Bullish with a score of 55.1 percent and the small traders (not shown in chart) are Bullish-Extreme with a score of 80.8 percent.
Price Trend-Following Model: Strong Uptrend
Our weekly trend-following model classifies the current market price position as: Strong Uptrend. The current action for the model is considered to be: Hold – Maintain Long Position.
| NEW ZEALAND DOLLAR Statistics | SPECULATORS | COMMERCIALS | SMALL TRADERS |
| – Percent of Open Interest Longs: | 42.1 | 46.3 | 11.3 |
| – Percent of Open Interest Shorts: | 45.9 | 46.8 | 7.0 |
| – Net Position: | -1,890 | -262 | 2,152 |
| – Gross Longs: | 20,758 | 22,813 | 5,579 |
| – Gross Shorts: | 22,648 | 23,075 | 3,427 |
| – Long to Short Ratio: | 0.9 to 1 | 1.0 to 1 | 1.6 to 1 |
| NET POSITION TREND: | |||
| – Strength Index Score (3 Year Range Pct): | 37.3 | 55.1 | 80.8 |
| – Strength Index Reading (3 Year Range): | Bearish | Bullish | Bullish-Extreme |
| NET POSITION MOVEMENT INDEX: | |||
| – 6-Week Change in Strength Index: | 28.6 | -35.5 | 57.7 |
Mexican Peso Futures:
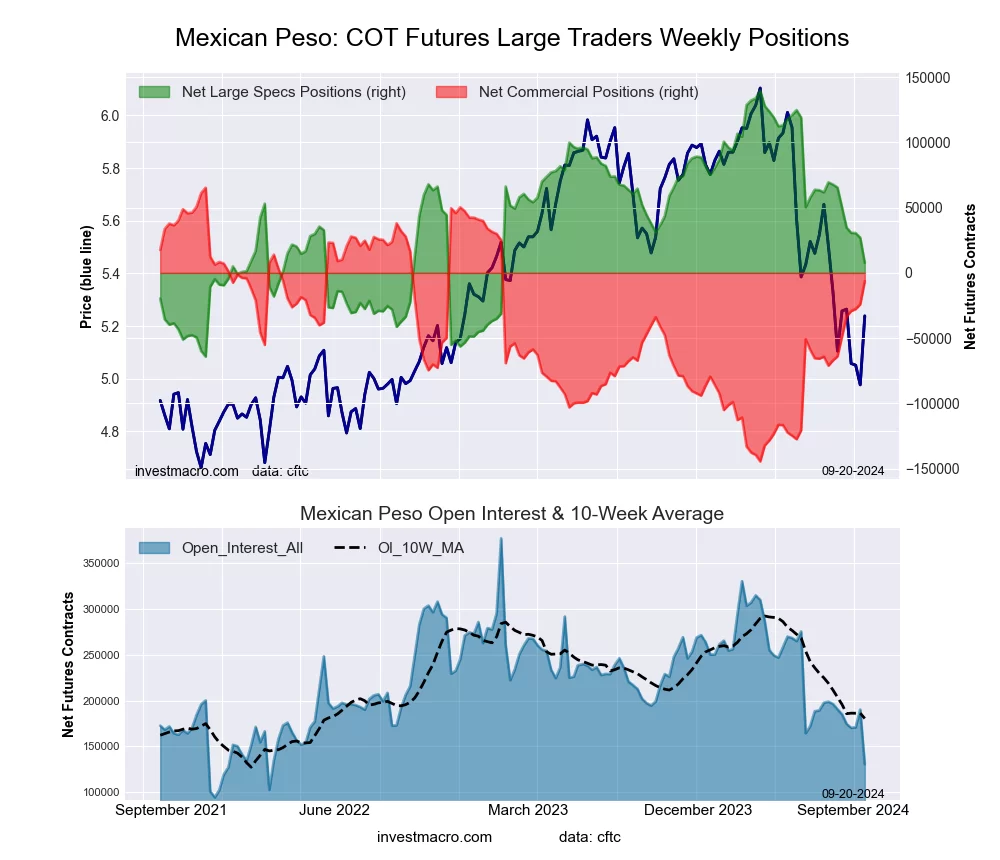 The Mexican Peso large speculator standing this week came in at a net position of 7,723 contracts in the data reported through Tuesday. This was a weekly lowering of -19,303 contracts from the previous week which had a total of 27,026 net contracts.
This week’s current strength score (the trader positioning range over the past three years, measured from 0 to 100) shows the speculators are currently Bearish with a score of 35.3 percent. The commercials are Bullish with a score of 65.9 percent and the small traders (not shown in chart) are Bearish-Extreme with a score of 8.6 percent.
Price Trend-Following Model: Downtrend
Our weekly trend-following model classifies the current market price position as: Downtrend. The current action for the model is considered to be: Hold – Maintain Short Position.
| MEXICAN PESO Statistics | SPECULATORS | COMMERCIALS | SMALL TRADERS |
| – Percent of Open Interest Longs: | 37.1 | 57.4 | 3.3 |
| – Percent of Open Interest Shorts: | 31.2 | 62.2 | 4.4 |
| – Net Position: | 7,723 | -6,352 | -1,371 |
| – Gross Longs: | 48,486 | 74,941 | 4,349 |
| – Gross Shorts: | 40,763 | 81,293 | 5,720 |
| – Long to Short Ratio: | 1.2 to 1 | 0.9 to 1 | 0.8 to 1 |
| NET POSITION TREND: | |||
| – Strength Index Score (3 Year Range Pct): | 35.3 | 65.9 | 8.6 |
| – Strength Index Reading (3 Year Range): | Bearish | Bullish | Bearish-Extreme |
| NET POSITION MOVEMENT INDEX: | |||
| – 6-Week Change in Strength Index: | -28.3 | 27.5 | -0.3 |
Brazilian Real Futures:
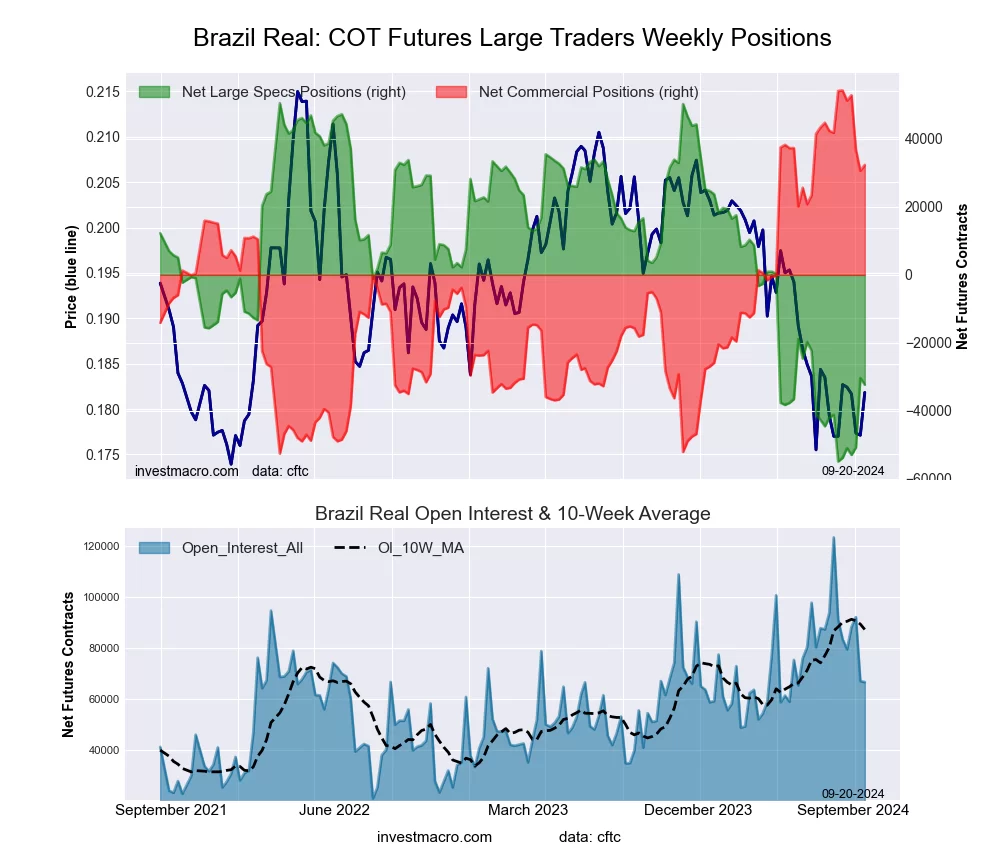 The Brazilian Real large speculator standing this week came in at a net position of -32,306 contracts in the data reported through Tuesday. This was a weekly decline of -1,942 contracts from the previous week which had a total of -30,364 net contracts.
This week’s current strength score (the trader positioning range over the past three years, measured from 0 to 100) shows the speculators are currently Bearish with a score of 21.4 percent. The commercials are Bullish with a score of 79.5 percent and the small traders (not shown in chart) are Bearish with a score of 20.8 percent.
Price Trend-Following Model: Downtrend
Our weekly trend-following model classifies the current market price position as: Downtrend. The current action for the model is considered to be: Hold – Maintain Short Position.
| BRAZIL REAL Statistics | SPECULATORS | COMMERCIALS | SMALL TRADERS |
| – Percent of Open Interest Longs: | 23.9 | 69.1 | 4.0 |
| – Percent of Open Interest Shorts: | 72.3 | 20.6 | 4.0 |
| – Net Position: | -32,306 | 32,321 | -15 |
| – Gross Longs: | 15,913 | 46,077 | 2,665 |
| – Gross Shorts: | 48,219 | 13,756 | 2,680 |
| – Long to Short Ratio: | 0.3 to 1 | 3.3 to 1 | 1.0 to 1 |
| NET POSITION TREND: | |||
| – Strength Index Score (3 Year Range Pct): | 21.4 | 79.5 | 20.8 |
| – Strength Index Reading (3 Year Range): | Bearish | Bullish | Bearish |
| NET POSITION MOVEMENT INDEX: | |||
| – 6-Week Change in Strength Index: | 21.4 | -20.4 | -4.3 |
Bitcoin Futures:
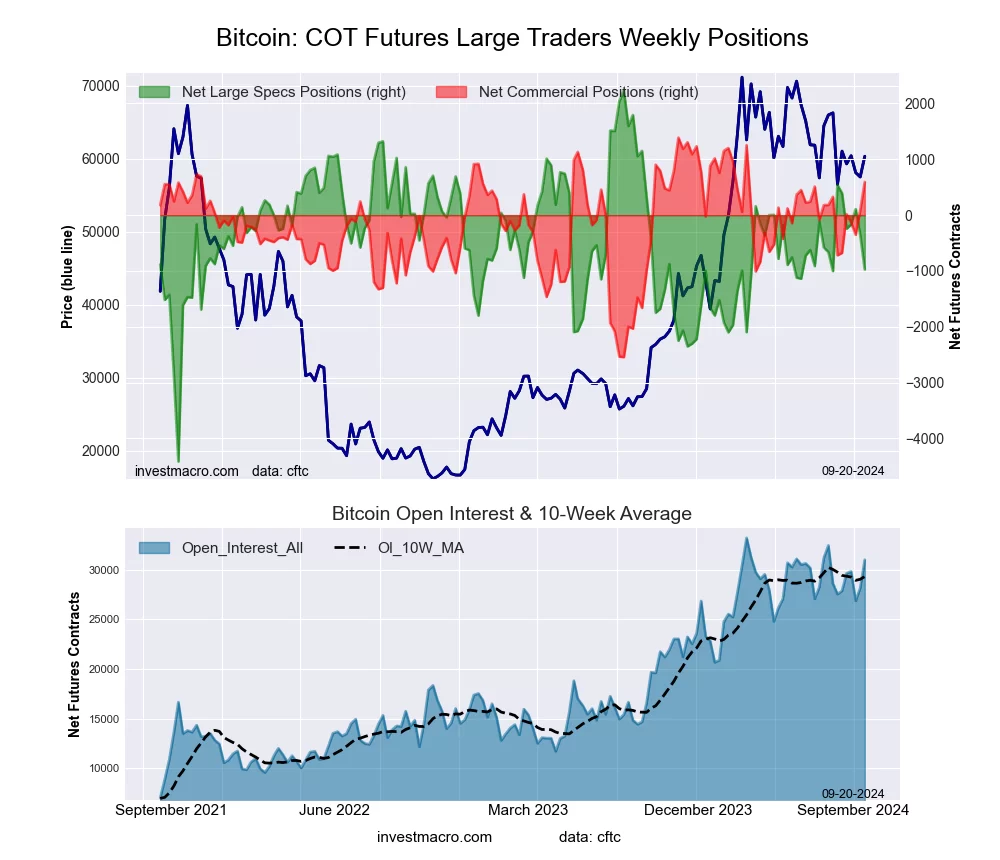 The Bitcoin large speculator standing this week came in at a net position of -973 contracts in the data reported through Tuesday. This was a weekly decline of -620 contracts from the previous week which had a total of -353 net contracts.
This week’s current strength score (the trader positioning range over the past three years, measured from 0 to 100) shows the speculators are currently Bullish with a score of 51.8 percent. The commercials are Bullish with a score of 79.9 percent and the small traders (not shown in chart) are Bearish with a score of 21.5 percent.
Price Trend-Following Model: Weak Downtrend
Our weekly trend-following model classifies the current market price position as: Weak Downtrend. The current action for the model is considered to be: Hold – Maintain Short Position.
| BITCOIN Statistics | SPECULATORS | COMMERCIALS | SMALL TRADERS |
| – Percent of Open Interest Longs: | 77.0 | 5.0 | 4.0 |
| – Percent of Open Interest Shorts: | 80.1 | 3.1 | 2.8 |
| – Net Position: | -973 | 596 | 377 |
| – Gross Longs: | 23,866 | 1,544 | 1,238 |
| – Gross Shorts: | 24,839 | 948 | 861 |
| – Long to Short Ratio: | 1.0 to 1 | 1.6 to 1 | 1.4 to 1 |
| NET POSITION TREND: | |||
| – Strength Index Score (3 Year Range Pct): | 51.8 | 79.9 | 21.5 |
| – Strength Index Reading (3 Year Range): | Bullish | Bullish | Bearish |
| NET POSITION MOVEMENT INDEX: | |||
| – 6-Week Change in Strength Index: | -22.7 | 33.5 | 4.5 |
Article By InvestMacro – Receive our weekly COT Newsletter
*COT Report: The COT data, released weekly to the public each Friday, is updated through the most recent Tuesday (data is 3 days old) and shows a quick view of how large speculators or non-commercials (for-profit traders) were positioned in the futures markets.
The CFTC categorizes trader positions according to commercial hedgers (traders who use futures contracts for hedging as part of the business), non-commercials (large traders who speculate to realize trading profits) and nonreportable traders (usually small traders/speculators) as well as their open interest (contracts open in the market at time of reporting). See CFTC criteria here.