By InvestMacro
Here are the latest charts and statistics for the Commitment of Traders (COT) data published by the Commodities Futures Trading Commission (CFTC).
The latest COT data is updated through Tuesday October 8th and shows a quick view of how large traders (for-profit speculators and commercial entities) were positioned in the futures markets.
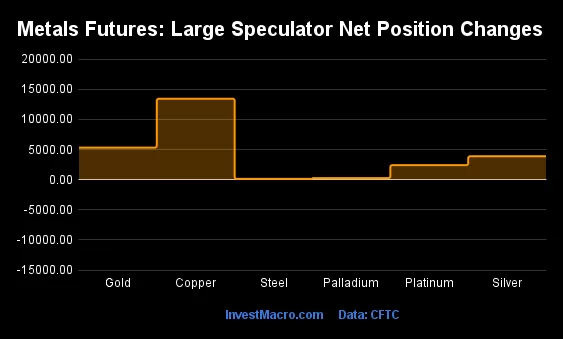
Weekly Speculator Changes led by Steel & Palladium
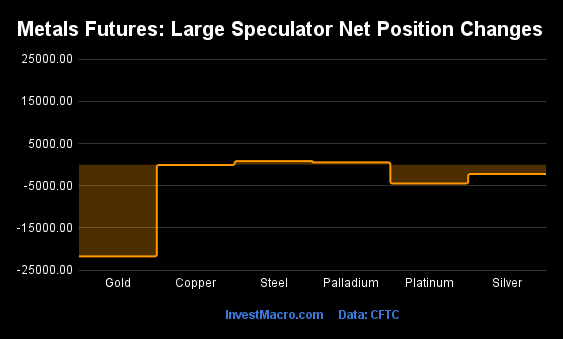
The COT metals markets speculator bets were overall lower this week as just two out of the six metals markets we cover had higher positioning while the other four markets had lower speculator contracts.
Leading the gains for the metals was small gains for Steel (830 contracts) with Palladium (546 contracts) also showing a rising week.
The markets with declines in speculator bets for the week were Gold (-21,751 contracts), Platinum (-4,475 contracts), Silver (-2,209 contracts) and with Copper (-96 contracts) also registering a small decrease in bets on the week.
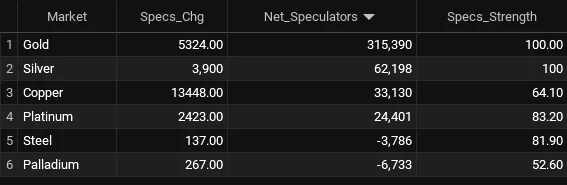
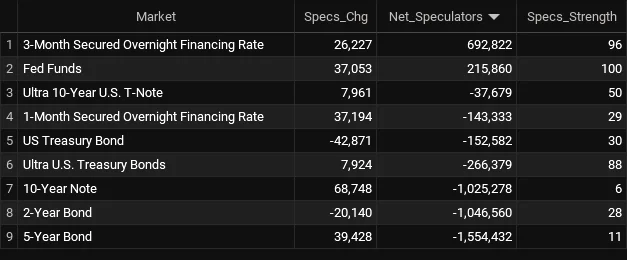
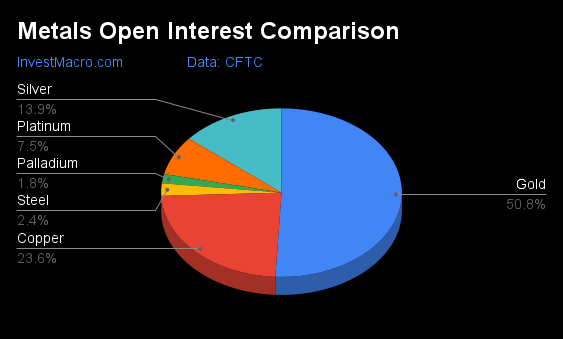
Metals Net Speculators Leaderboard
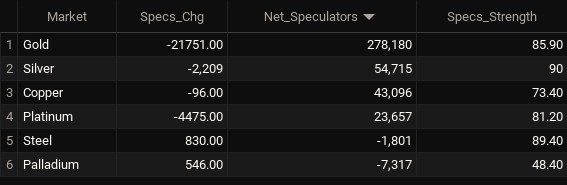
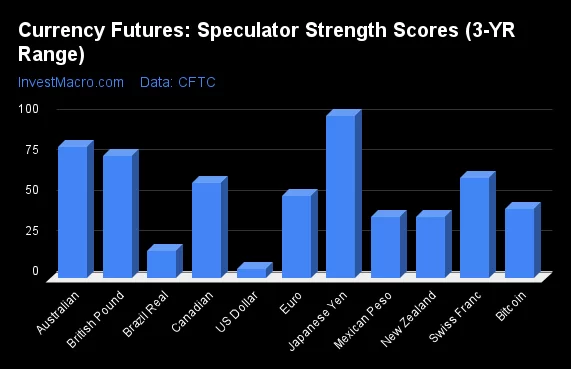
Legend: Weekly Speculators Change | Speculators Current Net Position | Speculators Strength Score compared to last 3-Years (0-100 range)
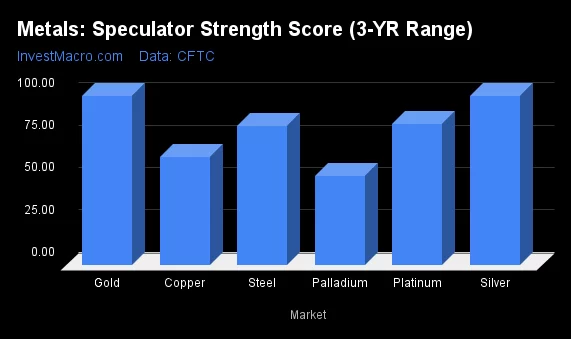
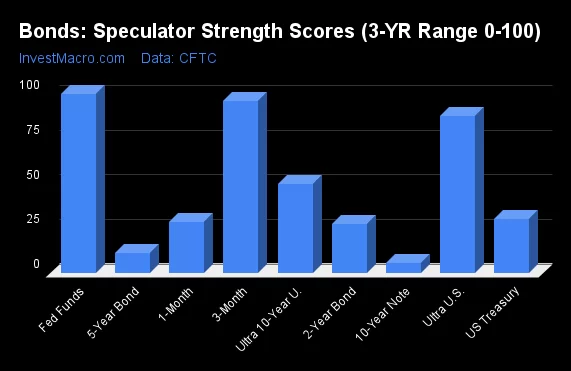
Strength Scores led by Silver & Steel
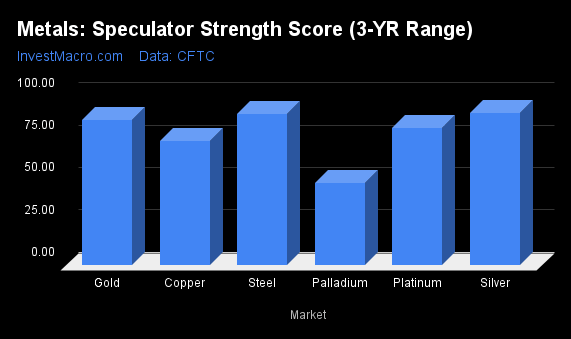
COT Strength Scores (a normalized measure of Speculator positions over a 3-Year range, from 0 to 100 where above 80 is Extreme-Bullish and below 20 is Extreme-Bearish) showed that Silver (90 percent) and Steel (89 percent) remain near the top of their 3-Year ranges and lead the metals markets this week. Gold (86 percent) comes in as the next highest in the weekly strength scores.
On the downside, Palladium (48 percent) comes in at the lowest strength level currently but is close to the midpoint (50 percent) for the past 3-Years.
Strength Statistics:
Gold (85.9 percent) vs Gold previous week (94.1 percent)
Silver (90.0 percent) vs Silver previous week (93.0 percent)
Copper (73.4 percent) vs Copper previous week (73.5 percent)
Platinum (81.2 percent) vs Platinum previous week (93.1 percent)
Palladium (48.4 percent) vs Palladium previous week (44.4 percent)
Steel (89.4 percent) vs Palladium previous week (86.3 percent)
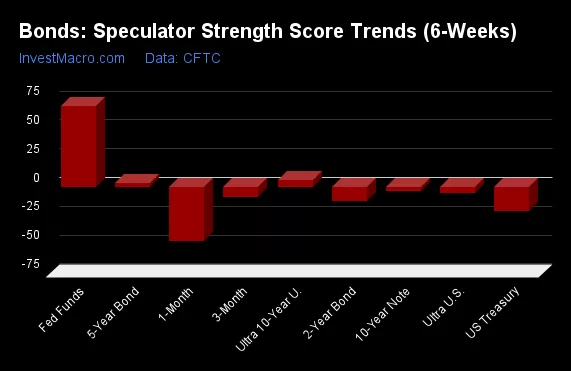
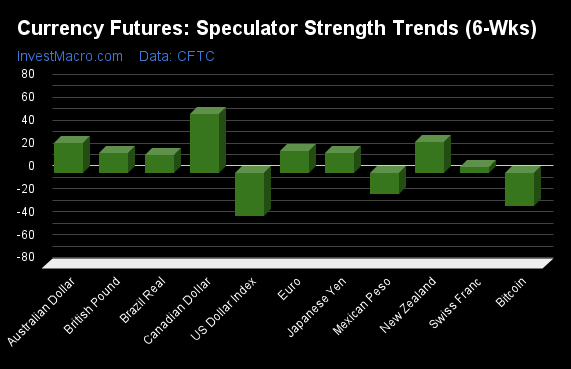
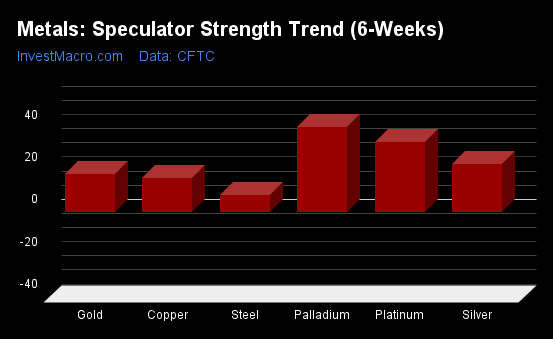
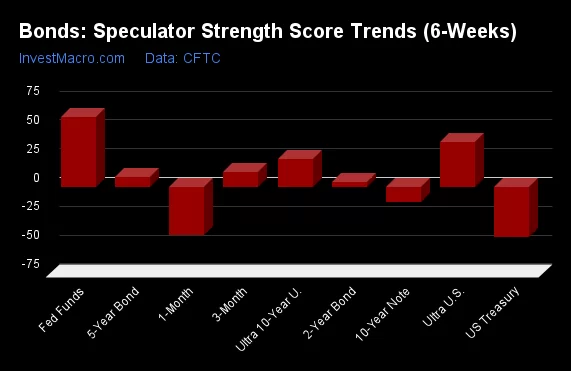
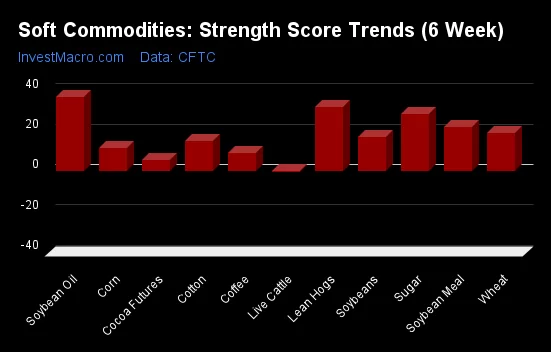
Palladium & Copper top the 6-Week Strength Trends
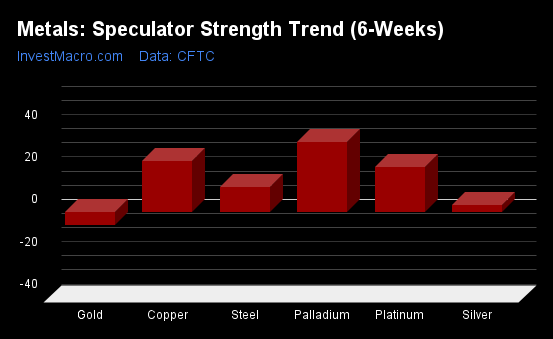
COT Strength Score Trends (or move index, calculates the 6-week changes in strength scores) showed that Palladium (33 percent) and Copper (24 percent) lead the past six weeks trends for metals. Platinum (21 percent) is the next highest positive mover in the latest trends data.
Gold (-6 percent) leads the downside trend scores currently and is the only market with a negative trend.
Move Statistics:
Gold (-6.2 percent) vs Gold previous week (3.3 percent)
Silver (3.4 percent) vs Silver previous week (10.1 percent)
Copper (24.2 percent) vs Copper previous week (21.3 percent)
Platinum (21.2 percent) vs Platinum previous week (35.5 percent)
Palladium (33.3 percent) vs Palladium previous week (32.3 percent)
Steel (11.8 percent) vs Steel previous week (9.7 percent)
Individual Markets:
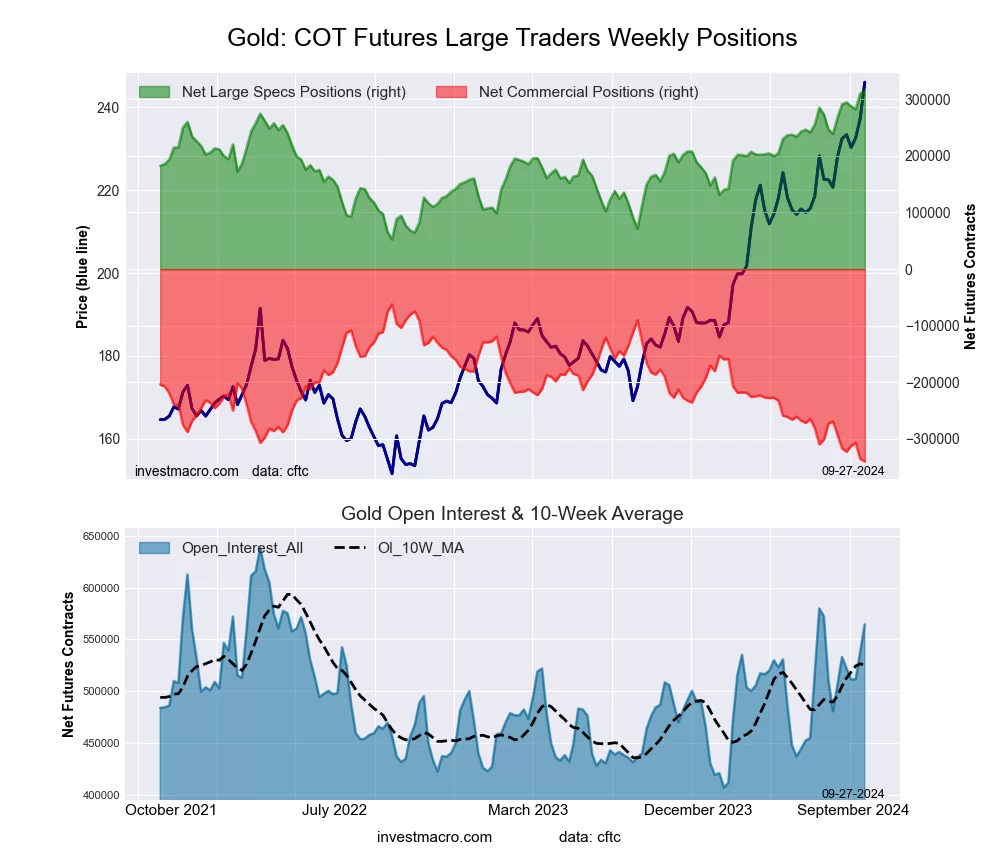
Gold Comex Futures:
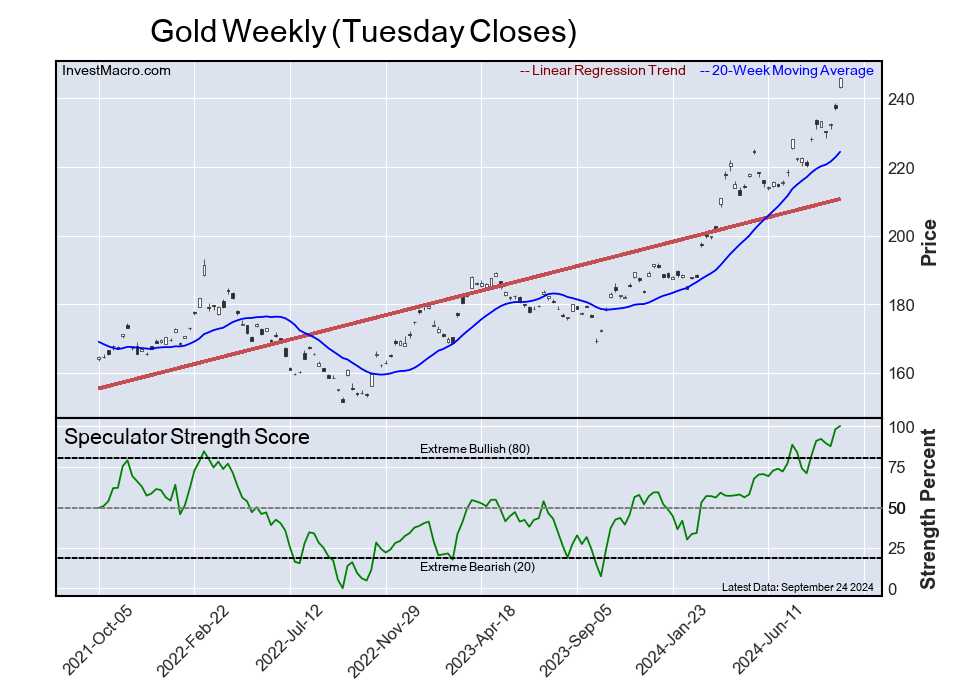
 The Gold Comex Futures large speculator standing this week resulted in a net position of 278,180 contracts in the data reported through Tuesday. This was a weekly lowering of -21,751 contracts from the previous week which had a total of 299,931 net contracts.
This week’s current strength score (the trader positioning range over the past three years, measured from 0 to 100) shows the speculators are currently Bullish-Extreme with a score of 85.9 percent. The commercials are Bearish-Extreme with a score of 12.9 percent and the small traders (not shown in chart) are Bullish with a score of 64.0 percent.
Price Trend-Following Model: Strong Uptrend
Our weekly trend-following model classifies the current market price position as: Strong Uptrend.
| Gold Futures Statistics | SPECULATORS | COMMERCIALS | SMALL TRADERS |
| – Percent of Open Interest Longs: | 67.1 | 13.3 | 9.9 |
| – Percent of Open Interest Shorts: | 13.6 | 71.7 | 4.9 |
| – Net Position: | 278,180 | -303,976 | 25,796 |
| – Gross Longs: | 348,891 | 68,957 | 51,440 |
| – Gross Shorts: | 70,711 | 372,933 | 25,644 |
| – Long to Short Ratio: | 4.9 to 1 | 0.2 to 1 | 2.0 to 1 |
| NET POSITION TREND: | |||
| – Strength Index Score (3 Year Range Pct): | 85.9 | 12.9 | 64.0 |
| – Strength Index Reading (3 Year Range): | Bullish-Extreme | Bearish-Extreme | Bullish |
| NET POSITION MOVEMENT INDEX: | |||
| – 6-Week Change in Strength Index: | -6.2 | 6.6 | -7.5 |
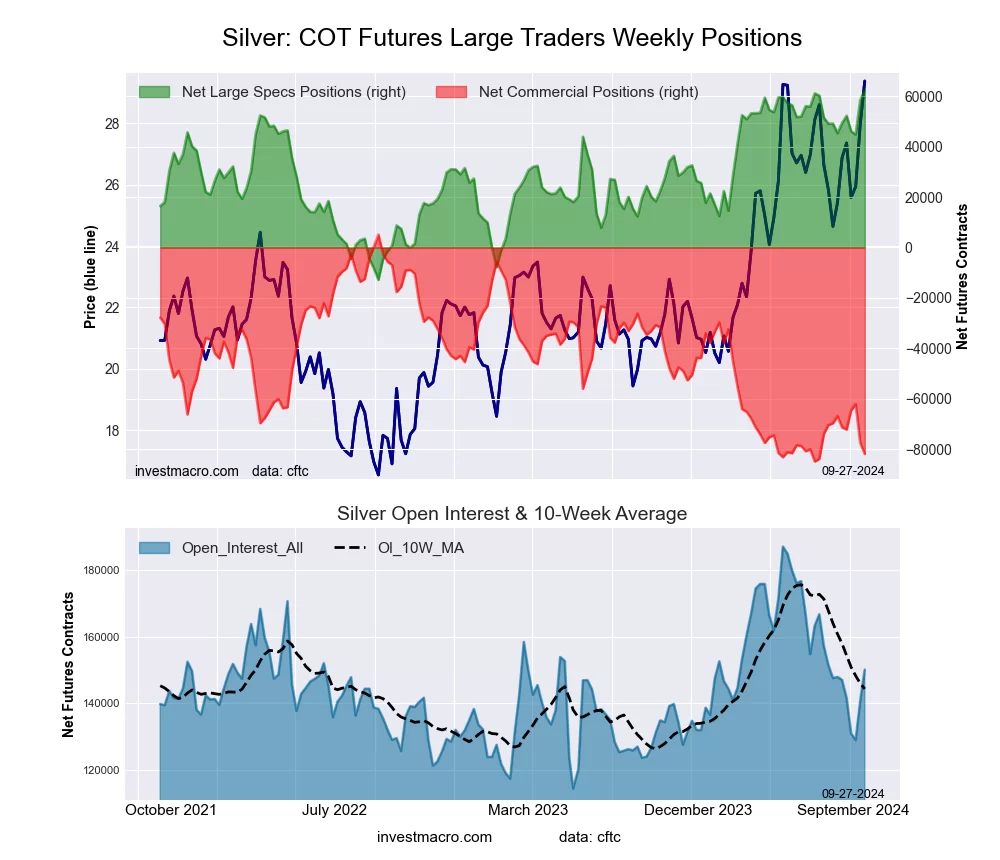
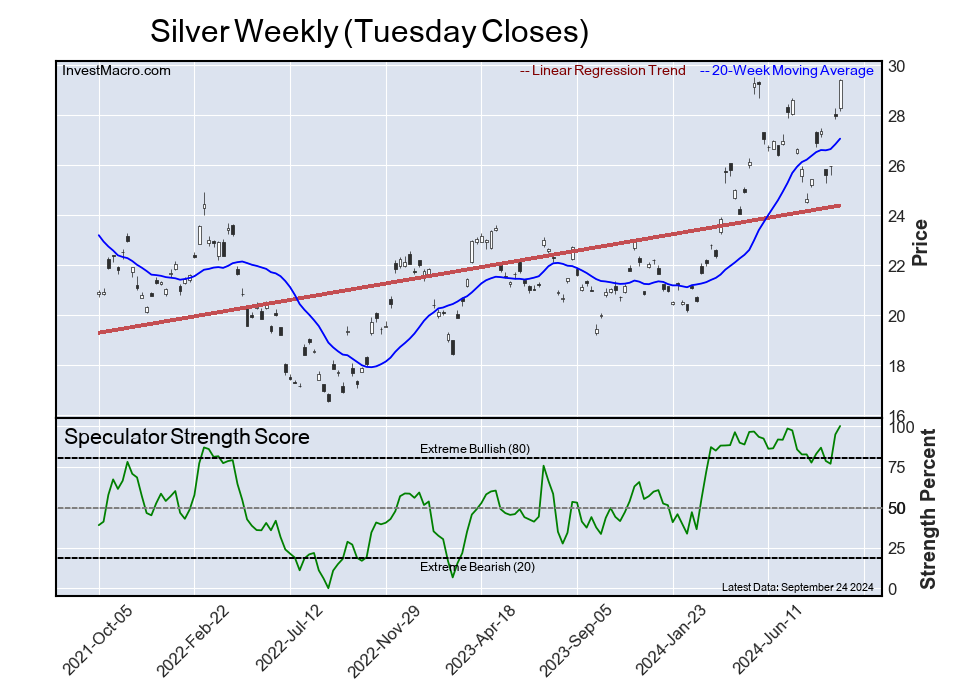
Silver Comex Futures:
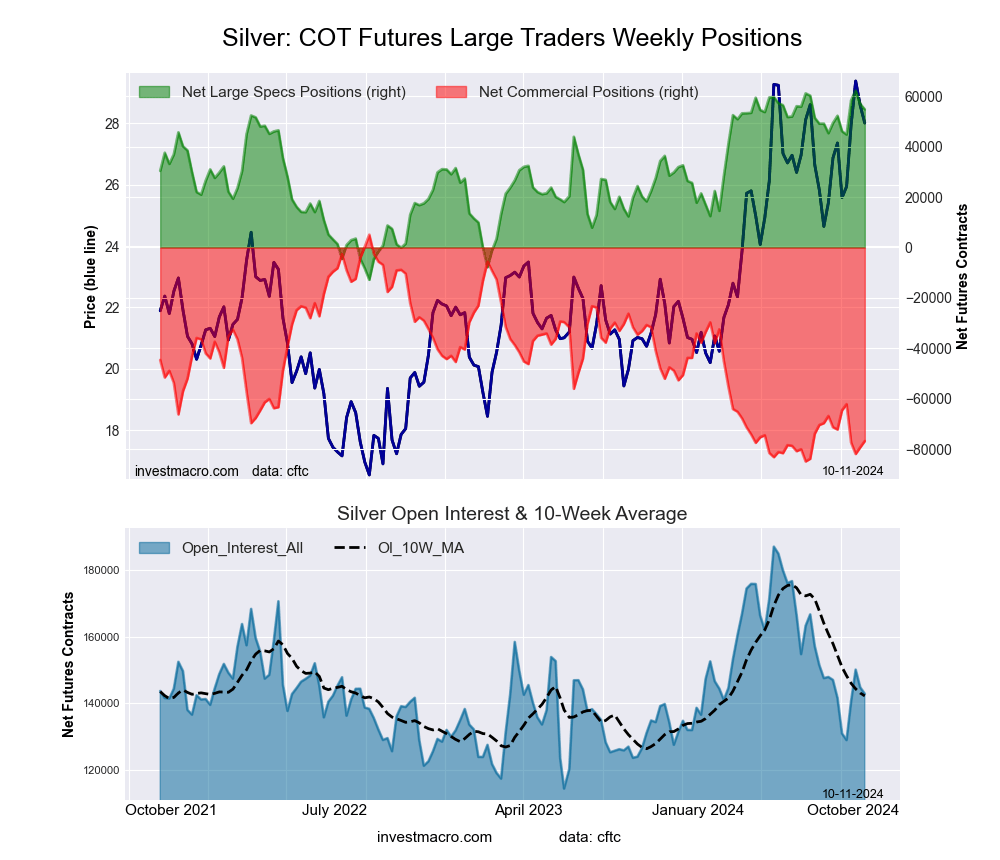 The Silver Comex Futures large speculator standing this week resulted in a net position of 54,715 contracts in the data reported through Tuesday. This was a weekly lowering of -2,209 contracts from the previous week which had a total of 56,924 net contracts.
This week’s current strength score (the trader positioning range over the past three years, measured from 0 to 100) shows the speculators are currently Bullish-Extreme with a score of 90.0 percent. The commercials are Bearish-Extreme with a score of 9.0 percent and the small traders (not shown in chart) are Bullish with a score of 77.2 percent.
Price Trend-Following Model: Strong Uptrend
Our weekly trend-following model classifies the current market price position as: Strong Uptrend.
| Silver Futures Statistics | SPECULATORS | COMMERCIALS | SMALL TRADERS |
| – Percent of Open Interest Longs: | 50.5 | 20.8 | 21.9 |
| – Percent of Open Interest Shorts: | 12.2 | 74.5 | 6.5 |
| – Net Position: | 54,715 | -76,715 | 22,000 |
| – Gross Longs: | 72,113 | 29,717 | 31,279 |
| – Gross Shorts: | 17,398 | 106,432 | 9,279 |
| – Long to Short Ratio: | 4.1 to 1 | 0.3 to 1 | 3.4 to 1 |
| NET POSITION TREND: | |||
| – Strength Index Score (3 Year Range Pct): | 90.0 | 9.0 | 77.2 |
| – Strength Index Reading (3 Year Range): | Bullish-Extreme | Bearish-Extreme | Bullish |
| NET POSITION MOVEMENT INDEX: | |||
| – 6-Week Change in Strength Index: | 3.4 | -5.1 | 9.9 |
Copper Grade #1 Futures:
 The Copper Grade #1 Futures large speculator standing this week resulted in a net position of 43,096 contracts in the data reported through Tuesday. This was a weekly fall of -96 contracts from the previous week which had a total of 43,192 net contracts.
This week’s current strength score (the trader positioning range over the past three years, measured from 0 to 100) shows the speculators are currently Bullish with a score of 73.4 percent. The commercials are Bearish with a score of 25.4 percent and the small traders (not shown in chart) are Bullish with a score of 73.5 percent.
Price Trend-Following Model: Weak Downtrend
Our weekly trend-following model classifies the current market price position as: Weak Downtrend.
| Copper Futures Statistics | SPECULATORS | COMMERCIALS | SMALL TRADERS |
| – Percent of Open Interest Longs: | 43.6 | 28.4 | 8.4 |
| – Percent of Open Interest Shorts: | 25.8 | 50.1 | 4.5 |
| – Net Position: | 43,096 | -52,304 | 9,208 |
| – Gross Longs: | 105,252 | 68,582 | 20,178 |
| – Gross Shorts: | 62,156 | 120,886 | 10,970 |
| – Long to Short Ratio: | 1.7 to 1 | 0.6 to 1 | 1.8 to 1 |
| NET POSITION TREND: | |||
| – Strength Index Score (3 Year Range Pct): | 73.4 | 25.4 | 73.5 |
| – Strength Index Reading (3 Year Range): | Bullish | Bearish | Bullish |
| NET POSITION MOVEMENT INDEX: | |||
| – 6-Week Change in Strength Index: | 24.2 | -22.7 | 2.1 |
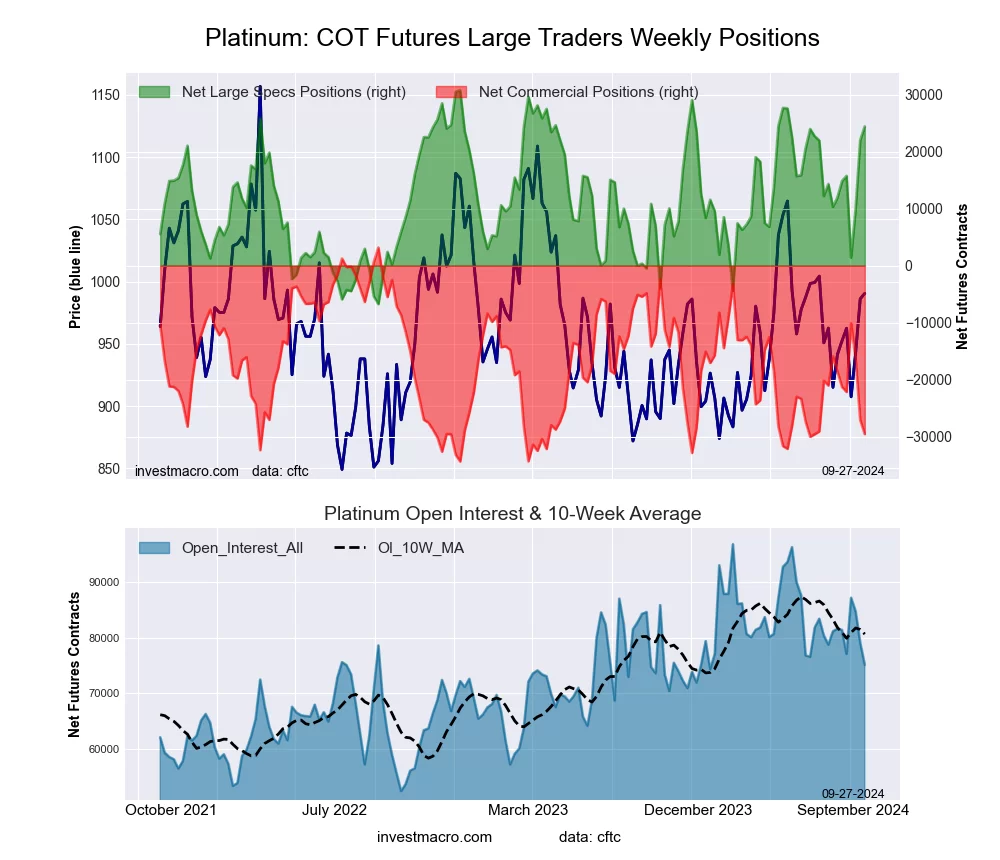
Platinum Futures:
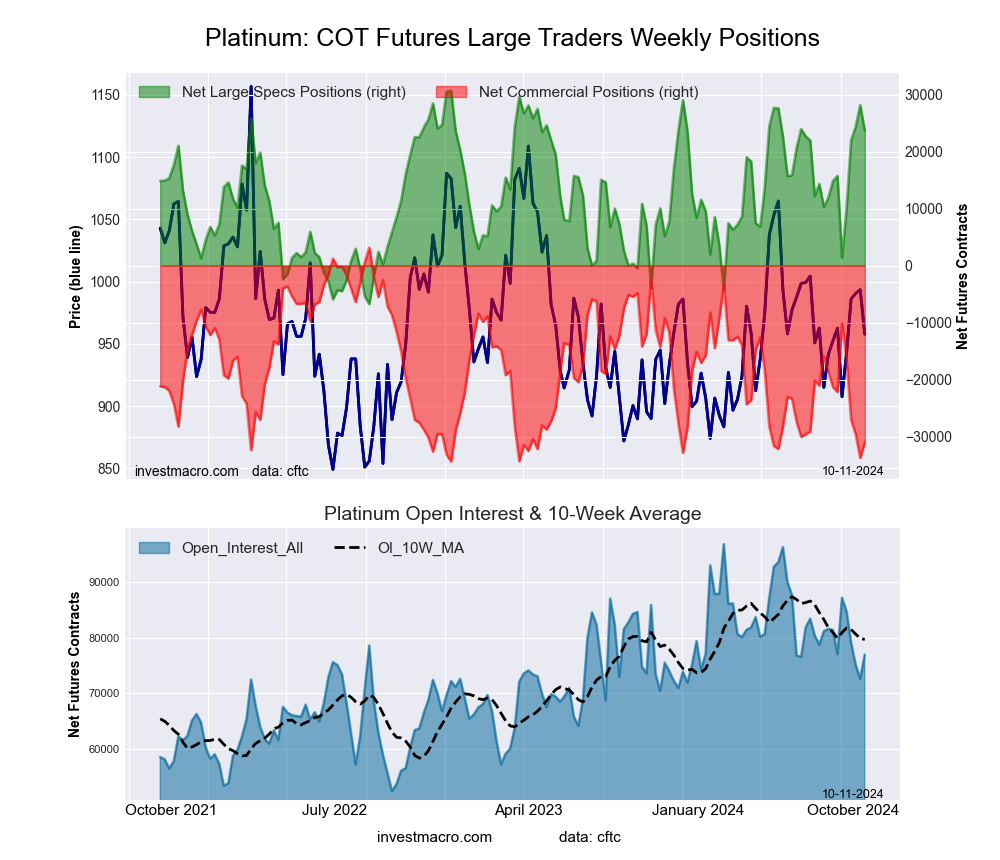 The Platinum Futures large speculator standing this week resulted in a net position of 23,657 contracts in the data reported through Tuesday. This was a weekly fall of -4,475 contracts from the previous week which had a total of 28,132 net contracts.
This week’s current strength score (the trader positioning range over the past three years, measured from 0 to 100) shows the speculators are currently Bullish-Extreme with a score of 81.2 percent. The commercials are Bearish-Extreme with a score of 8.9 percent and the small traders (not shown in chart) are Bullish with a score of 78.1 percent.
Price Trend-Following Model: Weak Downtrend
Our weekly trend-following model classifies the current market price position as: Weak Downtrend.
| Platinum Futures Statistics | SPECULATORS | COMMERCIALS | SMALL TRADERS |
| – Percent of Open Interest Longs: | 60.2 | 20.0 | 13.5 |
| – Percent of Open Interest Shorts: | 29.5 | 60.3 | 4.0 |
| – Net Position: | 23,657 | -31,009 | 7,352 |
| – Gross Longs: | 46,339 | 15,424 | 10,408 |
| – Gross Shorts: | 22,682 | 46,433 | 3,056 |
| – Long to Short Ratio: | 2.0 to 1 | 0.3 to 1 | 3.4 to 1 |
| NET POSITION TREND: | |||
| – Strength Index Score (3 Year Range Pct): | 81.2 | 8.9 | 78.1 |
| – Strength Index Reading (3 Year Range): | Bullish-Extreme | Bearish-Extreme | Bullish |
| NET POSITION MOVEMENT INDEX: | |||
| – 6-Week Change in Strength Index: | 21.2 | -23.6 | 14.5 |
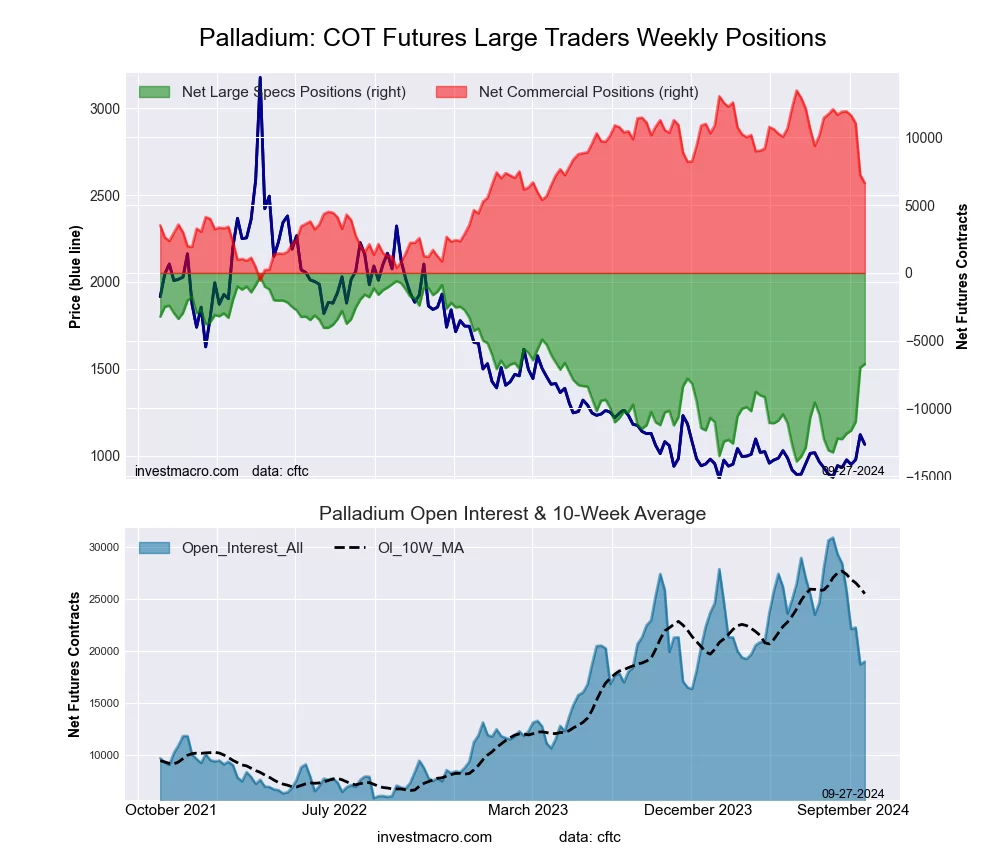
Palladium Futures:
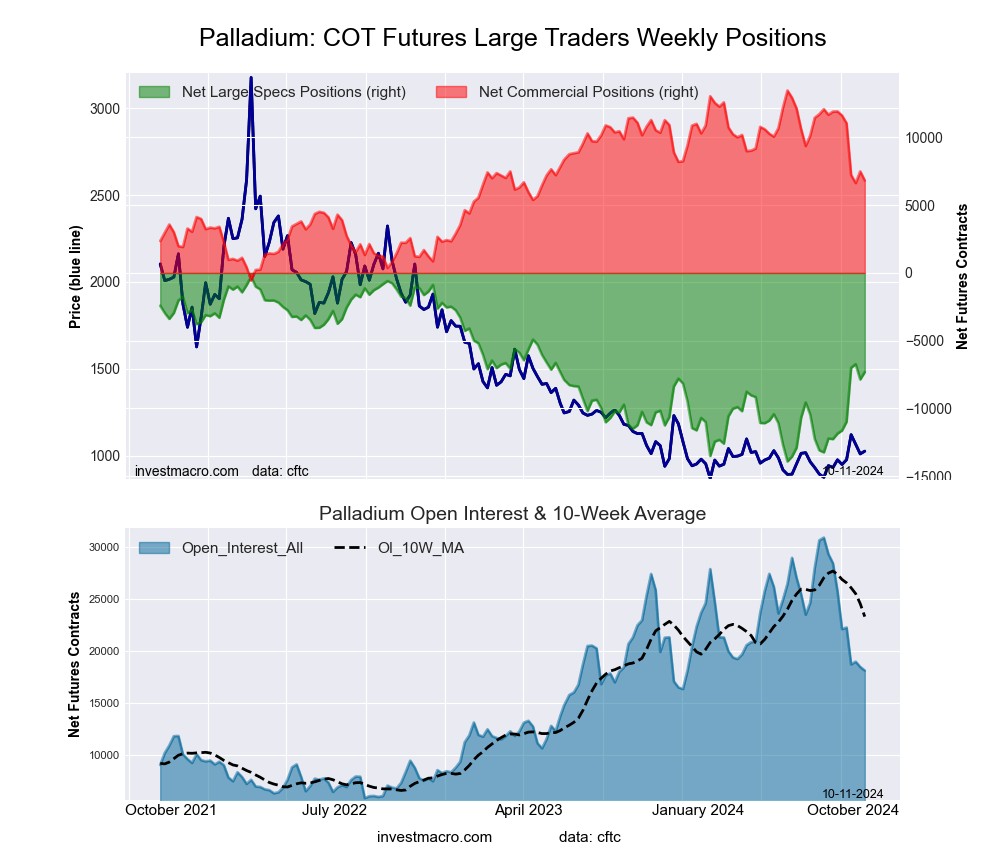 The Palladium Futures large speculator standing this week resulted in a net position of -7,317 contracts in the data reported through Tuesday. This was a weekly rise of 546 contracts from the previous week which had a total of -7,863 net contracts.
This week’s current strength score (the trader positioning range over the past three years, measured from 0 to 100) shows the speculators are currently Bearish with a score of 48.4 percent. The commercials are Bullish with a score of 52.7 percent and the small traders (not shown in chart) are Bullish with a score of 57.0 percent.
Price Trend-Following Model: Strong Uptrend
Our weekly trend-following model classifies the current market price position as: Strong Uptrend.
| Palladium Futures Statistics | SPECULATORS | COMMERCIALS | SMALL TRADERS |
| – Percent of Open Interest Longs: | 26.9 | 58.2 | 10.5 |
| – Percent of Open Interest Shorts: | 67.3 | 20.5 | 7.8 |
| – Net Position: | -7,317 | 6,829 | 488 |
| – Gross Longs: | 4,882 | 10,549 | 1,906 |
| – Gross Shorts: | 12,199 | 3,720 | 1,418 |
| – Long to Short Ratio: | 0.4 to 1 | 2.8 to 1 | 1.3 to 1 |
| NET POSITION TREND: | |||
| – Strength Index Score (3 Year Range Pct): | 48.4 | 52.7 | 57.0 |
| – Strength Index Reading (3 Year Range): | Bearish | Bullish | Bullish |
| NET POSITION MOVEMENT INDEX: | |||
| – 6-Week Change in Strength Index: | 33.3 | -36.3 | 26.5 |
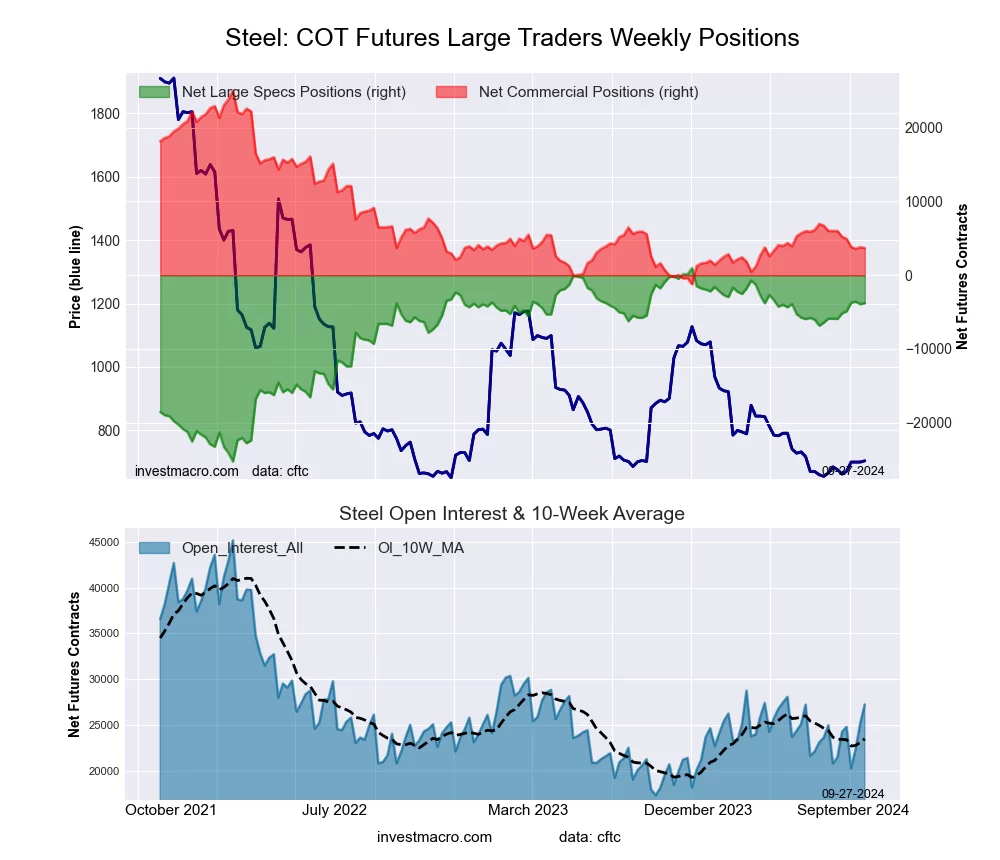
Steel Futures Futures:
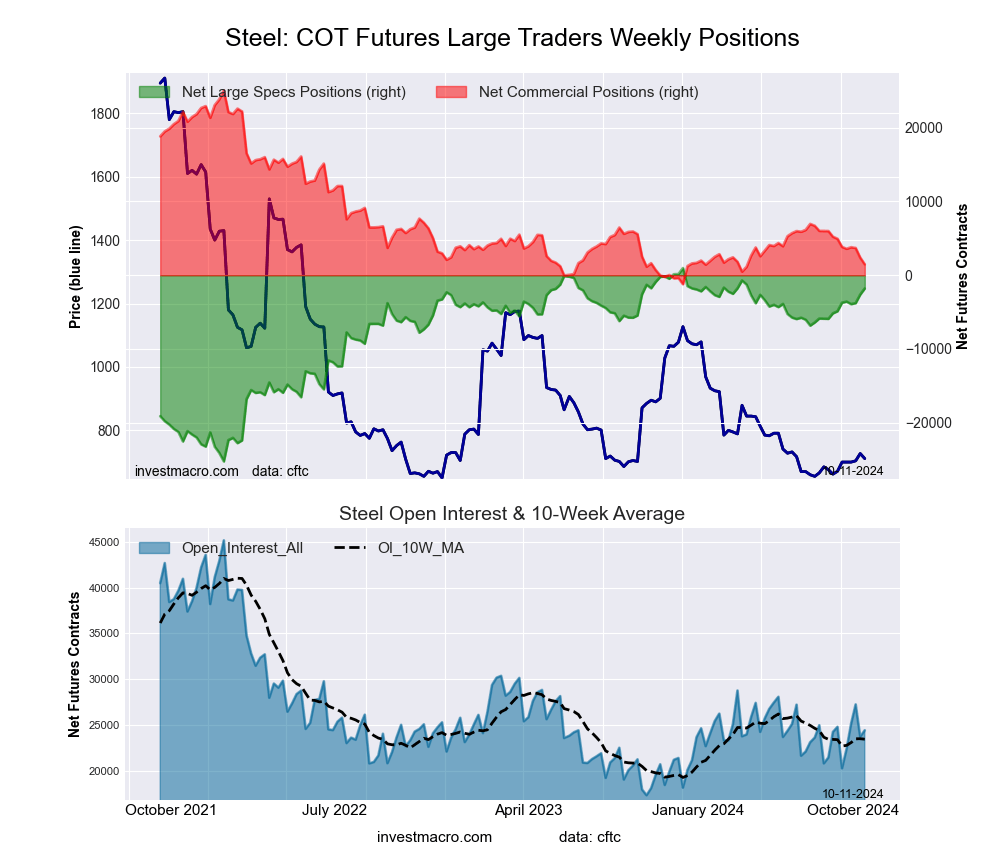 The Steel Futures large speculator standing this week resulted in a net position of -1,801 contracts in the data reported through Tuesday. This was a weekly lift of 830 contracts from the previous week which had a total of -2,631 net contracts.
This week’s current strength score (the trader positioning range over the past three years, measured from 0 to 100) shows the speculators are currently Bullish-Extreme with a score of 89.4 percent. The commercials are Bearish-Extreme with a score of 10.3 percent and the small traders (not shown in chart) are Bullish with a score of 67.6 percent.
Price Trend-Following Model: Weak Downtrend
Our weekly trend-following model classifies the current market price position as: Weak Downtrend.
| Steel Futures Statistics | SPECULATORS | COMMERCIALS | SMALL TRADERS |
| – Percent of Open Interest Longs: | 22.4 | 69.7 | 1.9 |
| – Percent of Open Interest Shorts: | 29.8 | 63.7 | 0.6 |
| – Net Position: | -1,801 | 1,479 | 322 |
| – Gross Longs: | 5,473 | 17,032 | 470 |
| – Gross Shorts: | 7,274 | 15,553 | 148 |
| – Long to Short Ratio: | 0.8 to 1 | 1.1 to 1 | 3.2 to 1 |
| NET POSITION TREND: | |||
| – Strength Index Score (3 Year Range Pct): | 89.4 | 10.3 | 67.6 |
| – Strength Index Reading (3 Year Range): | Bullish-Extreme | Bearish-Extreme | Bullish |
| NET POSITION MOVEMENT INDEX: | |||
| – 6-Week Change in Strength Index: | 11.8 | -13.2 | 40.7 |
Article By InvestMacro – Receive our weekly COT Newsletter
*COT Report: The COT data, released weekly to the public each Friday, is updated through the most recent Tuesday (data is 3 days old) and shows a quick view of how large speculators or non-commercials (for-profit traders) were positioned in the futures markets.
The CFTC categorizes trader positions according to commercial hedgers (traders who use futures contracts for hedging as part of the business), non-commercials (large traders who speculate to realize trading profits) and nonreportable traders (usually small traders/speculators) as well as their open interest (contracts open in the market at time of reporting). See CFTC criteria here.