By InvestMacro

Here are the latest charts and statistics for the Commitment of Traders (COT) data published by the Commodities Futures Trading Commission (CFTC).
The latest COT data is updated through Tuesday February 3rd and shows a quick view of how large market participants (for-profit speculators and commercial traders) were positioned in the futures markets. All currency positions are in direct relation to the US dollar where, for example, a bet for the euro is a bet that the euro will rise versus the dollar while a bet against the euro will be a bet that the euro will decline versus the dollar.
Weekly Speculator Changes led by Euro, Australian Dollar and Canadian Dollar
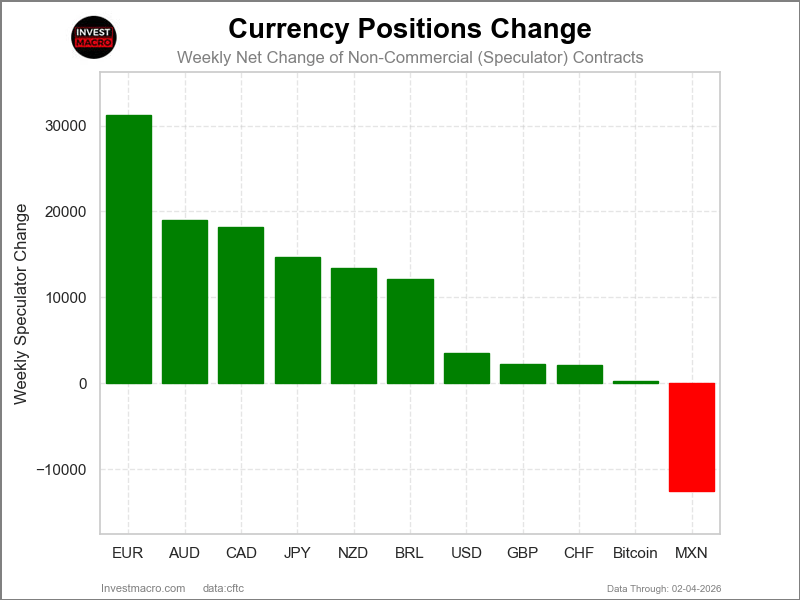
The COT currency market speculator bets were higher this week as ten out of the eleven currency markets we cover had higher positioning while the other one markets had lower speculator contracts.
Leading the gains for the currency markets was the EuroFX (31,227 contracts) with the Australian Dollar (18,972 contracts), the Canadian Dollar (18,176 contracts), the Japanese Yen (14,711 contracts), the New Zealand Dollar (13,451 contracts), the Brazilian Real (12,117 contracts), the US Dollar Index (3,553 contracts), the British Pound (2,251 contracts), the Swiss Franc (2,176 contracts) and Bitcoin (318 contracts) with also showing positive weeks.
The currency seeing declines in speculator bets on the week was the Mexican Peso with a drop by -12,522 contracts on the week.
Currency Speculators sharply boost Euro bets to highest since 2023, CAD bets go Bullish
Highlighting this week’s currency speculator changes were the strong gains in the Euro, the Australian Dollar, and the Canadian Dollar.
First off, the Euro jumped by over 30,000 contracts this week and this week’s gain marked the largest one-week gain since March of 2025, when speculative bets surged by over +46,000 contracts. This week’s surge follows last week’s rise by over 20,000 contracts and has now pushed the overall speculative level to a total of 163,361 net contracts, which marks the highest level for the Euro bets dating back to August 1st of 2023. The European currency’s speculative standing has now been above +100,000 net contracts for 10 consecutive weeks, and for 30 out of the last 34 weeks as well. The Euro exchange rate this week dipped slightly for a second consecutive week and closed out the week around the 1.1840 exchange level. Last week, however, the Euro hit its highest level since 2021 with a high around 1.2110 before retreating. We’ll see in the weeks to come if the Euro will threaten the 1.20 psychological threshold once again.
Next up, the Australian Dollar speculative bets surged higher for a second consecutive week, and are now in an overall bullish position also for a second straight week. Last week marked the first time since December of 2024 that the Australian Dollar speculative position was in bullish territory. And this week, the position grew further. The Australian Dollar exchange rate has risen for three consecutive weeks, and this week closed at the highest levels since 2023, where it closed above the 0.700 significant psychological level. The Australian Dollar is up by over 5% against the U.S. Dollar this year so far, and is higher by about 14% since the start of 2025. The weekly RSI for the Australian Dollar is currently in overbought position so we’ll see if the Aussie can hold these multi-year high levels.
The Canadian Dollar speculator positions rose for a third consecutive week, as well as the eighth time in the last ten weeks that speculator bets have been bullish. Overall, the net standing for the Canadian Dollar speculators this week went bullish with a total of 2,130 net contracts. This is the first time the Canadian Dollar has seen a bullish net contract level since August 1st of 2023, a span of 131 straight weeks. The turnaround in the Canadian Dollar speculator positions has been fast and furious as the net position totaled a -130,600 contracts as recently as December 9th. And then eight weeks later, the net position has managed to turn bullish. In the foreign exchange markets, the Canadian Dollar trades right around its 200-week moving average at the 0.7333 exchange rate. This week, the CAD fell a little bit, but has been higher in total over the past three weeks. Time will tell if the CAD can break through its 200-weekly moving average level and can work its way back to the strong support and resistance level of 0.7500.
The US Dollar Index saw improving bets for the second consecutive week and for the ninth time out of the last 10 weeks. This has taken the speculator level from a total of -16,347 net contracts down to a tiny bearish level of just -852 net contracts this week. Overall, the Dollar Index has consistently been in a bearish level dating back to June 10th of 2025, a span of 34 consecutive weeks. In the foreign exchange market, the US Dollar Index saw a boost this week after falling for the previous two weeks and trades at the 97.50 level. Since the beginning of 2025, the Dollar Index has fallen by over 10%, however, prices have bounced off the 96.00 area three times since June. We’ll see if the Dollar Index can hold this level and can find its way higher or will eventually break lower.
Finally, the Swiss Franc positions rose modestly for a third consecutive week and for the fourth time out of the past five weeks. Interestingly, the Swiss Franc speculator net position is highly bearish and has been in an overall bearish level dating all the way back to September of 2021 while the Swiss Franc exchange rate is at the strongest levels it has traded since 2011. The dichotomy in the speculator positions versus the strength of the currency can be explained through hedging, as there has been reports that many business entities are hedging away the historic strength of the Swiss Franc at the current time while the Franc is also a sought-after safe haven in an uncertain geopolitical time. Currently, the Swiss Franc trades at 1.2946 against the U.S. Dollar in the exchange markets. Since the beginning of 2025, the Franc is up by approximately 18% against the U.S. Dollar and looks to be threatening the 1.30 major level.
Mexican Peso leads Currency Price Returns this week
The major currency markets price performance was led by the Mexican Peso this week. The Peso was the highest riser by 1.25% over the past five days. The Brazilian Real followed that up with a 0.99% gain. The Australian Dollar was higher by 0.79%. The US Dollar Index showed a 0.60% rise. The New Zealand Dollar was virtually unchanged at a 0.04% dip, followed by the euro which fell by 0.26%. The Canadian Dollar was lower by 0.28%. The Swiss Franc fell by 0.30%. The British Pound was lower by 0.48%. The Japanese Yen was lower by over 1% with a 1.48% decrease.
Bitcoin was the biggest loser on the week with a 16.45% drop.
Currencies Data:
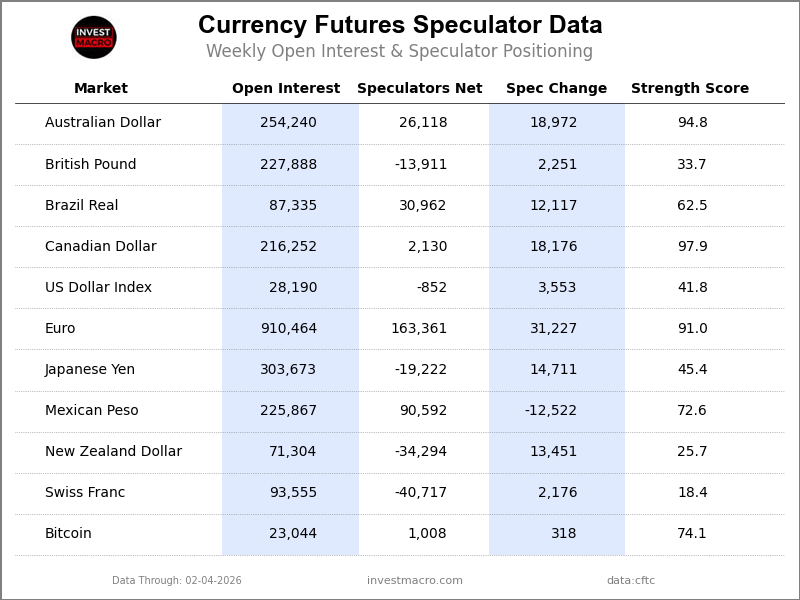
Legend: Open Interest | Speculators Current Net Position | Weekly Specs Change | Specs Strength Score compared to last 3-Years (0-100 range)
Strength Scores led by Canadian Dollar & Australian Dollar
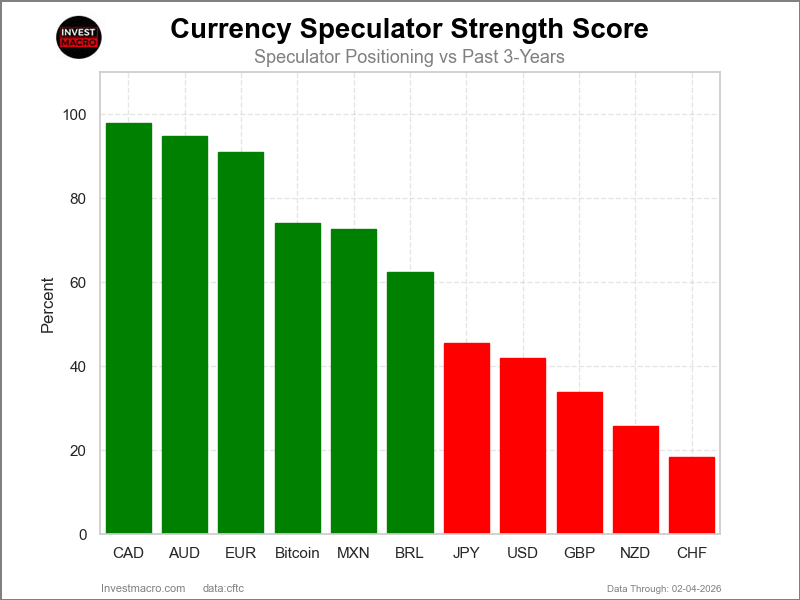
COT Strength Scores (a normalized measure of Speculator positions over a 3-Year range, from 0 to 100 where above 80 is Extreme-Bullish and below 20 is Extreme-Bearish) showed that the Canadian Dollar (98 percent) and the Australian Dollar (95 percent) lead the currency markets this week. The EuroFX (91 percent), Bitcoin (74 percent) and the Mexican Peso (73 percent) come in as the next highest in the weekly strength scores.
On the downside, the Swiss Franc (18 percent) comes in at the lowest strength levels currently and are in Extreme-Bearish territory (below 20 percent). The next lowest strength scores are the the New Zealand Dollar (26 percent), the British Pound (34 percent) and the US Dollar Index (42 percent).
3-Year Strength Statistics:
US Dollar Index (41.8 percent) vs US Dollar Index previous week (32.2 percent)
EuroFX (91.0 percent) vs EuroFX previous week (79.1 percent)
British Pound Sterling (33.7 percent) vs British Pound Sterling previous week (32.7 percent)
Japanese Yen (45.4 percent) vs Japanese Yen previous week (41.4 percent)
Swiss Franc (18.4 percent) vs Swiss Franc previous week (14.0 percent)
Canadian Dollar (97.9 percent) vs Canadian Dollar previous week (88.9 percent)
Australian Dollar (94.8 percent) vs Australian Dollar previous week (81.4 percent)
New Zealand Dollar (25.7 percent) vs New Zealand Dollar previous week (10.3 percent)
Mexican Peso (72.6 percent) vs Mexican Peso previous week (79.6 percent)
Brazilian Real (62.5 percent) vs Brazilian Real previous week (53.6 percent)
Bitcoin (74.1 percent) vs Bitcoin previous week (67.3 percent)
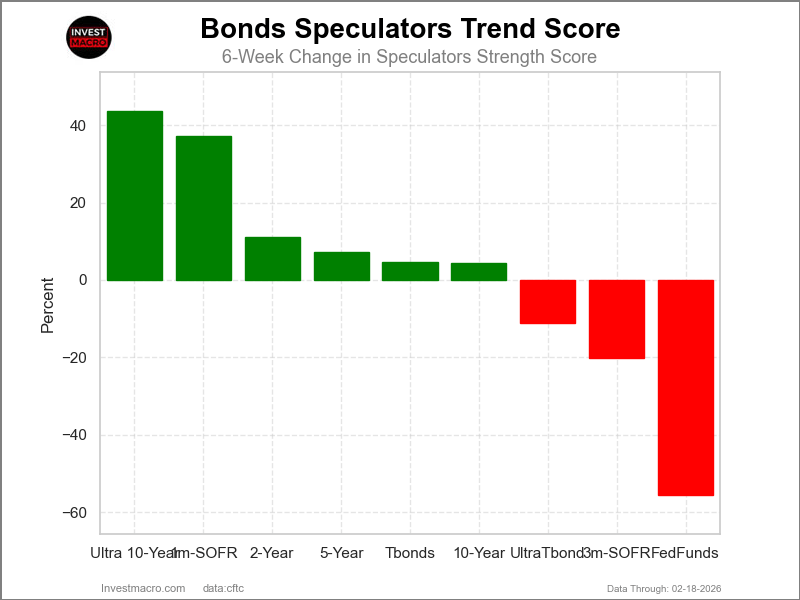
Australian Dollar & Bitcoin top the 6-Week Strength Trends
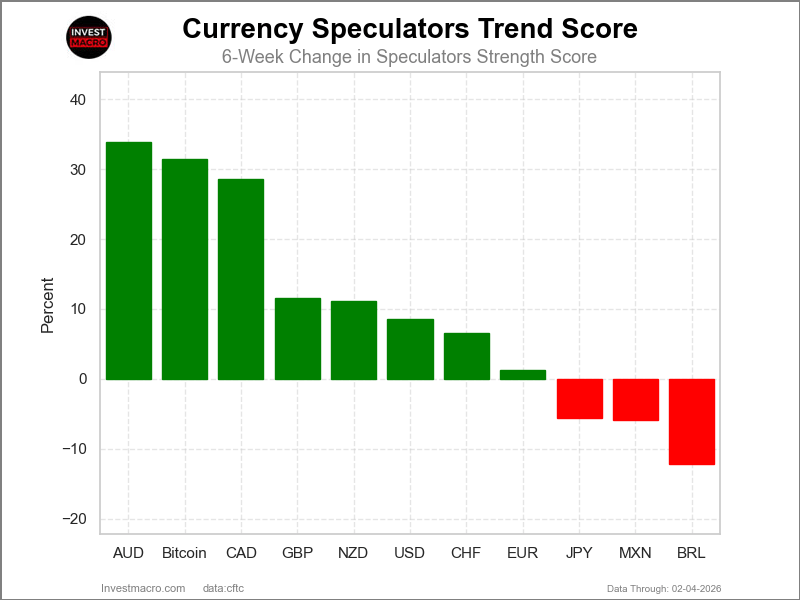
COT Strength Score Trends (or move index, calculates the 6-week changes in strength scores) showed that the Australian Dollar (34 percent) and the Bitcoin (32 percent) lead the past six weeks trends for the currencies. The Canadian Dollar (29 percent), the British Pound (12 percent) and the New Zealand Dollar (11 percent) are the next highest positive movers in the 3-Year trends data.
The Brazilian Real (-12 percent) leads the downside trend scores currently with the Mexican Peso (-6 percent), Japanese Yen (-6 percent) and the EuroFX (1 percent) following next with lower trend scores.
3-Year Strength Trends:
US Dollar Index (8.6 percent) vs US Dollar Index previous week (0.5 percent)
EuroFX (1.3 percent) vs EuroFX previous week (-4.9 percent)
British Pound Sterling (11.6 percent) vs British Pound Sterling previous week (13.7 percent)
Japanese Yen (-5.6 percent) vs Japanese Yen previous week (-8.5 percent)
Swiss Franc (6.6 percent) vs Swiss Franc previous week (-8.1 percent)
Canadian Dollar (28.6 percent) vs Canadian Dollar previous week (34.8 percent)
Australian Dollar (33.9 percent) vs Australian Dollar previous week (20.6 percent)
New Zealand Dollar (11.1 percent) vs New Zealand Dollar previous week (0.3 percent)
Mexican Peso (-5.9 percent) vs Mexican Peso previous week (8.9 percent)
Brazilian Real (-12.2 percent) vs Brazilian Real previous week (-21.2 percent)
Bitcoin (31.5 percent) vs Bitcoin previous week (12.4 percent)
Individual COT Forex Markets:
US Dollar Index Futures:
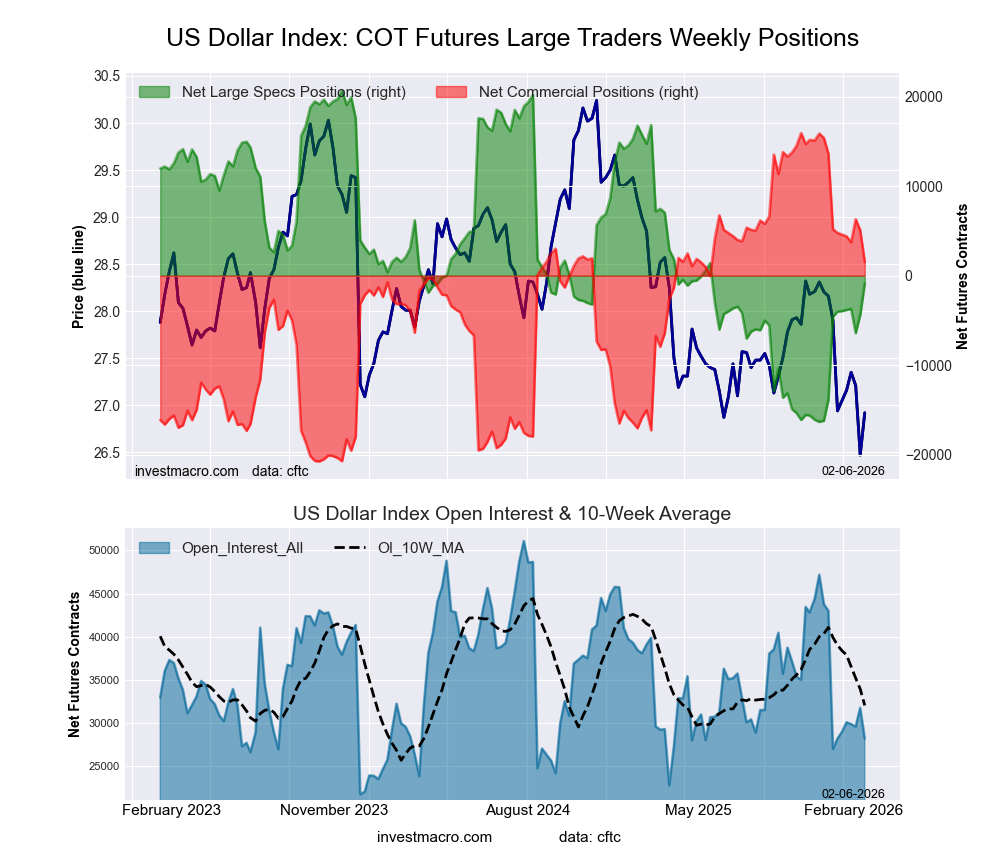 The US Dollar Index large speculator standing this week recorded a net position of -852 contracts in the data reported through Tuesday. This was a weekly gain of 3,553 contracts from the previous week which had a total of -4,405 net contracts.
This week’s current strength score (the trader positioning range over the past three years, measured from 0 to 100) shows the speculators are currently Bearish with a score of 41.8 percent. The commercials are Bullish with a score of 60.7 percent and the small traders (not shown in chart) are Bearish with a score of 23.3 percent.
Price Trend-Following Model: Strong Downtrend
Our weekly trend-following model classifies the current market price position as: Strong Downtrend.
| US DOLLAR INDEX Statistics | SPECULATORS | COMMERCIALS | SMALL TRADERS |
| – Percent of Open Interest Longs: | 58.9 | 25.7 | 7.8 |
| – Percent of Open Interest Shorts: | 61.9 | 20.3 | 10.2 |
| – Net Position: | -852 | 1,529 | -677 |
| – Gross Longs: | 16,610 | 7,239 | 2,188 |
| – Gross Shorts: | 17,462 | 5,710 | 2,865 |
| – Long to Short Ratio: | 1.0 to 1 | 1.3 to 1 | 0.8 to 1 |
| NET POSITION TREND: | | | |
| – Strength Index Score (3 Year Range Pct): | 41.8 | 60.7 | 23.3 |
| – Strength Index Reading (3 Year Range): | Bearish | Bullish | Bearish |
| NET POSITION MOVEMENT INDEX: | | | |
| – 6-Week Change in Strength Index: | 8.6 | -8.8 | 1.2 |
Euro Currency Futures:
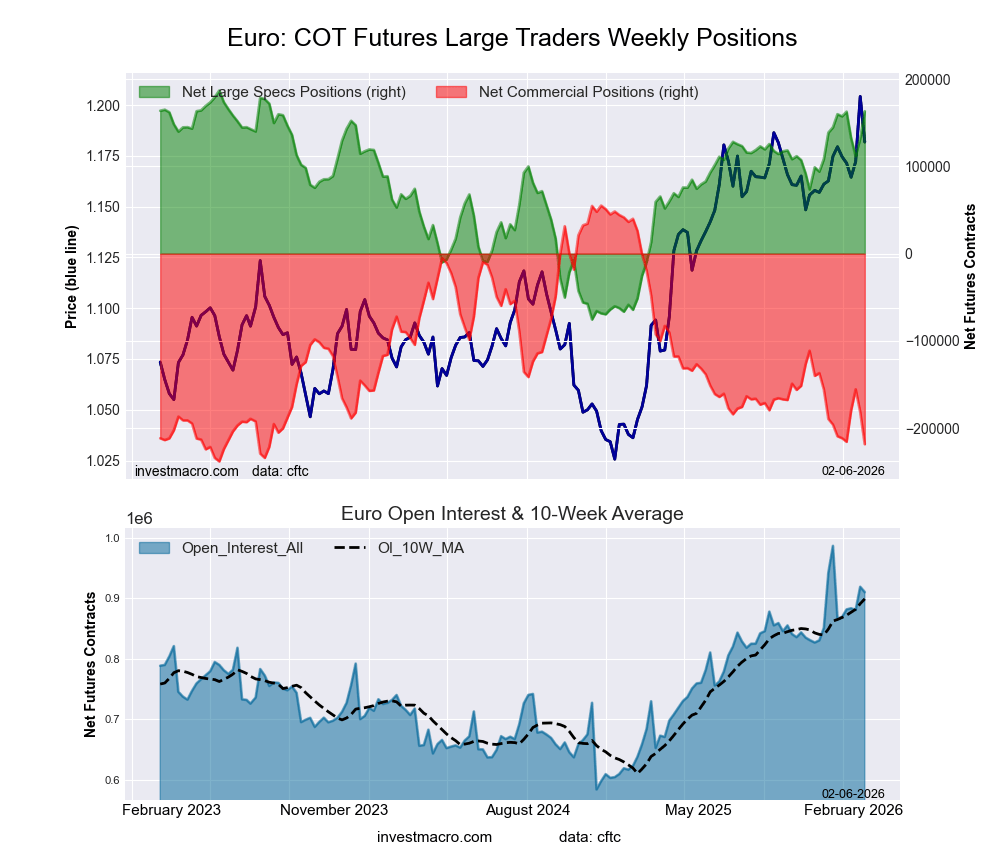 The Euro Currency large speculator standing this week recorded a net position of 163,361 contracts in the data reported through Tuesday. This was a weekly lift of 31,227 contracts from the previous week which had a total of 132,134 net contracts.
This week’s current strength score (the trader positioning range over the past three years, measured from 0 to 100) shows the speculators are currently Bullish-Extreme with a score of 91.0 percent. The commercials are Bearish-Extreme with a score of 6.7 percent and the small traders (not shown in chart) are Bullish-Extreme with a score of 91.0 percent.
Price Trend-Following Model: Strong Uptrend
Our weekly trend-following model classifies the current market price position as: Strong Uptrend.
| EURO Currency Statistics | SPECULATORS | COMMERCIALS | SMALL TRADERS |
| – Percent of Open Interest Longs: | 33.2 | 53.1 | 10.2 |
| – Percent of Open Interest Shorts: | 15.3 | 77.2 | 4.2 |
| – Net Position: | 163,361 | -218,541 | 55,180 |
| – Gross Longs: | 302,301 | 483,911 | 93,181 |
| – Gross Shorts: | 138,940 | 702,452 | 38,001 |
| – Long to Short Ratio: | 2.2 to 1 | 0.7 to 1 | 2.5 to 1 |
| NET POSITION TREND: | | | |
| – Strength Index Score (3 Year Range Pct): | 91.0 | 6.7 | 91.0 |
| – Strength Index Reading (3 Year Range): | Bullish-Extreme | Bearish-Extreme | Bullish-Extreme |
| NET POSITION MOVEMENT INDEX: | | | |
| – 6-Week Change in Strength Index: | 1.3 | -3.1 | 11.8 |
British Pound Sterling Futures:
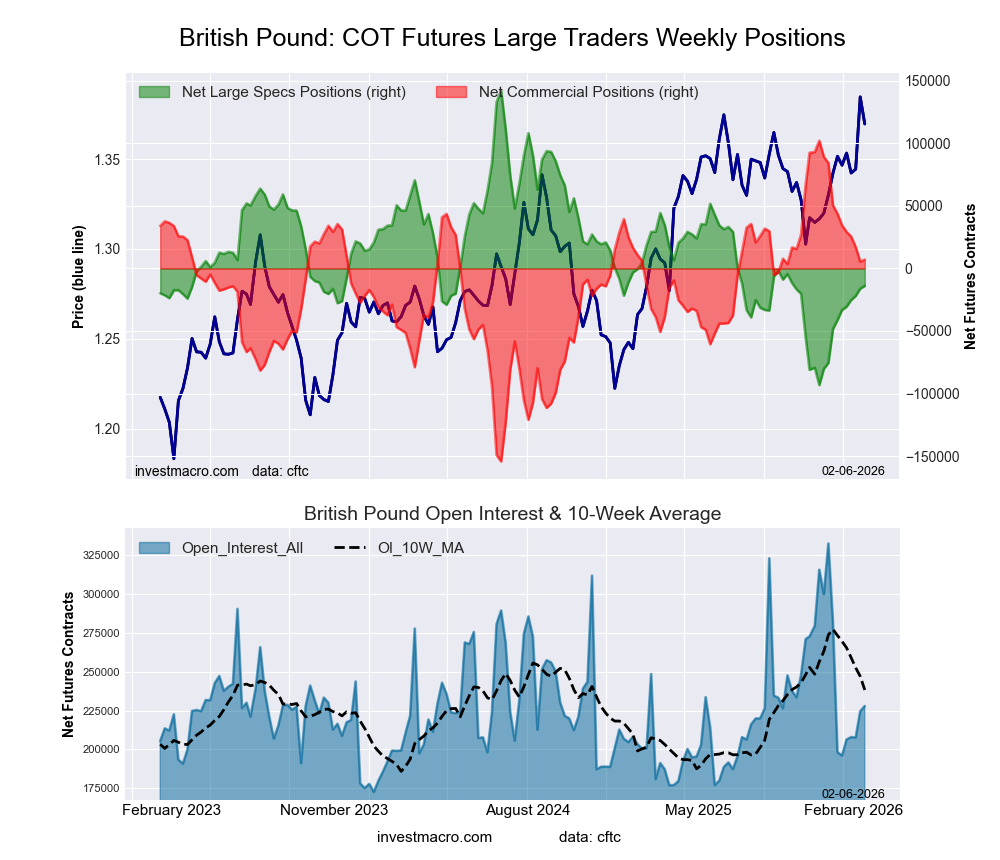 The British Pound Sterling large speculator standing this week recorded a net position of -13,911 contracts in the data reported through Tuesday. This was a weekly boost of 2,251 contracts from the previous week which had a total of -16,162 net contracts.
This week’s current strength score (the trader positioning range over the past three years, measured from 0 to 100) shows the speculators are currently Bearish with a score of 33.7 percent. The commercials are Bullish with a score of 63.0 percent and the small traders (not shown in chart) are Bullish with a score of 71.0 percent.
Price Trend-Following Model: Strong Uptrend
Our weekly trend-following model classifies the current market price position as: Strong Uptrend.
| BRITISH POUND Statistics | SPECULATORS | COMMERCIALS | SMALL TRADERS |
| – Percent of Open Interest Longs: | 41.6 | 42.1 | 15.0 |
| – Percent of Open Interest Shorts: | 47.7 | 39.0 | 12.0 |
| – Net Position: | -13,911 | 7,064 | 6,847 |
| – Gross Longs: | 94,893 | 96,004 | 34,151 |
| – Gross Shorts: | 108,804 | 88,940 | 27,304 |
| – Long to Short Ratio: | 0.9 to 1 | 1.1 to 1 | 1.3 to 1 |
| NET POSITION TREND: | | | |
| – Strength Index Score (3 Year Range Pct): | 33.7 | 63.0 | 71.0 |
| – Strength Index Reading (3 Year Range): | Bearish | Bullish | Bullish |
| NET POSITION MOVEMENT INDEX: | | | |
| – 6-Week Change in Strength Index: | 11.6 | -14.3 | 24.2 |
Japanese Yen Futures:
 The Japanese Yen large speculator standing this week recorded a net position of -19,222 contracts in the data reported through Tuesday. This was a weekly rise of 14,711 contracts from the previous week which had a total of -33,933 net contracts.
This week’s current strength score (the trader positioning range over the past three years, measured from 0 to 100) shows the speculators are currently Bearish with a score of 45.4 percent. The commercials are Bullish with a score of 54.6 percent and the small traders (not shown in chart) are Bearish with a score of 49.3 percent.
Price Trend-Following Model: Downtrend
Our weekly trend-following model classifies the current market price position as: Downtrend.
| JAPANESE YEN Statistics | SPECULATORS | COMMERCIALS | SMALL TRADERS |
| – Percent of Open Interest Longs: | 37.7 | 40.4 | 12.9 |
| – Percent of Open Interest Shorts: | 44.0 | 35.6 | 11.3 |
| – Net Position: | -19,222 | 14,417 | 4,805 |
| – Gross Longs: | 114,428 | 122,665 | 39,140 |
| – Gross Shorts: | 133,650 | 108,248 | 34,335 |
| – Long to Short Ratio: | 0.9 to 1 | 1.1 to 1 | 1.1 to 1 |
| NET POSITION TREND: | | | |
| – Strength Index Score (3 Year Range Pct): | 45.4 | 54.6 | 49.3 |
| – Strength Index Reading (3 Year Range): | Bearish | Bullish | Bearish |
| NET POSITION MOVEMENT INDEX: | | | |
| – 6-Week Change in Strength Index: | -5.6 | 5.1 | 0.3 |
Swiss Franc Futures:
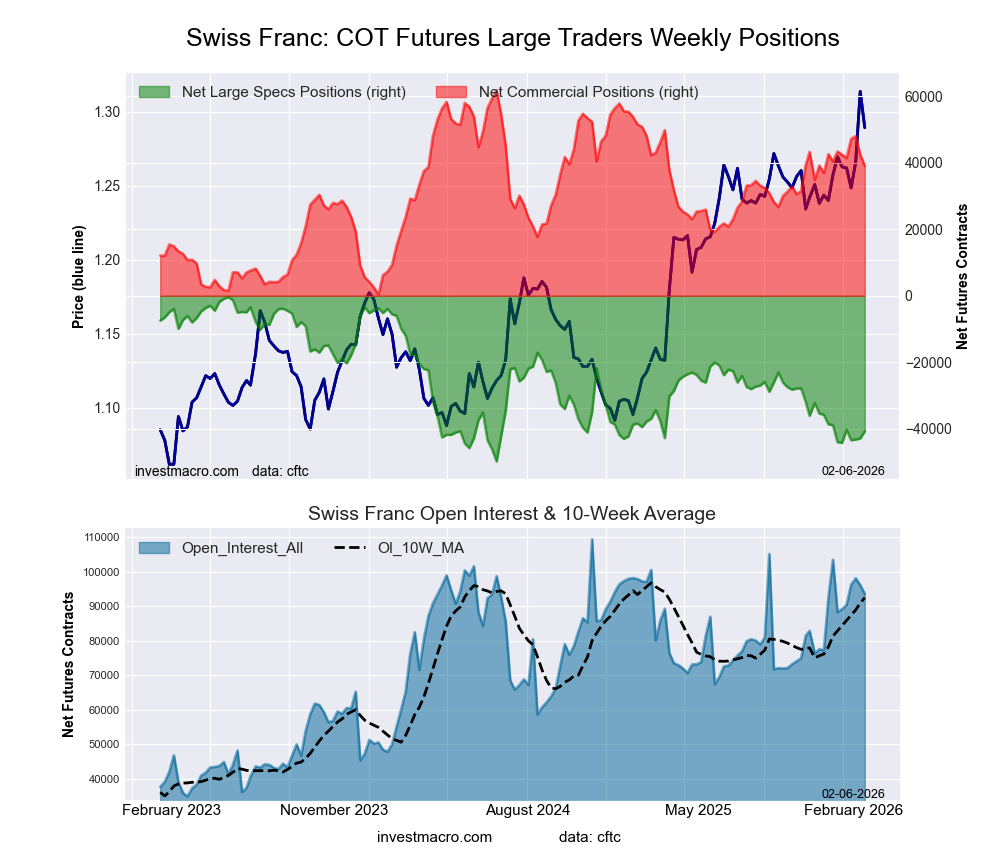 The Swiss Franc large speculator standing this week recorded a net position of -40,717 contracts in the data reported through Tuesday. This was a weekly advance of 2,176 contracts from the previous week which had a total of -42,893 net contracts.
This week’s current strength score (the trader positioning range over the past three years, measured from 0 to 100) shows the speculators are currently Bearish-Extreme with a score of 18.4 percent. The commercials are Bullish with a score of 63.1 percent and the small traders (not shown in chart) are Bullish-Extreme with a score of 86.0 percent.
Price Trend-Following Model: Strong Uptrend
Our weekly trend-following model classifies the current market price position as: Strong Uptrend.
| SWISS FRANC Statistics | SPECULATORS | COMMERCIALS | SMALL TRADERS |
| – Percent of Open Interest Longs: | 10.4 | 69.9 | 19.1 |
| – Percent of Open Interest Shorts: | 53.9 | 28.2 | 17.3 |
| – Net Position: | -40,717 | 39,012 | 1,705 |
| – Gross Longs: | 9,687 | 65,424 | 17,858 |
| – Gross Shorts: | 50,404 | 26,412 | 16,153 |
| – Long to Short Ratio: | 0.2 to 1 | 2.5 to 1 | 1.1 to 1 |
| NET POSITION TREND: | | | |
| – Strength Index Score (3 Year Range Pct): | 18.4 | 63.1 | 86.0 |
| – Strength Index Reading (3 Year Range): | Bearish-Extreme | Bullish | Bullish-Extreme |
| NET POSITION MOVEMENT INDEX: | | | |
| – 6-Week Change in Strength Index: | 6.6 | -7.1 | 4.5 |
Canadian Dollar Futures:
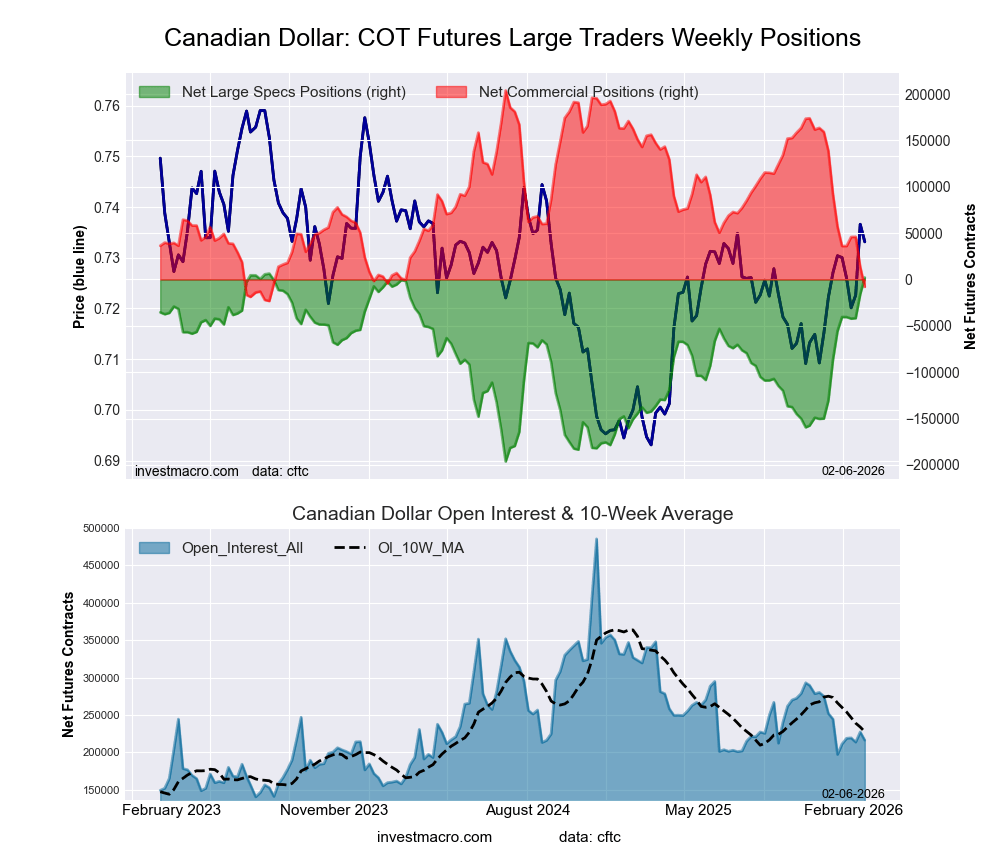 The Canadian Dollar large speculator standing this week recorded a net position of 2,130 contracts in the data reported through Tuesday. This was a weekly gain of 18,176 contracts from the previous week which had a total of -16,046 net contracts.
This week’s current strength score (the trader positioning range over the past three years, measured from 0 to 100) shows the speculators are currently Bullish-Extreme with a score of 97.9 percent. The commercials are Bearish-Extreme with a score of 6.8 percent and the small traders (not shown in chart) are Bullish with a score of 61.5 percent.
Price Trend-Following Model: Strong Uptrend
Our weekly trend-following model classifies the current market price position as: Strong Uptrend.
| CANADIAN DOLLAR Statistics | SPECULATORS | COMMERCIALS | SMALL TRADERS |
| – Percent of Open Interest Longs: | 35.8 | 48.1 | 14.4 |
| – Percent of Open Interest Shorts: | 34.8 | 51.8 | 11.8 |
| – Net Position: | 2,130 | -7,916 | 5,786 |
| – Gross Longs: | 77,397 | 104,119 | 31,230 |
| – Gross Shorts: | 75,267 | 112,035 | 25,444 |
| – Long to Short Ratio: | 1.0 to 1 | 0.9 to 1 | 1.2 to 1 |
| NET POSITION TREND: | | | |
| – Strength Index Score (3 Year Range Pct): | 97.9 | 6.8 | 61.5 |
| – Strength Index Reading (3 Year Range): | Bullish-Extreme | Bearish-Extreme | Bullish |
| NET POSITION MOVEMENT INDEX: | | | |
| – 6-Week Change in Strength Index: | 28.6 | -28.7 | 20.1 |
Australian Dollar Futures:
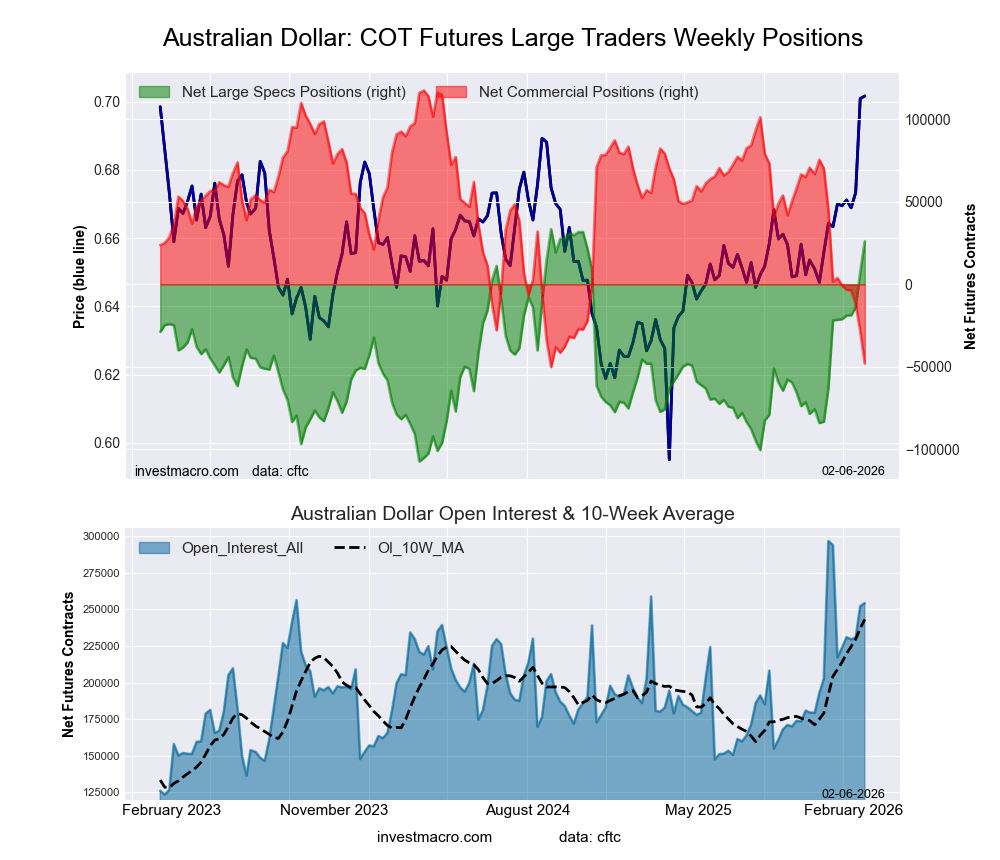 The Australian Dollar large speculator standing this week recorded a net position of 26,118 contracts in the data reported through Tuesday. This was a weekly boost of 18,972 contracts from the previous week which had a total of 7,146 net contracts.
This week’s current strength score (the trader positioning range over the past three years, measured from 0 to 100) shows the speculators are currently Bullish-Extreme with a score of 94.8 percent. The commercials are Bearish-Extreme with a score of 1.3 percent and the small traders (not shown in chart) are Bullish-Extreme with a score of 91.3 percent.
Price Trend-Following Model: Strong Uptrend
Our weekly trend-following model classifies the current market price position as: Strong Uptrend.
| AUSTRALIAN DOLLAR Statistics | SPECULATORS | COMMERCIALS | SMALL TRADERS |
| – Percent of Open Interest Longs: | 46.7 | 36.4 | 16.3 |
| – Percent of Open Interest Shorts: | 36.4 | 55.3 | 7.7 |
| – Net Position: | 26,118 | -48,060 | 21,942 |
| – Gross Longs: | 118,751 | 92,582 | 41,430 |
| – Gross Shorts: | 92,633 | 140,642 | 19,488 |
| – Long to Short Ratio: | 1.3 to 1 | 0.7 to 1 | 2.1 to 1 |
| NET POSITION TREND: | | | |
| – Strength Index Score (3 Year Range Pct): | 94.8 | 1.3 | 91.3 |
| – Strength Index Reading (3 Year Range): | Bullish-Extreme | Bearish-Extreme | Bullish-Extreme |
| NET POSITION MOVEMENT INDEX: | | | |
| – 6-Week Change in Strength Index: | 33.9 | -30.9 | 9.3 |
New Zealand Dollar Futures:
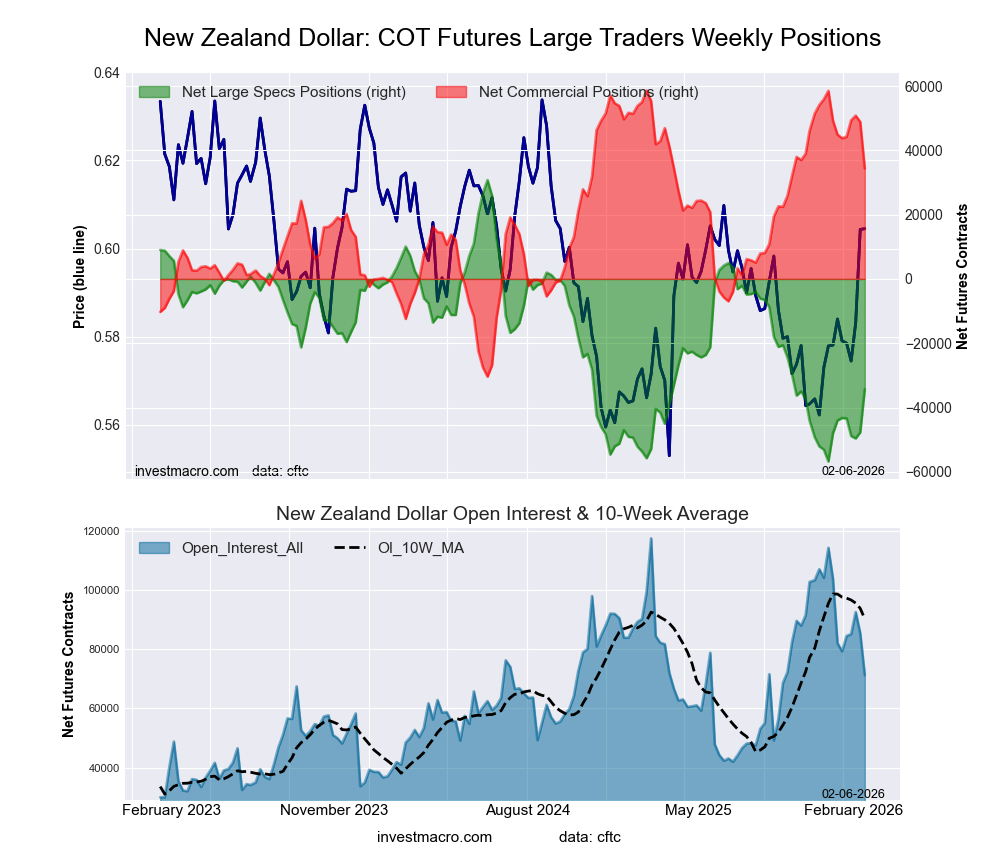 The New Zealand Dollar large speculator standing this week recorded a net position of -34,294 contracts in the data reported through Tuesday. This was a weekly gain of 13,451 contracts from the previous week which had a total of -47,745 net contracts.
This week’s current strength score (the trader positioning range over the past three years, measured from 0 to 100) shows the speculators are currently Bearish with a score of 25.7 percent. The commercials are Bullish with a score of 72.8 percent and the small traders (not shown in chart) are Bullish with a score of 51.3 percent.
Price Trend-Following Model: Strong Uptrend
Our weekly trend-following model classifies the current market price position as: Strong Uptrend.
| NEW ZEALAND DOLLAR Statistics | SPECULATORS | COMMERCIALS | SMALL TRADERS |
| – Percent of Open Interest Longs: | 16.7 | 76.6 | 5.6 |
| – Percent of Open Interest Shorts: | 64.8 | 28.4 | 5.7 |
| – Net Position: | -34,294 | 34,376 | -82 |
| – Gross Longs: | 11,883 | 54,596 | 3,988 |
| – Gross Shorts: | 46,177 | 20,220 | 4,070 |
| – Long to Short Ratio: | 0.3 to 1 | 2.7 to 1 | 1.0 to 1 |
| NET POSITION TREND: | | | |
| – Strength Index Score (3 Year Range Pct): | 25.7 | 72.8 | 51.3 |
| – Strength Index Reading (3 Year Range): | Bearish | Bullish | Bullish |
| NET POSITION MOVEMENT INDEX: | | | |
| – 6-Week Change in Strength Index: | 11.1 | -11.9 | 10.5 |
Mexican Peso Futures:
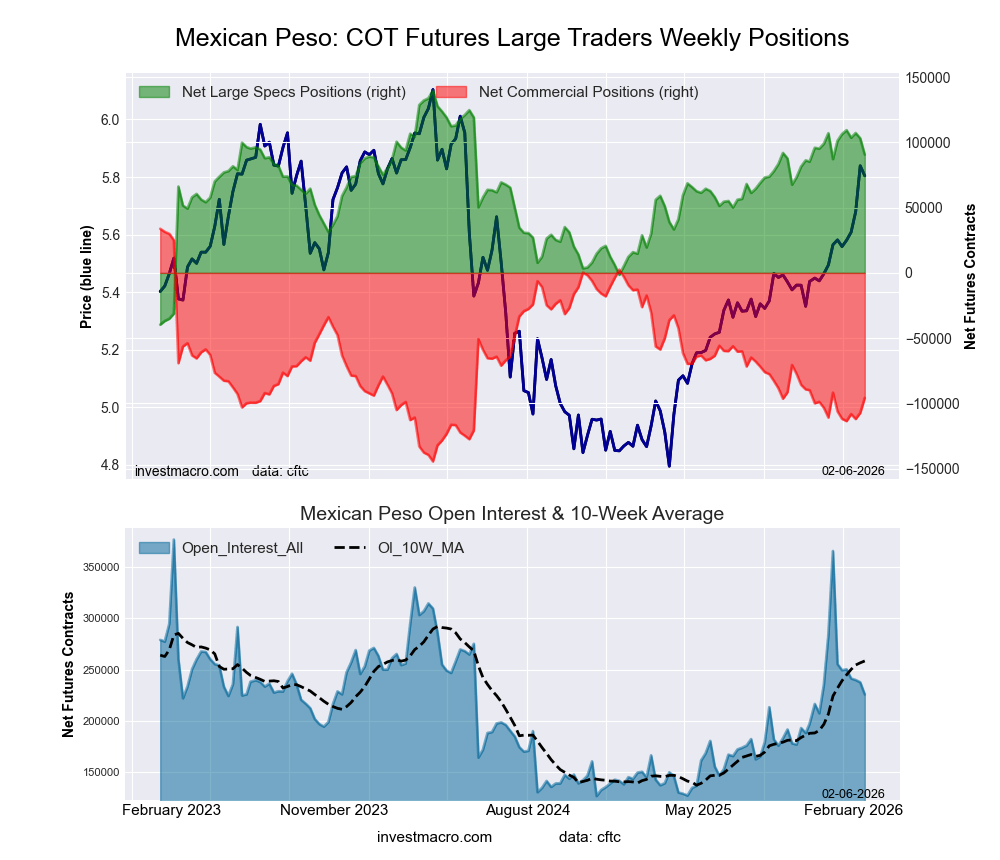 The Mexican Peso large speculator standing this week recorded a net position of 90,592 contracts in the data reported through Tuesday. This was a weekly lowering of -12,522 contracts from the previous week which had a total of 103,114 net contracts.
This week’s current strength score (the trader positioning range over the past three years, measured from 0 to 100) shows the speculators are currently Bullish with a score of 72.6 percent. The commercials are Bearish with a score of 27.3 percent and the small traders (not shown in chart) are Bullish with a score of 51.7 percent.
Price Trend-Following Model: Strong Uptrend
Our weekly trend-following model classifies the current market price position as: Strong Uptrend.
| MEXICAN PESO Statistics | SPECULATORS | COMMERCIALS | SMALL TRADERS |
| – Percent of Open Interest Longs: | 58.6 | 37.3 | 3.4 |
| – Percent of Open Interest Shorts: | 18.5 | 79.7 | 1.1 |
| – Net Position: | 90,592 | -95,803 | 5,211 |
| – Gross Longs: | 132,392 | 84,224 | 7,660 |
| – Gross Shorts: | 41,800 | 180,027 | 2,449 |
| – Long to Short Ratio: | 3.2 to 1 | 0.5 to 1 | 3.1 to 1 |
| NET POSITION TREND: | | | |
| – Strength Index Score (3 Year Range Pct): | 72.6 | 27.3 | 51.7 |
| – Strength Index Reading (3 Year Range): | Bullish | Bearish | Bullish |
| NET POSITION MOVEMENT INDEX: | | | |
| – 6-Week Change in Strength Index: | -5.9 | 5.7 | 1.9 |
Brazilian Real Futures:
 The Brazilian Real large speculator standing this week recorded a net position of 30,962 contracts in the data reported through Tuesday. This was a weekly lift of 12,117 contracts from the previous week which had a total of 18,845 net contracts.
This week’s current strength score (the trader positioning range over the past three years, measured from 0 to 100) shows the speculators are currently Bullish with a score of 62.5 percent. The commercials are Bearish with a score of 36.2 percent and the small traders (not shown in chart) are Bearish with a score of 44.4 percent.
Price Trend-Following Model: Strong Uptrend
Our weekly trend-following model classifies the current market price position as: Strong Uptrend.
| BRAZIL REAL Statistics | SPECULATORS | COMMERCIALS | SMALL TRADERS |
| – Percent of Open Interest Longs: | 65.5 | 28.0 | 5.9 |
| – Percent of Open Interest Shorts: | 30.1 | 68.2 | 1.1 |
| – Net Position: | 30,962 | -35,133 | 4,171 |
| – Gross Longs: | 57,232 | 24,421 | 5,163 |
| – Gross Shorts: | 26,270 | 59,554 | 992 |
| – Long to Short Ratio: | 2.2 to 1 | 0.4 to 1 | 5.2 to 1 |
| NET POSITION TREND: | | | |
| – Strength Index Score (3 Year Range Pct): | 62.5 | 36.2 | 44.4 |
| – Strength Index Reading (3 Year Range): | Bullish | Bearish | Bearish |
| NET POSITION MOVEMENT INDEX: | | | |
| – 6-Week Change in Strength Index: | -12.2 | 10.4 | 11.9 |
Bitcoin Futures:
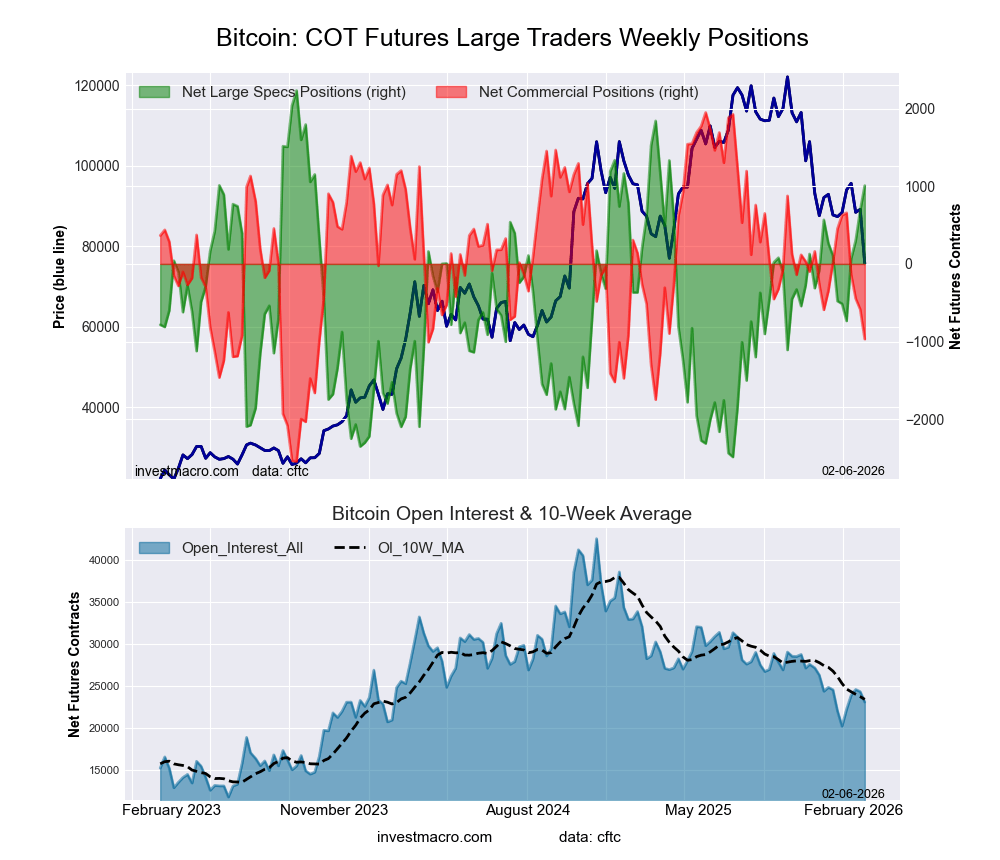 The Bitcoin large speculator standing this week recorded a net position of 1,008 contracts in the data reported through Tuesday. This was a weekly lift of 318 contracts from the previous week which had a total of 690 net contracts.
This week’s current strength score (the trader positioning range over the past three years, measured from 0 to 100) shows the speculators are currently Bullish with a score of 74.1 percent. The commercials are Bearish with a score of 35.1 percent and the small traders (not shown in chart) are Bearish with a score of 35.3 percent.
Price Trend-Following Model: Strong Downtrend
Our weekly trend-following model classifies the current market price position as: Strong Downtrend.
| BITCOIN Statistics | SPECULATORS | COMMERCIALS | SMALL TRADERS |
| – Percent of Open Interest Longs: | 82.2 | 2.3 | 5.0 |
| – Percent of Open Interest Shorts: | 77.8 | 6.5 | 5.2 |
| – Net Position: | 1,008 | -968 | -40 |
| – Gross Longs: | 18,939 | 521 | 1,151 |
| – Gross Shorts: | 17,931 | 1,489 | 1,191 |
| – Long to Short Ratio: | 1.1 to 1 | 0.3 to 1 | 1.0 to 1 |
| NET POSITION TREND: | | | |
| – Strength Index Score (3 Year Range Pct): | 74.1 | 35.1 | 35.3 |
| – Strength Index Reading (3 Year Range): | Bullish | Bearish | Bearish |
| NET POSITION MOVEMENT INDEX: | | | |
| – 6-Week Change in Strength Index: | 31.5 | -31.6 | -3.4 |
Article By InvestMacro – Receive our weekly COT Newsletter
*COT Report: The COT data, released weekly to the public each Friday, is updated through the most recent Tuesday (data is 3 days old) and shows a quick view of how large speculators or non-commercials (for-profit traders) were positioned in the futures markets.
The CFTC categorizes trader positions according to commercial hedgers (traders who use futures contracts for hedging as part of the business), non-commercials (large traders who speculate to realize trading profits) and nonreportable traders (usually small traders/speculators) as well as their open interest (contracts open in the market at time of reporting). See CFTC criteria here.

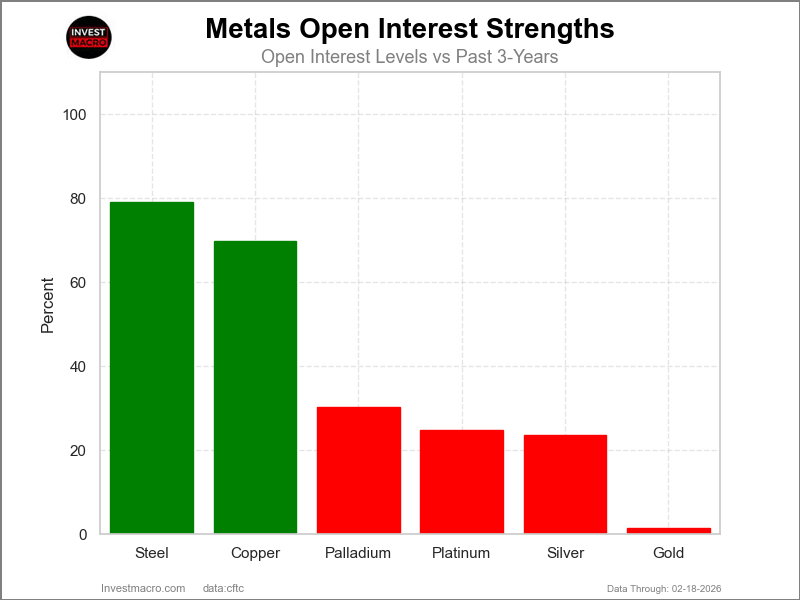
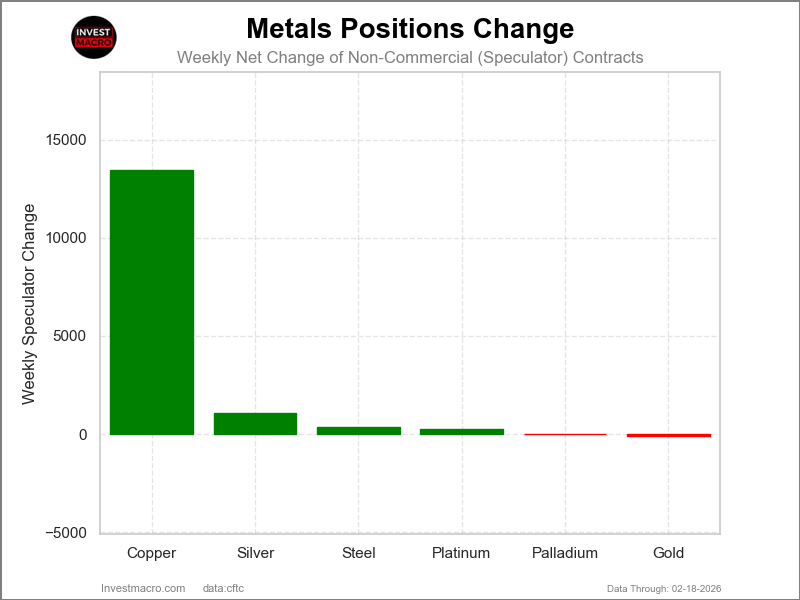

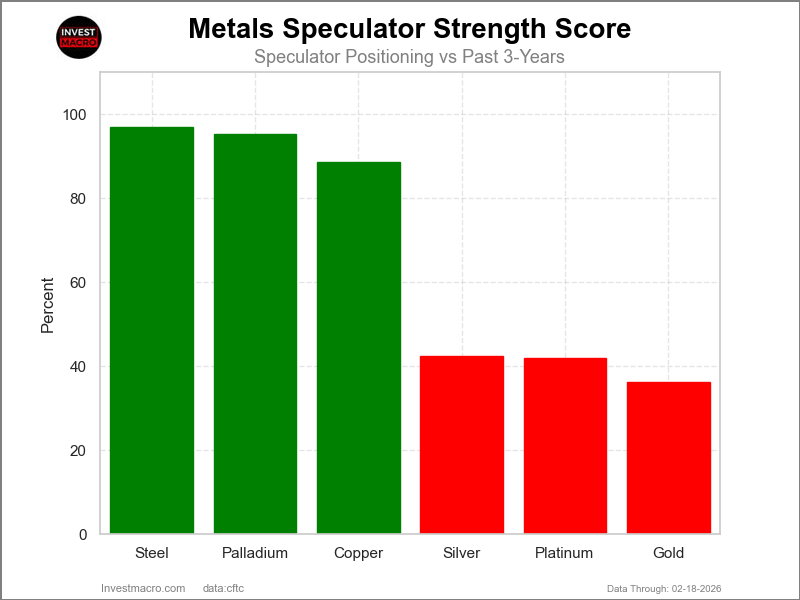
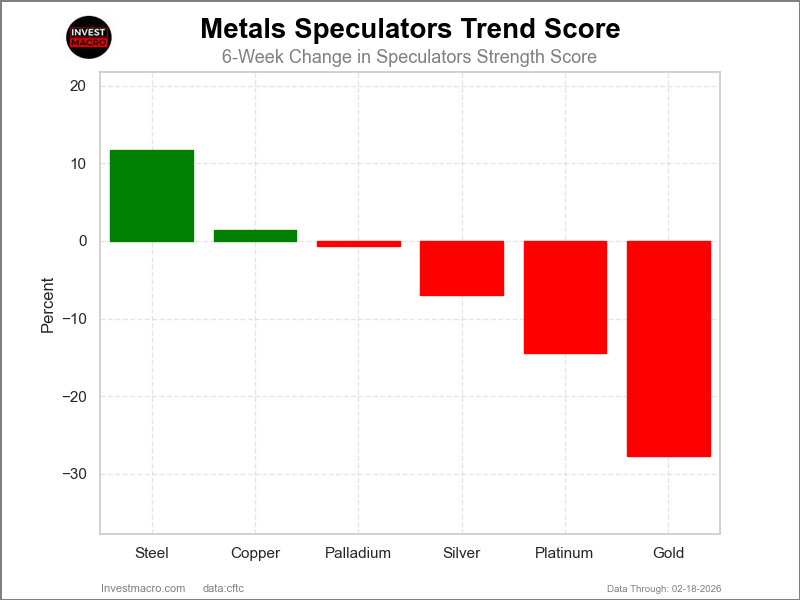
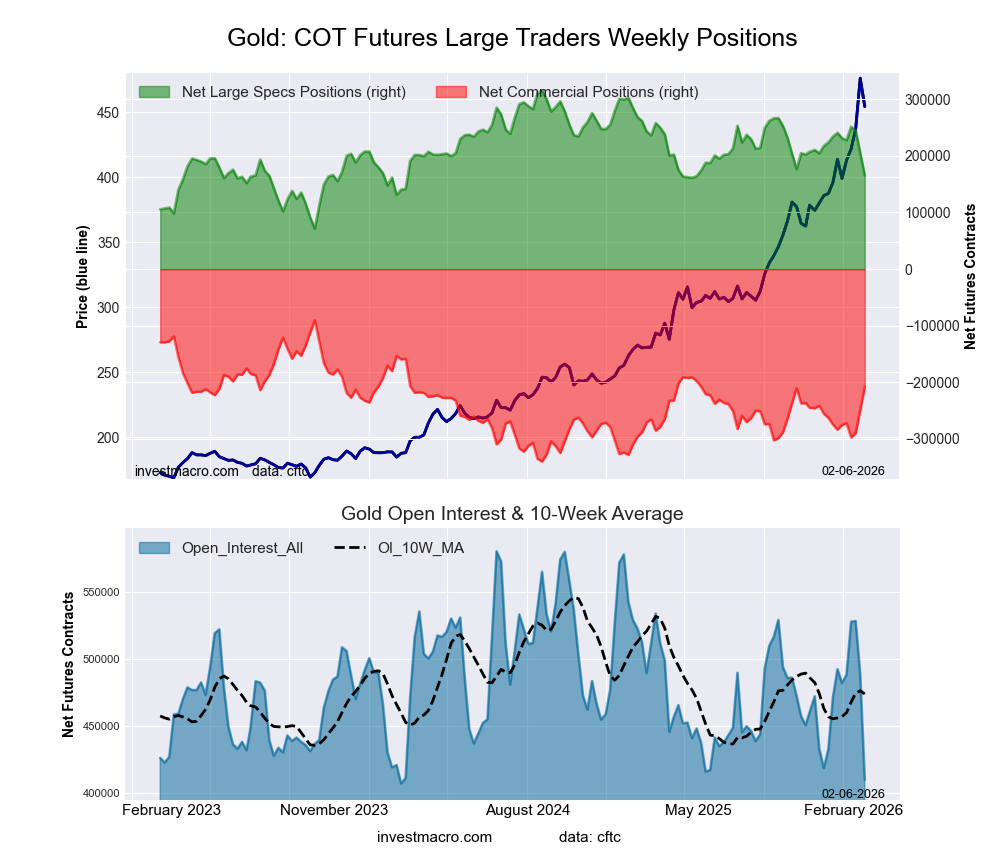
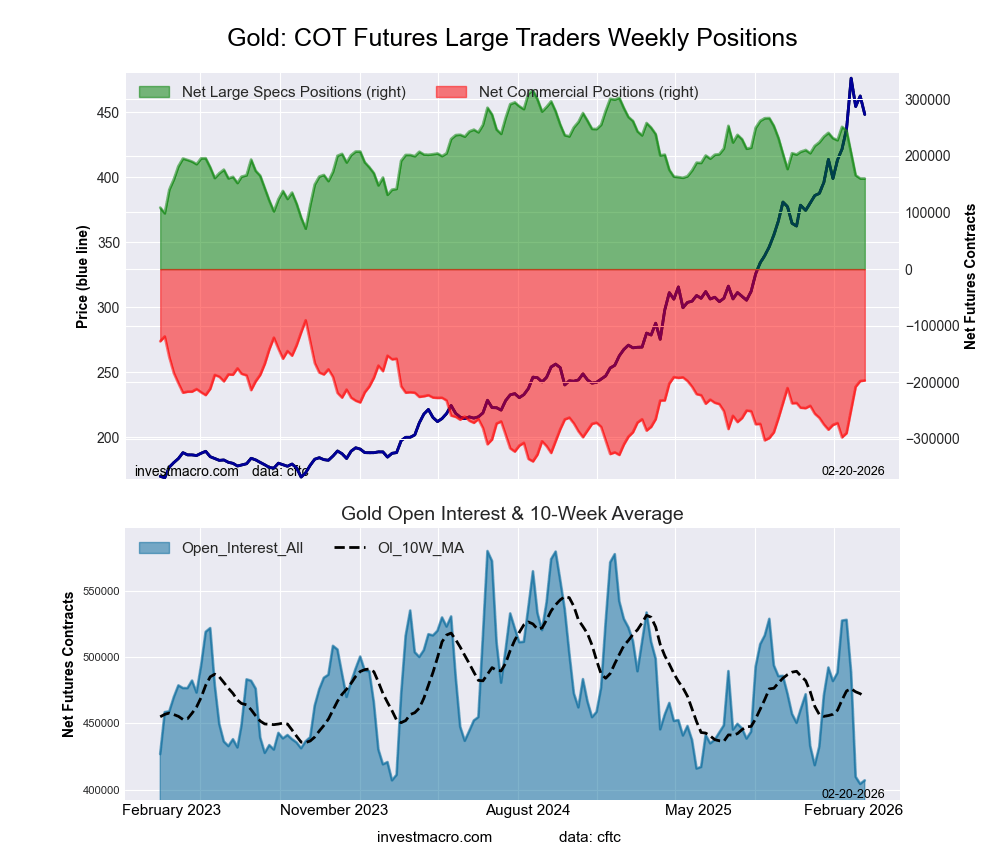 The Gold Comex Futures large speculator standing this week totaled a net position of 159,915 contracts in the data reported through Tuesday. This was a weekly decline of -97 contracts from the previous week which had a total of 160,012 net contracts.
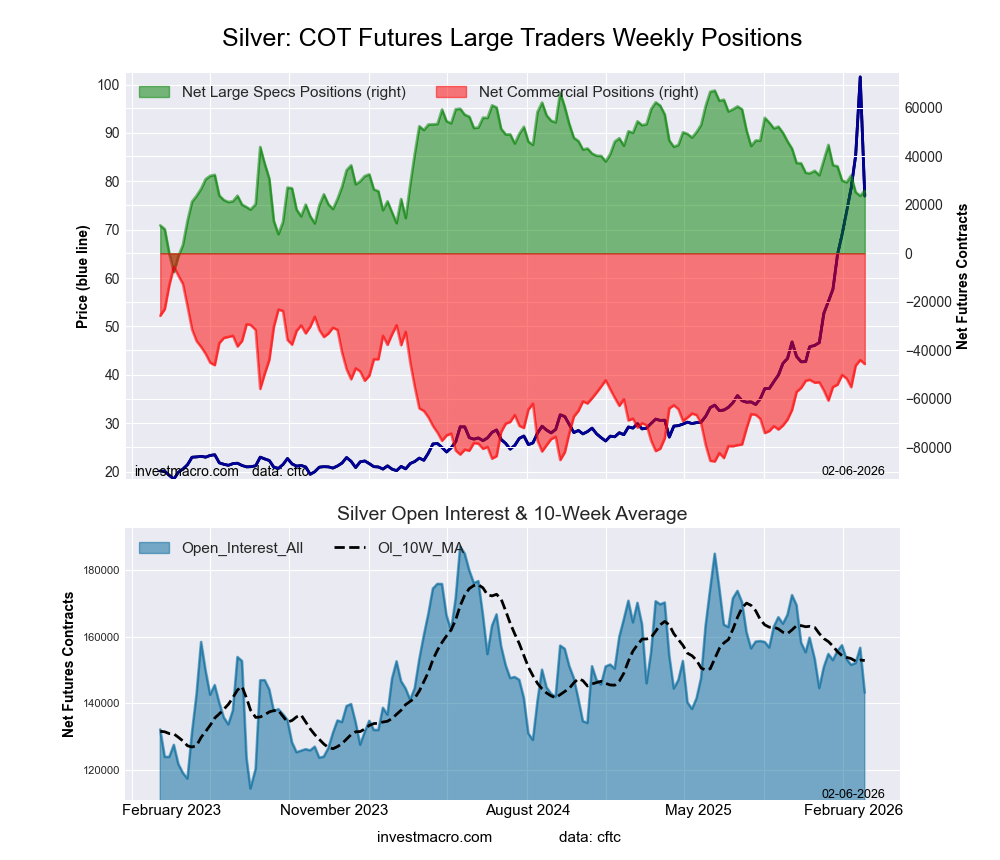
 The Silver Comex Futures large speculator standing this week totaled a net position of 24,003 contracts in the data reported through Tuesday. This was a weekly boost of 1,048 contracts from the previous week which had a total of 22,955 net contracts.
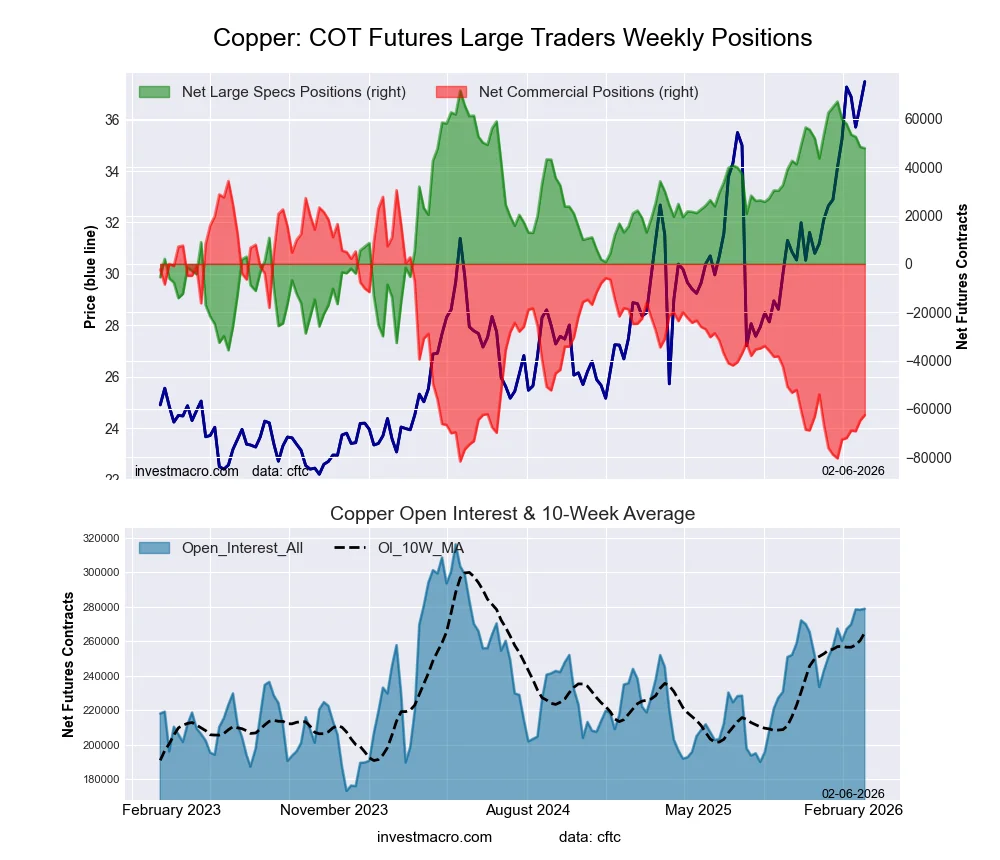
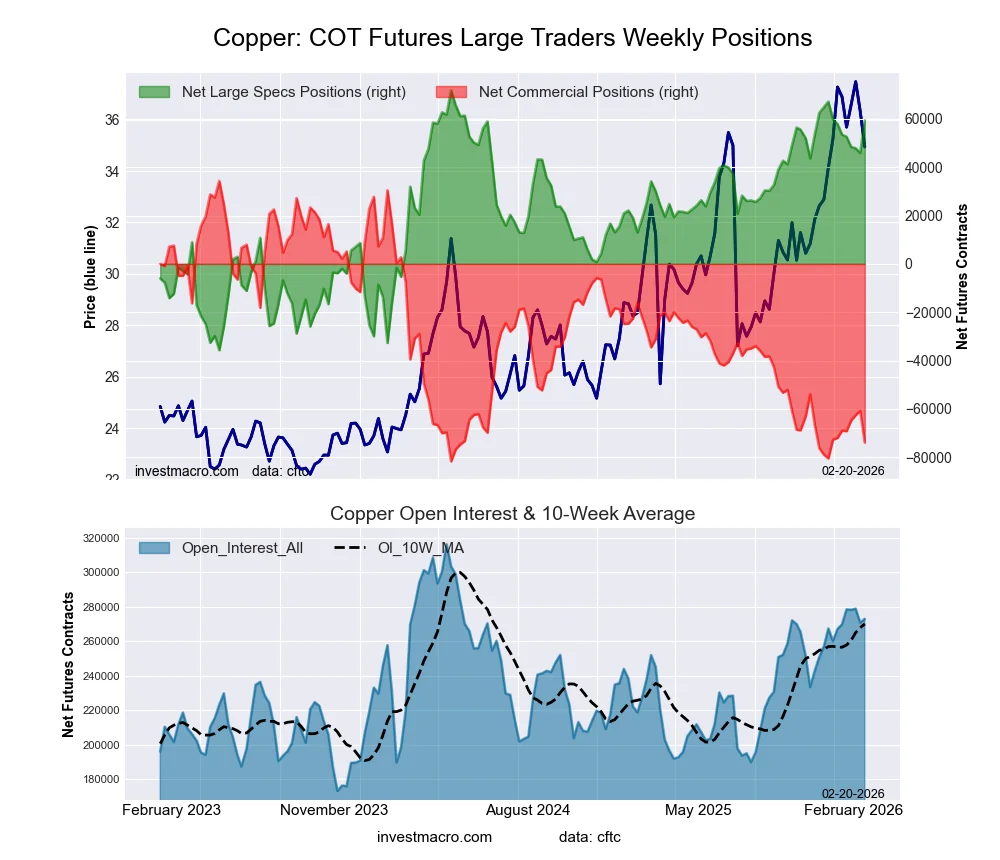 The Copper Grade #1 Futures large speculator standing this week totaled a net position of 59,331 contracts in the data reported through Tuesday. This was a weekly gain of 13,458 contracts from the previous week which had a total of 45,873 net contracts.
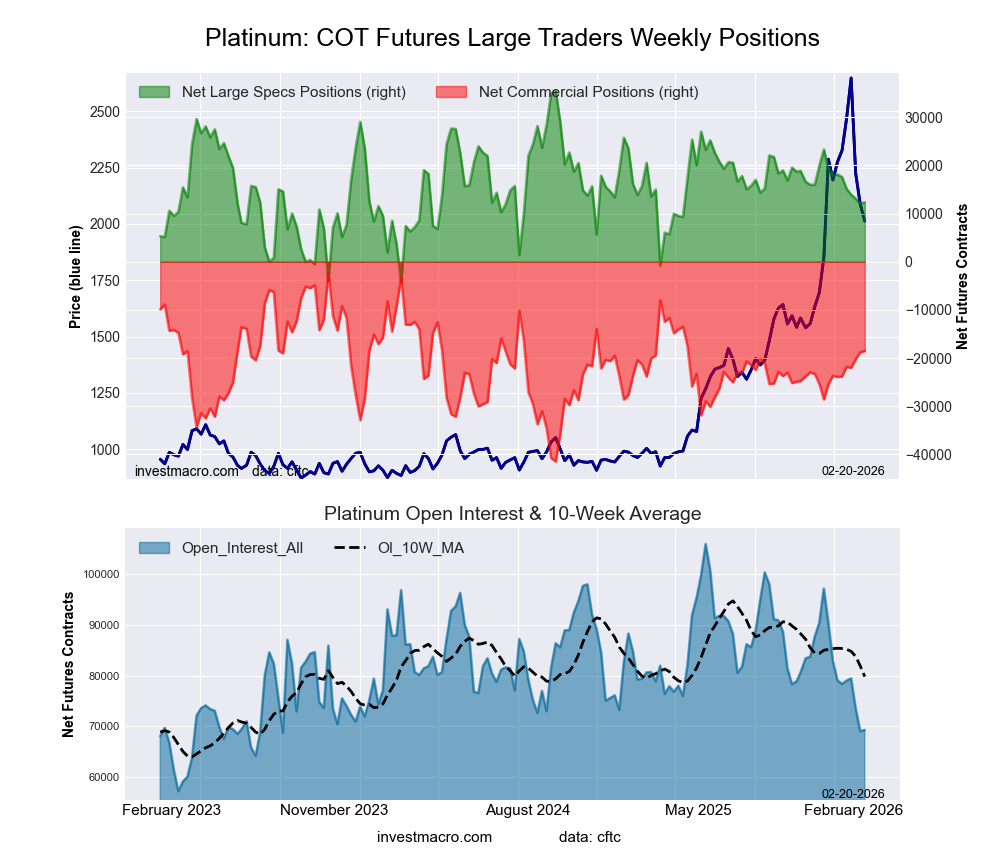 The Platinum Futures large speculator standing this week totaled a net position of 12,347 contracts in the data reported through Tuesday. This was a weekly rise of 263 contracts from the previous week which had a total of 12,084 net contracts.
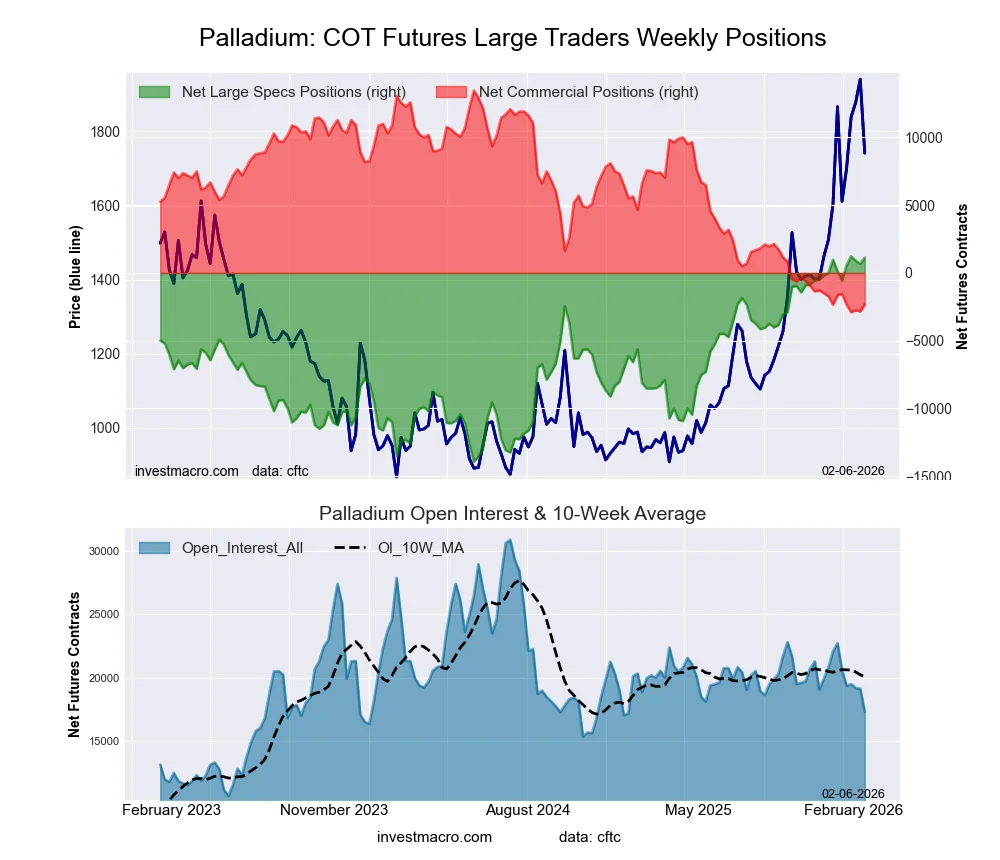
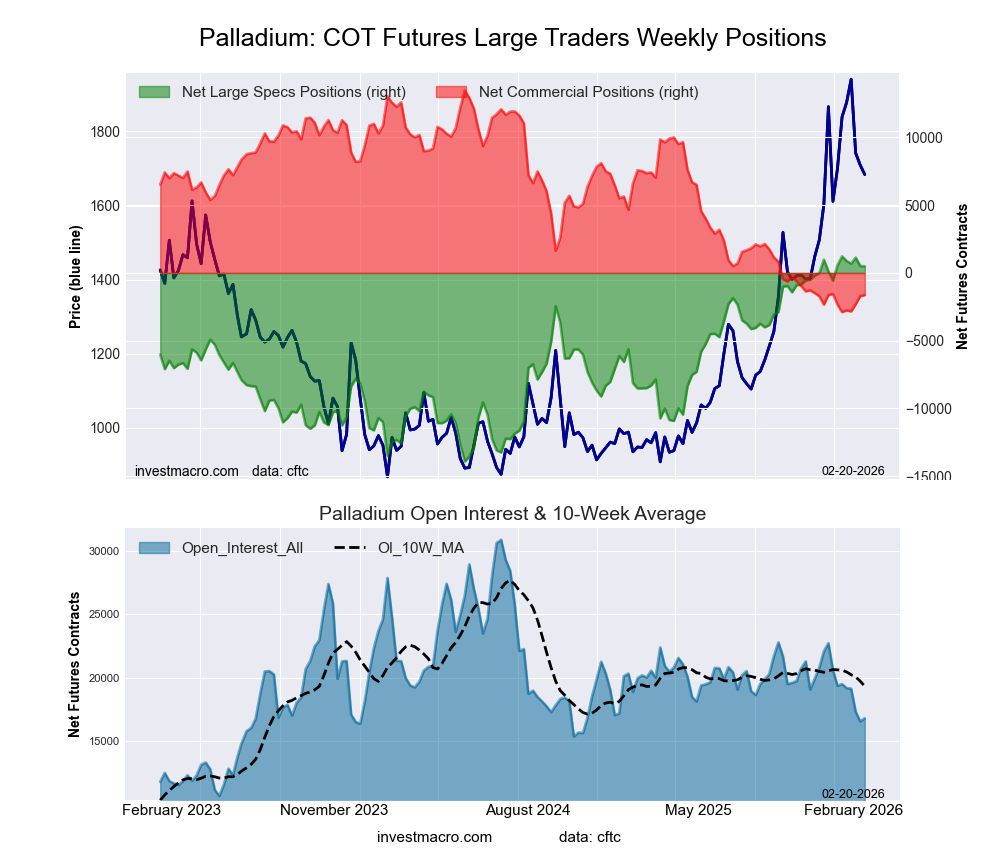 The Palladium Futures large speculator standing this week totaled a net position of 492 contracts in the data reported through Tuesday. This was a weekly reduction of -21 contracts from the previous week which had a total of 513 net contracts.
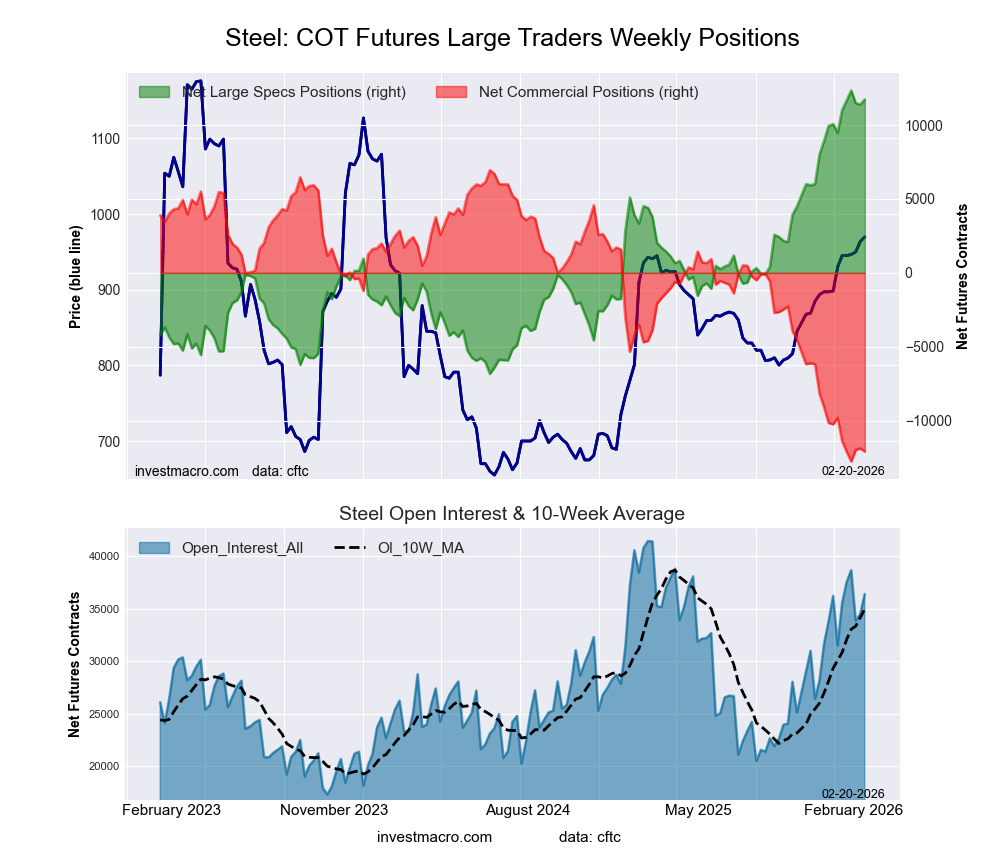 The Steel Futures large speculator standing this week totaled a net position of 11,736 contracts in the data reported through Tuesday. This was a weekly boost of 344 contracts from the previous week which had a total of 11,392 net contracts.