By InvestMacro
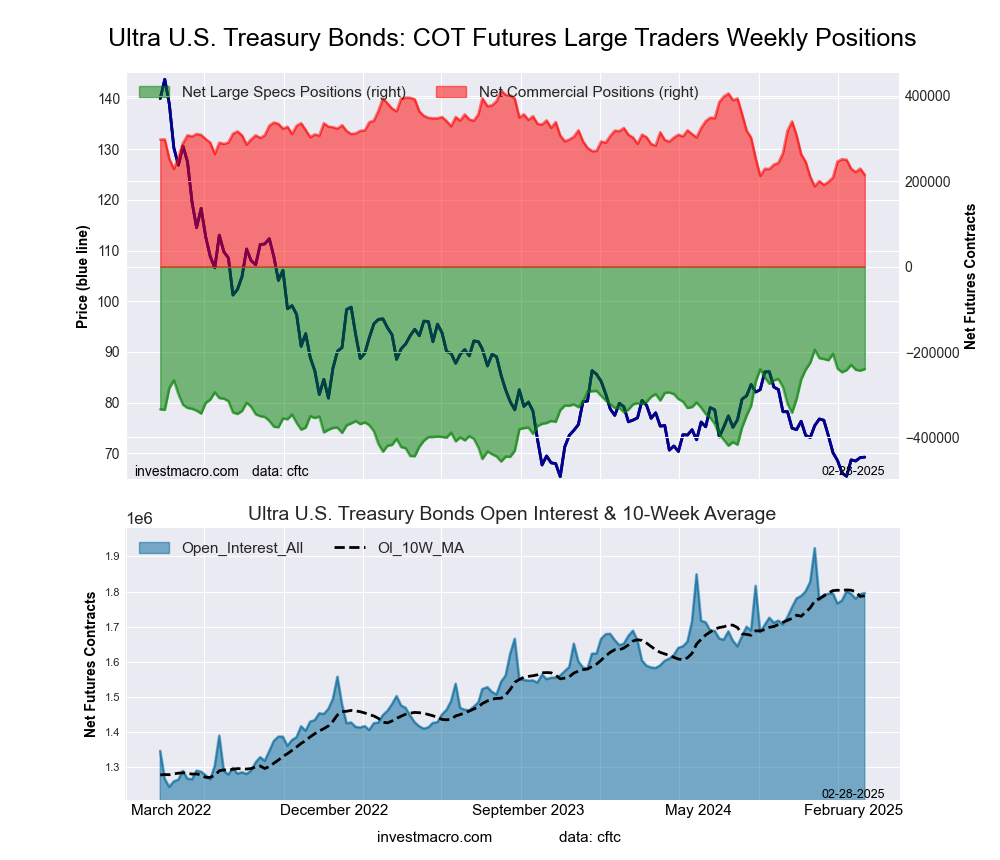
Here are the latest charts and statistics for the Commitment of Traders (COT) data published by the Commodities Futures Trading Commission (CFTC).
The latest COT data is updated through Tuesday March 4th and shows a quick view of how large market participants (for-profit speculators and commercial traders) were positioned in the futures markets. All currency positions are in direct relation to the US dollar where, for example, a bet for the euro is a bet that the euro will rise versus the dollar while a bet against the euro will be a bet that the euro will decline versus the dollar.
Weekly Speculator Changes led by Brazilian Real & Japanese Yen
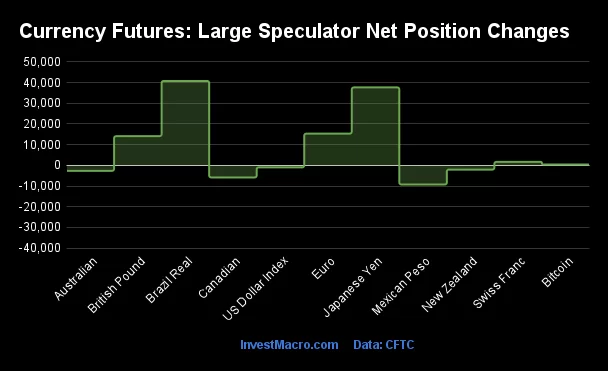
The COT currency market speculator bets were higher this week as six out of the eleven currency markets we cover had higher positioning while the other five markets had lower speculator contracts.
Leading the gains for the currency markets was the Brazilian Real (40,789 contracts) with the Japanese Yen (37,671 contracts), the EuroFX (15,319 contracts), the British Pound (14,111 contracts), the Swiss Franc (1,685 contracts) and Bitcoin (410 contracts) also showing positive weeks.
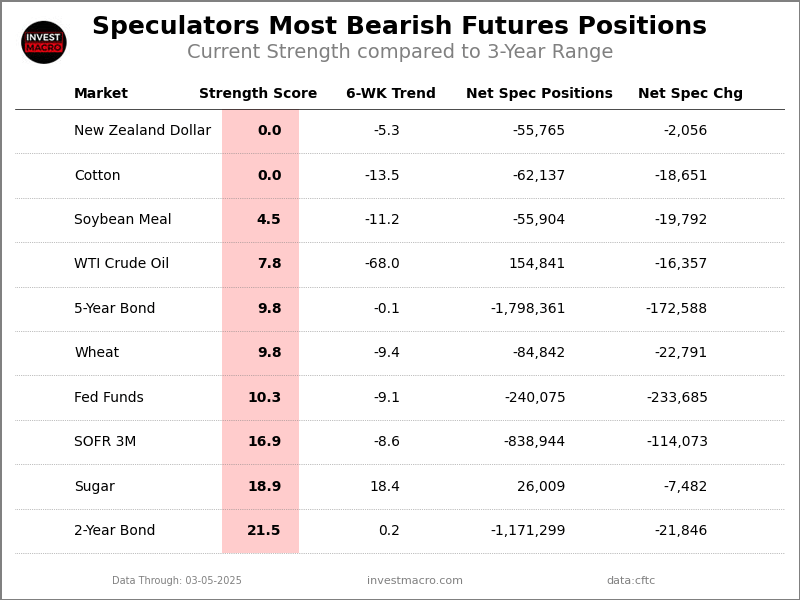
The currencies seeing declines in speculator bets on the week were the Mexican Peso (-9,274 contracts), the Canadian Dollar (-5,864 contracts), the Australian Dollar (-2,653 contracts), the New Zealand Dollar (-2,056 contracts) and with the US Dollar Index (-994 contracts) also registering lower bets on the week.
FX Roundup: Brazilian Real bets jump, Japanese Yen bets hit new record high, Euro bets rise
Highlighting the COT currency’s data this week is the sharp gains in some of the major currencies versus the US Dollar.
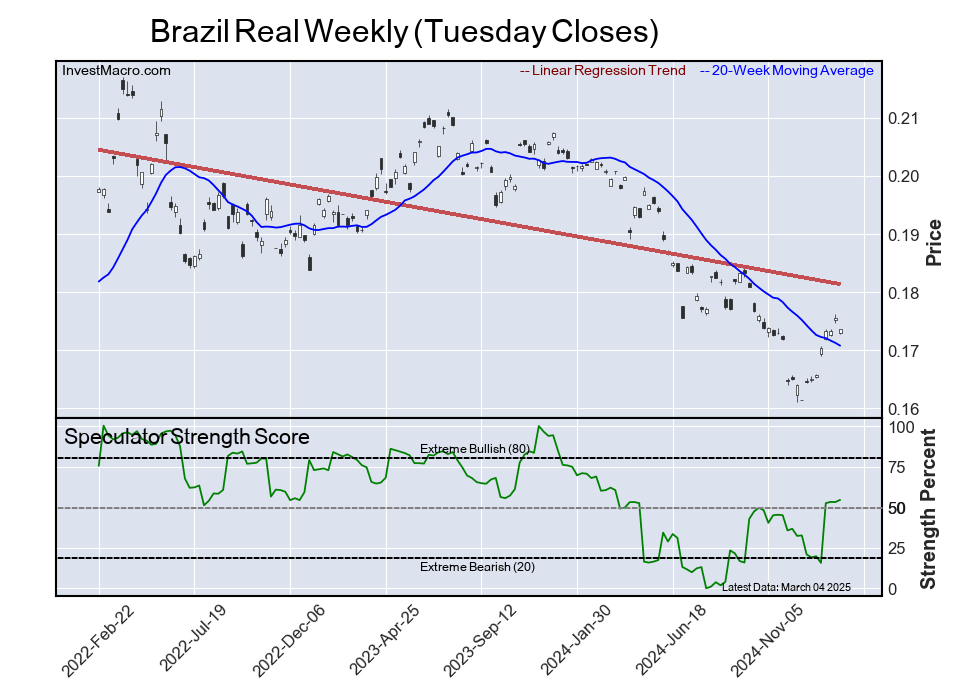
Brazilian Real: The Brazilian currency positioning saw a huge jump by over +40,000 net contracts this week. The net speculator position has now risen in four out of the past five weeks and is in bullish territory after a 39-week streak in bearish territory from May 2024 until January 28th 2025.
The BRL exchange rate remains near the lowest levels on record versus the US Dollar that were reached in December but there has been recent momentum as the BRL has gained in eight out of the past ten weeks.
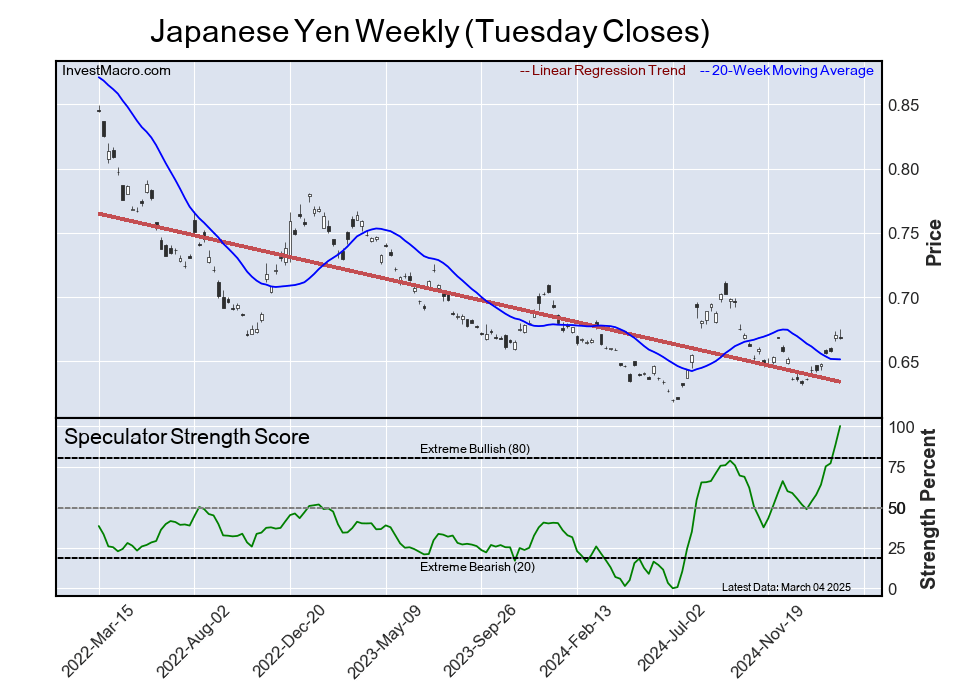
Japanese Yen: The Japanese yen speculator positions rose sharply again this week with a second consecutive weekly gain by more than +35,000 contracts. Overall, the yen speculator bets have surged higher for seven straight weeks and by a total of +163,062 contracts in that time-frame. This has pushed the current net position to a new all-time record high level of +133,651 contracts this week and breaking last week’s record.
The JPY exchange rate continues to see positive movement as the futures price climbs and the USDJPY broke down through the 150 barrier on its way towards 145.00. The USDJPY is currently trading at 147.55 and has JPY improvement in six out the past eight weeks.
Euro: The Euro speculator position has steadily improved over the past few months and has increased for three straight weeks. The Euro bets have gained by a total of +59,458 contracts over the past nine weeks and brings the current net position to a total of -10,106 contracts. This is the lowest bearish position since November and contracts could go positive in the upcoming week as the Euro has been back in favor due to dollar weakness and policy announcements.
The EUR exchange rate had a huge week with a jump by almost 5 percent. The EURUSD was trading at 1.0200 in the middle of January and with the recent surges, the EUR closed out the week over the 1.0830 exchange level.
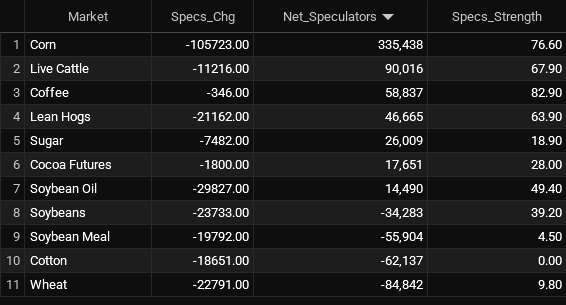
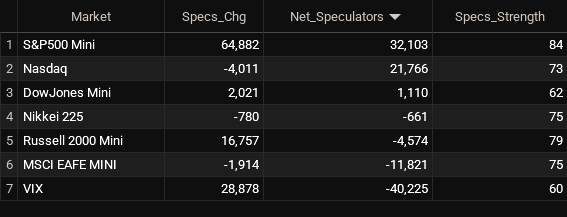
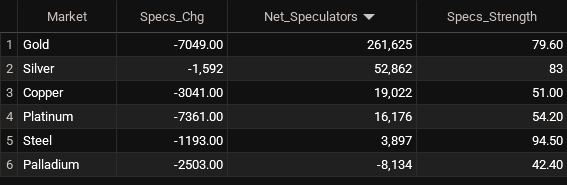
Currencies Net Speculators Leaderboard
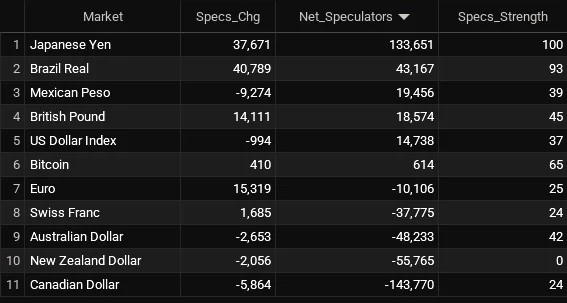
Legend: Weekly Speculators Change | Speculators Current Net Position | Speculators Strength Score compared to last 3-Years (0-100 range)
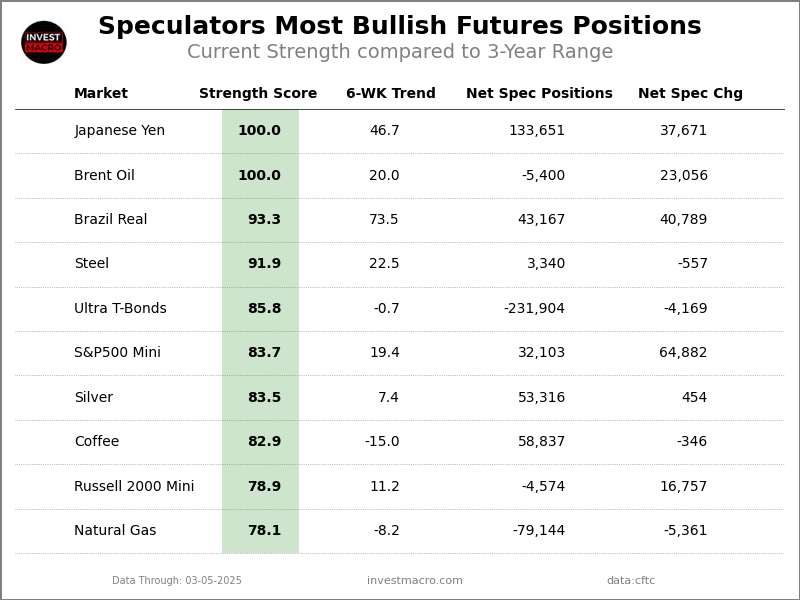
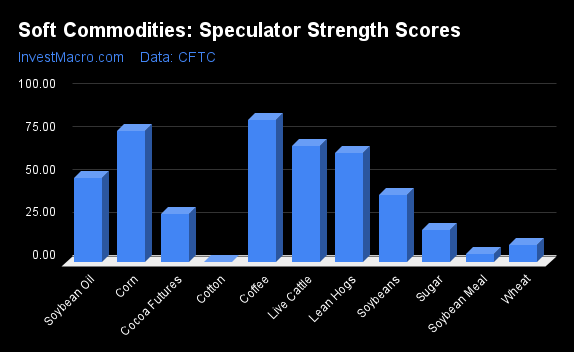
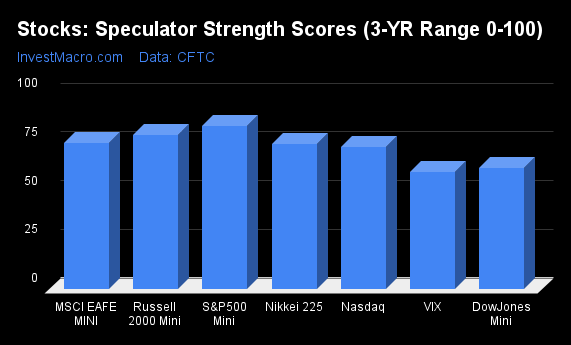
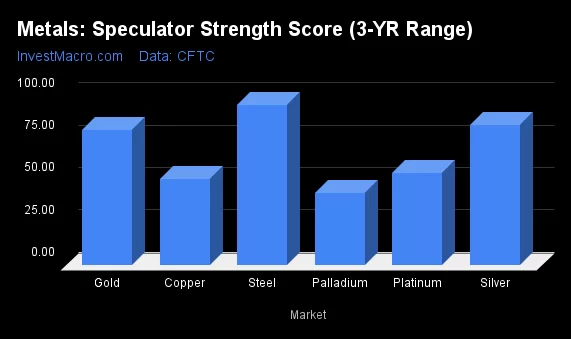
Strength Scores led by Japanese Yen & Brazilian Real
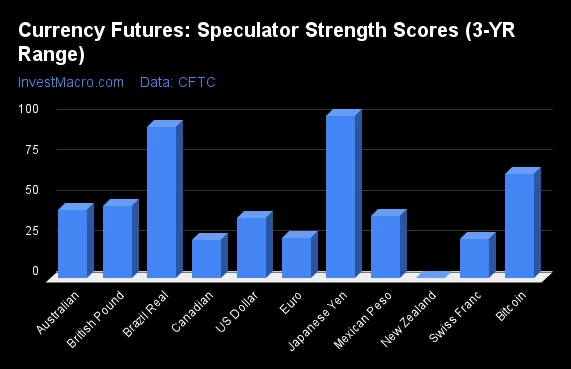
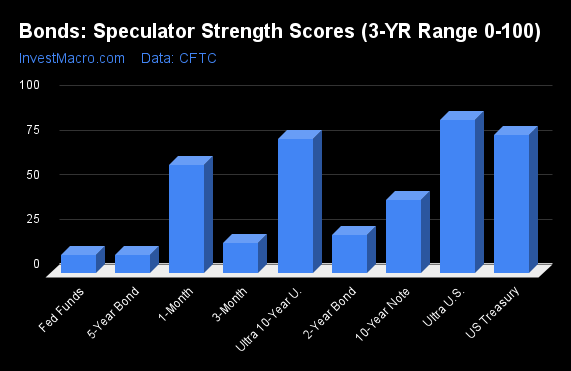
COT Strength Scores (a normalized measure of Speculator positions over a 3-Year range, from 0 to 100 where above 80 is Extreme-Bullish and below 20 is Extreme-Bearish) showed that the Japanese Yen (100 percent), the Brazilian Real (93 percent) and Bitcoin (65 percent) lead the currency markets this week. The British Pound (44 percent) and the Australian Dollar (42 percent) come in as the next highest in the weekly strength scores.
On the downside, the New Zealand Dollar (0 percent) comes in at the lowest strength levels currently and are in Extreme-Bearish territory (below 20 percent). The next lowest strength scores are the Canadian Dollar (24 percent), the Swiss Franc (24 percent) and the EuroFX (25 percent).
3-Year Strength Statistics:
US Dollar Index (37.2 percent) vs US Dollar Index previous week (39.3 percent)
EuroFX (24.9 percent) vs EuroFX previous week (19.1 percent)
British Pound Sterling (44.5 percent) vs British Pound Sterling previous week (38.1 percent)
Japanese Yen (100.0 percent) vs Japanese Yen previous week (88.1 percent)
Swiss Franc (24.3 percent) vs Swiss Franc previous week (20.9 percent)
Canadian Dollar (23.5 percent) vs Canadian Dollar previous week (26.2 percent)
Australian Dollar (42.1 percent) vs Australian Dollar previous week (44.0 percent)
New Zealand Dollar (0.0 percent) vs New Zealand Dollar previous week (2.4 percent)
Mexican Peso (38.7 percent) vs Mexican Peso previous week (43.4 percent)
Brazilian Real (93.3 percent) vs Brazilian Real previous week (54.5 percent)
Bitcoin (64.7 percent) vs Bitcoin previous week (55.7 percent)
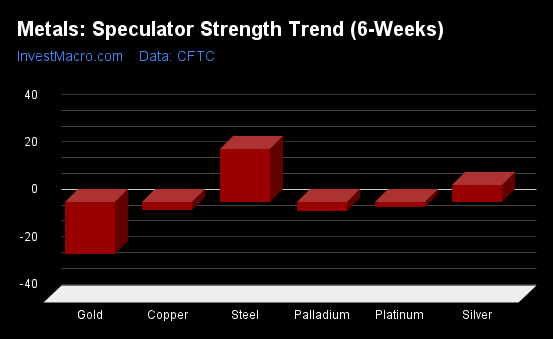
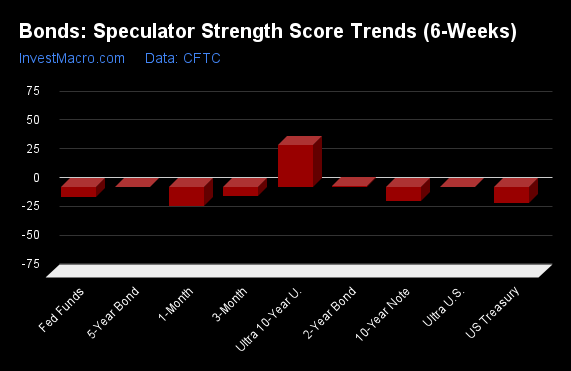
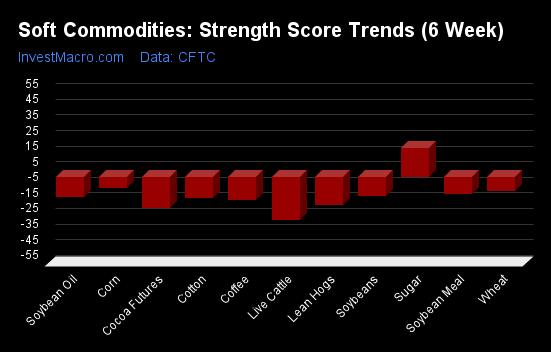
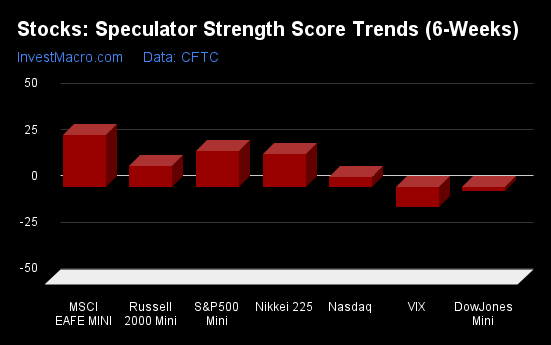
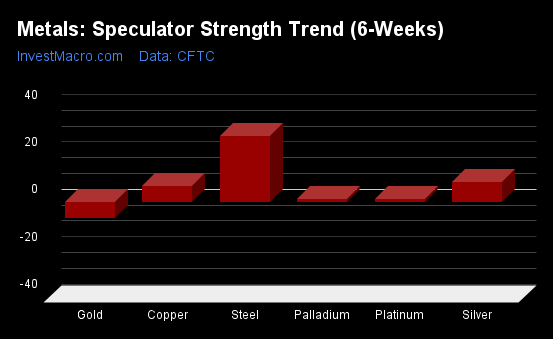
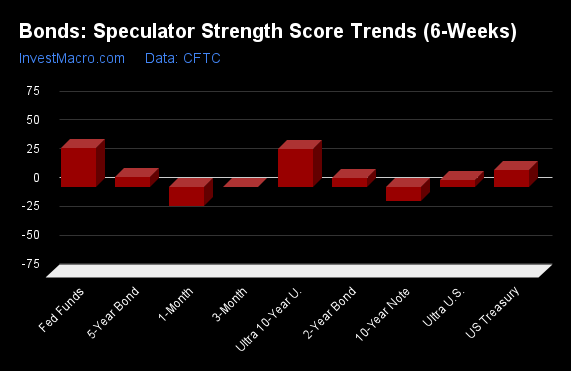
Japanese Yen & Brazilian Real top the 6-Week Strength Trends
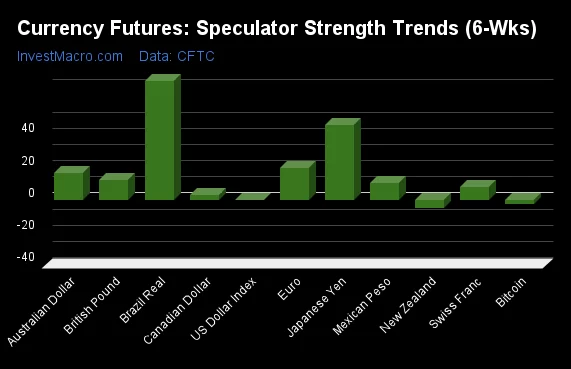
COT Strength Score Trends (or move index, calculates the 6-week changes in strength scores) showed that the Brazilian Real (74 percent) and the Japanese Yen (47 percent) lead the past six weeks trends for the currencies. The EuroFX (20 percent), the Australian Dollar (16 percent) and the British Pound Sterling (12 percent) are the next highest positive movers in the 3-Year trends data.
The New Zealand Dollar (-5 percent) leads the downside trend scores currently with Bitcoin (-3 percent) following next with lower trend scores.
3-Year Strength Trends:
US Dollar Index (-0.3 percent) vs US Dollar Index previous week (6.2 percent)
EuroFX (19.9 percent) vs EuroFX previous week (13.3 percent)
British Pound Sterling (12.1 percent) vs British Pound Sterling previous week (1.8 percent)
Japanese Yen (46.7 percent) vs Japanese Yen previous week (39.4 percent)
Swiss Franc (8.2 percent) vs Swiss Franc previous week (-1.5 percent)
Canadian Dollar (3.1 percent) vs Canadian Dollar previous week (13.1 percent)
Australian Dollar (16.4 percent) vs Australian Dollar previous week (22.7 percent)
New Zealand Dollar (-5.3 percent) vs New Zealand Dollar previous week (-1.9 percent)
Mexican Peso (10.7 percent) vs Mexican Peso previous week (11.6 percent)
Brazilian Real (73.5 percent) vs Brazilian Real previous week (35.4 percent)
Bitcoin (-2.7 percent) vs Bitcoin previous week (-24.7 percent)
Individual COT Forex Markets:
US Dollar Index Futures:
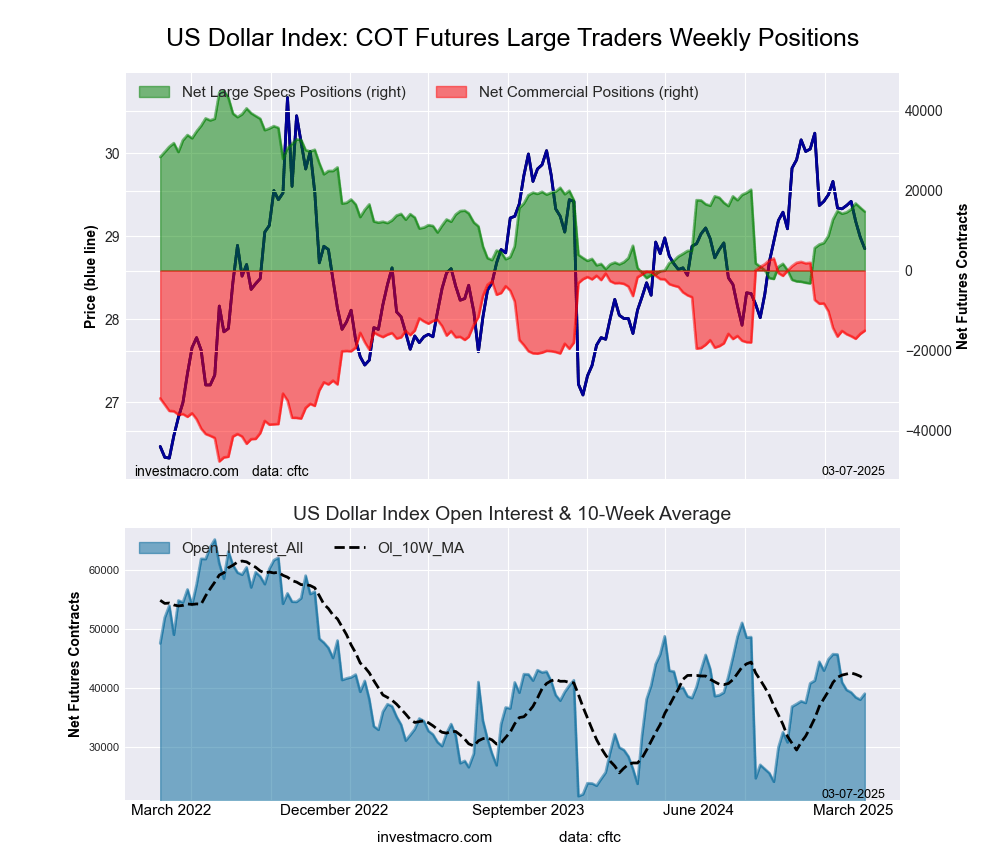 The US Dollar Index large speculator standing this week resulted in a net position of 14,738 contracts in the data reported through Tuesday. This was a weekly decline of -994 contracts from the previous week which had a total of 15,732 net contracts.
This week’s current strength score (the trader positioning range over the past three years, measured from 0 to 100) shows the speculators are currently Bearish with a score of 37.2 percent. The commercials are Bullish with a score of 64.4 percent and the small traders (not shown in chart) are Bearish with a score of 29.4 percent.
Price Trend-Following Model: Strong Downtrend
Our weekly trend-following model classifies the current market price position as: Strong Downtrend.
| US DOLLAR INDEX Statistics | SPECULATORS | COMMERCIALS | SMALL TRADERS |
| – Percent of Open Interest Longs: | 71.1 | 17.1 | 7.4 |
| – Percent of Open Interest Shorts: | 33.4 | 55.6 | 6.6 |
| – Net Position: | 14,738 | -15,048 | 310 |
| – Gross Longs: | 27,785 | 6,675 | 2,886 |
| – Gross Shorts: | 13,047 | 21,723 | 2,576 |
| – Long to Short Ratio: | 2.1 to 1 | 0.3 to 1 | 1.1 to 1 |
| NET POSITION TREND: | |||
| – Strength Index Score (3 Year Range Pct): | 37.2 | 64.4 | 29.4 |
| – Strength Index Reading (3 Year Range): | Bearish | Bullish | Bearish |
| NET POSITION MOVEMENT INDEX: | |||
| – 6-Week Change in Strength Index: | -0.3 | 2.9 | -15.5 |
Euro Currency Futures:
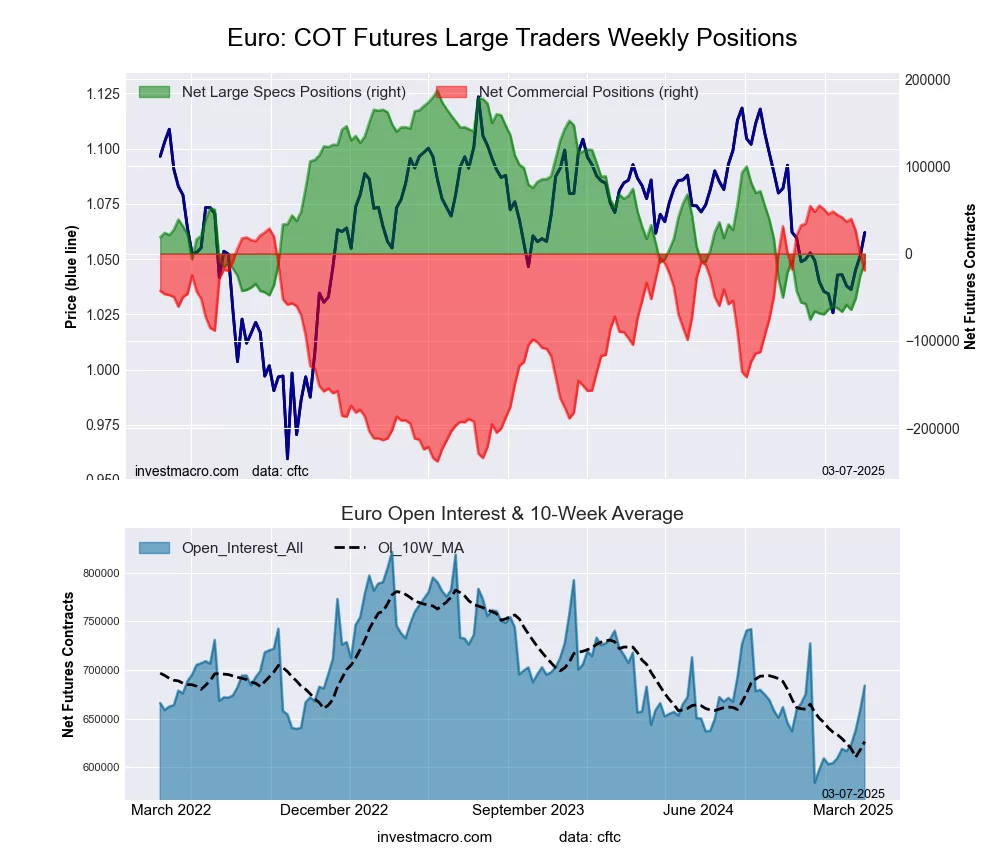 The Euro Currency large speculator standing this week resulted in a net position of -10,106 contracts in the data reported through Tuesday. This was a weekly increase of 15,319 contracts from the previous week which had a total of -25,425 net contracts.
This week’s current strength score (the trader positioning range over the past three years, measured from 0 to 100) shows the speculators are currently Bearish with a score of 24.9 percent. The commercials are Bullish with a score of 74.7 percent and the small traders (not shown in chart) are Bearish with a score of 38.5 percent.
Price Trend-Following Model: Weak Downtrend
Our weekly trend-following model classifies the current market price position as: Weak Downtrend.
| EURO Currency Statistics | SPECULATORS | COMMERCIALS | SMALL TRADERS |
| – Percent of Open Interest Longs: | 27.1 | 55.1 | 12.2 |
| – Percent of Open Interest Shorts: | 28.6 | 57.9 | 7.9 |
| – Net Position: | -10,106 | -19,259 | 29,365 |
| – Gross Longs: | 185,223 | 376,930 | 83,321 |
| – Gross Shorts: | 195,329 | 396,189 | 53,956 |
| – Long to Short Ratio: | 0.9 to 1 | 1.0 to 1 | 1.5 to 1 |
| NET POSITION TREND: | |||
| – Strength Index Score (3 Year Range Pct): | 24.9 | 74.7 | 38.5 |
| – Strength Index Reading (3 Year Range): | Bearish | Bullish | Bearish |
| NET POSITION MOVEMENT INDEX: | |||
| – 6-Week Change in Strength Index: | 19.9 | -21.7 | 24.8 |
British Pound Sterling Futures:
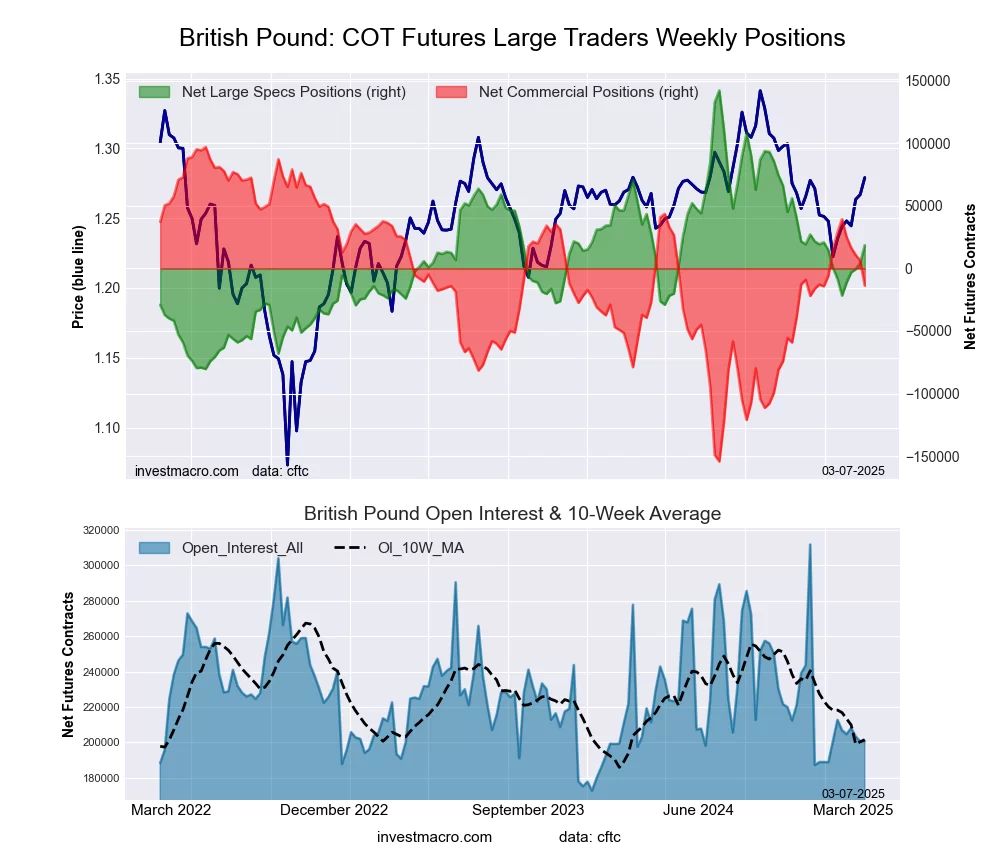 The British Pound Sterling large speculator standing this week resulted in a net position of 18,574 contracts in the data reported through Tuesday. This was a weekly lift of 14,111 contracts from the previous week which had a total of 4,463 net contracts.
This week’s current strength score (the trader positioning range over the past three years, measured from 0 to 100) shows the speculators are currently Bearish with a score of 44.5 percent. The commercials are Bullish with a score of 55.9 percent and the small traders (not shown in chart) are Bullish with a score of 52.0 percent.
Price Trend-Following Model: Weak Downtrend
Our weekly trend-following model classifies the current market price position as: Weak Downtrend.
| BRITISH POUND Statistics | SPECULATORS | COMMERCIALS | SMALL TRADERS |
| – Percent of Open Interest Longs: | 40.8 | 40.6 | 13.8 |
| – Percent of Open Interest Shorts: | 31.5 | 47.4 | 16.2 |
| – Net Position: | 18,574 | -13,710 | -4,864 |
| – Gross Longs: | 81,866 | 81,410 | 27,706 |
| – Gross Shorts: | 63,292 | 95,120 | 32,570 |
| – Long to Short Ratio: | 1.3 to 1 | 0.9 to 1 | 0.9 to 1 |
| NET POSITION TREND: | |||
| – Strength Index Score (3 Year Range Pct): | 44.5 | 55.9 | 52.0 |
| – Strength Index Reading (3 Year Range): | Bearish | Bullish | Bullish |
| NET POSITION MOVEMENT INDEX: | |||
| – 6-Week Change in Strength Index: | 12.1 | -16.9 | 32.9 |
Japanese Yen Futures:
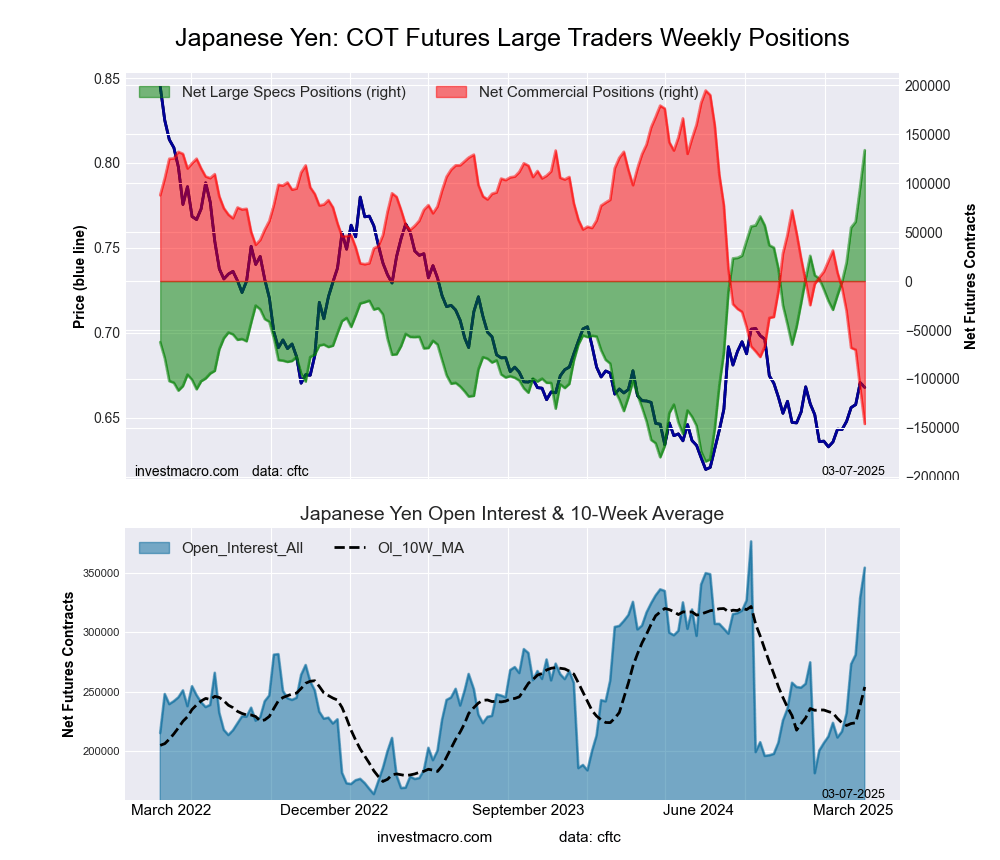 The Japanese Yen large speculator standing this week resulted in a net position of 133,651 contracts in the data reported through Tuesday. This was a weekly increase of 37,671 contracts from the previous week which had a total of 95,980 net contracts.
This week’s current strength score (the trader positioning range over the past three years, measured from 0 to 100) shows the speculators are currently Bullish-Extreme with a score of 100.0 percent. The commercials are Bearish-Extreme with a score of 0.0 percent and the small traders (not shown in chart) are Bullish-Extreme with a score of 93.4 percent.
Price Trend-Following Model: Strong Uptrend
Our weekly trend-following model classifies the current market price position as: Strong Uptrend.
| JAPANESE YEN Statistics | SPECULATORS | COMMERCIALS | SMALL TRADERS |
| – Percent of Open Interest Longs: | 51.9 | 28.8 | 12.7 |
| – Percent of Open Interest Shorts: | 14.2 | 70.0 | 9.3 |
| – Net Position: | 133,651 | -145,919 | 12,268 |
| – Gross Longs: | 183,955 | 102,081 | 45,054 |
| – Gross Shorts: | 50,304 | 248,000 | 32,786 |
| – Long to Short Ratio: | 3.7 to 1 | 0.4 to 1 | 1.4 to 1 |
| NET POSITION TREND: | |||
| – Strength Index Score (3 Year Range Pct): | 100.0 | 0.0 | 93.4 |
| – Strength Index Reading (3 Year Range): | Bullish-Extreme | Bearish-Extreme | Bullish-Extreme |
| NET POSITION MOVEMENT INDEX: | |||
| – 6-Week Change in Strength Index: | 46.7 | -45.5 | 15.6 |
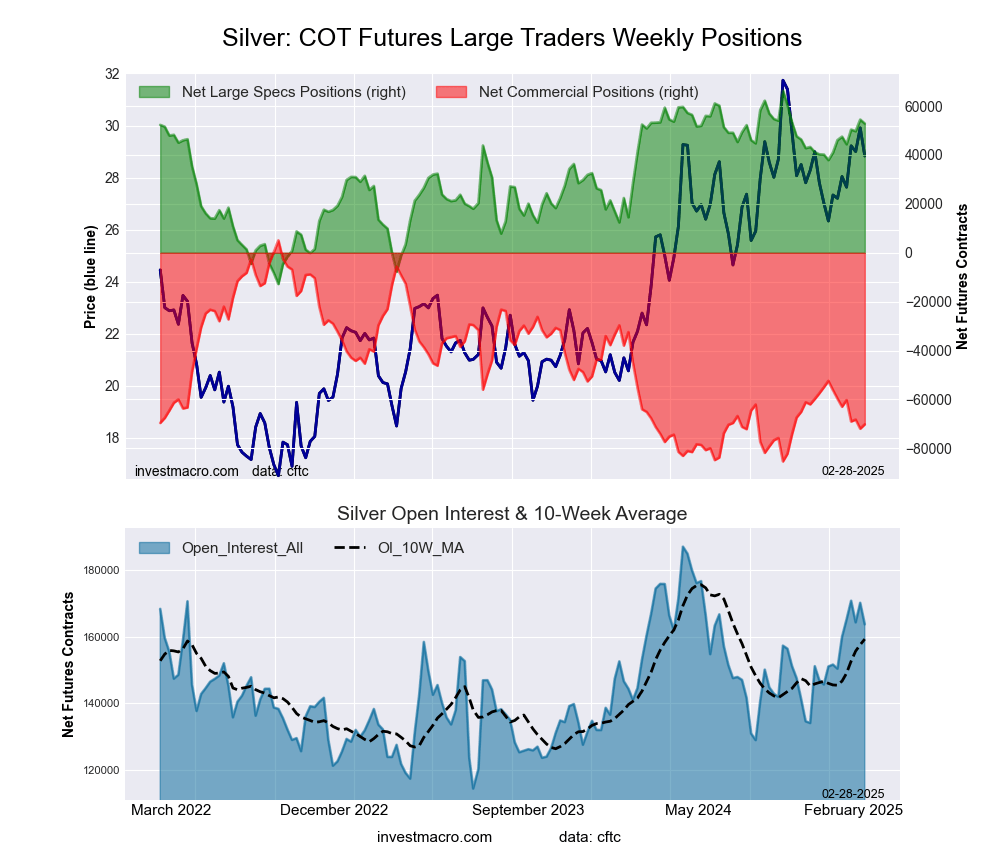
Swiss Franc Futures:
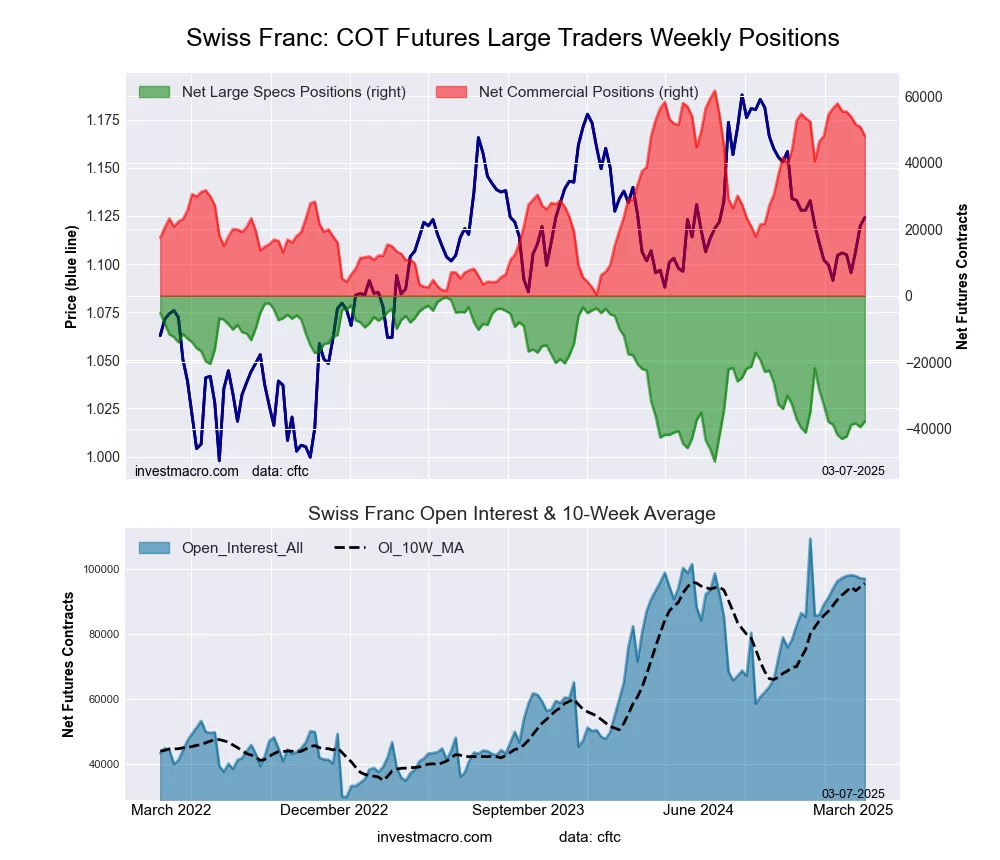 The Swiss Franc large speculator standing this week resulted in a net position of -37,775 contracts in the data reported through Tuesday. This was a weekly boost of 1,685 contracts from the previous week which had a total of -39,460 net contracts.
This week’s current strength score (the trader positioning range over the past three years, measured from 0 to 100) shows the speculators are currently Bearish with a score of 24.3 percent. The commercials are Bullish with a score of 77.8 percent and the small traders (not shown in chart) are Bearish with a score of 35.1 percent.
Price Trend-Following Model: Weak Downtrend
Our weekly trend-following model classifies the current market price position as: Weak Downtrend.
| SWISS FRANC Statistics | SPECULATORS | COMMERCIALS | SMALL TRADERS |
| – Percent of Open Interest Longs: | 5.7 | 81.0 | 12.3 |
| – Percent of Open Interest Shorts: | 44.7 | 31.5 | 22.9 |
| – Net Position: | -37,775 | 48,071 | -10,296 |
| – Gross Longs: | 5,572 | 78,617 | 11,964 |
| – Gross Shorts: | 43,347 | 30,546 | 22,260 |
| – Long to Short Ratio: | 0.1 to 1 | 2.6 to 1 | 0.5 to 1 |
| NET POSITION TREND: | |||
| – Strength Index Score (3 Year Range Pct): | 24.3 | 77.8 | 35.1 |
| – Strength Index Reading (3 Year Range): | Bearish | Bullish | Bearish |
| NET POSITION MOVEMENT INDEX: | |||
| – 6-Week Change in Strength Index: | 8.2 | -15.8 | 23.8 |
Canadian Dollar Futures:
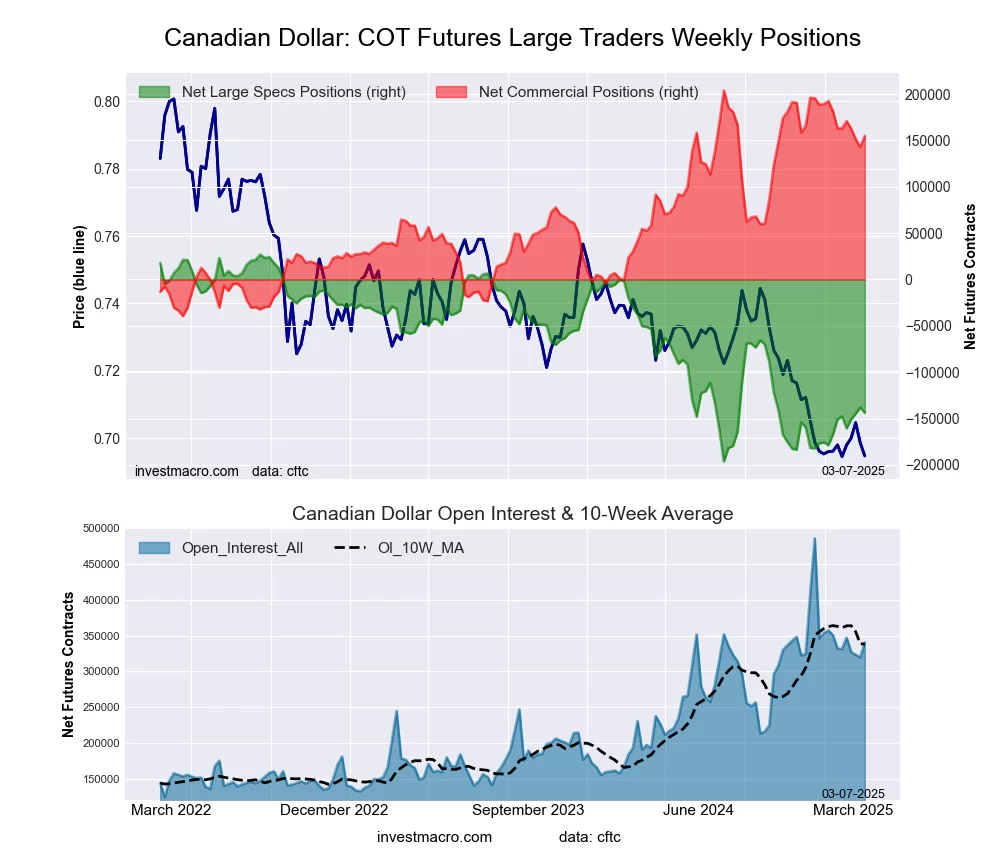 The Canadian Dollar large speculator standing this week resulted in a net position of -143,770 contracts in the data reported through Tuesday. This was a weekly decrease of -5,864 contracts from the previous week which had a total of -137,906 net contracts.
This week’s current strength score (the trader positioning range over the past three years, measured from 0 to 100) shows the speculators are currently Bearish with a score of 23.5 percent. The commercials are Bullish with a score of 79.9 percent and the small traders (not shown in chart) are Bearish-Extreme with a score of 10.7 percent.
Price Trend-Following Model: Downtrend
Our weekly trend-following model classifies the current market price position as: Downtrend.
| CANADIAN DOLLAR Statistics | SPECULATORS | COMMERCIALS | SMALL TRADERS |
| – Percent of Open Interest Longs: | 6.5 | 79.5 | 7.2 |
| – Percent of Open Interest Shorts: | 48.8 | 33.9 | 10.5 |
| – Net Position: | -143,770 | 154,980 | -11,210 |
| – Gross Longs: | 22,175 | 270,391 | 24,406 |
| – Gross Shorts: | 165,945 | 115,411 | 35,616 |
| – Long to Short Ratio: | 0.1 to 1 | 2.3 to 1 | 0.7 to 1 |
| NET POSITION TREND: | |||
| – Strength Index Score (3 Year Range Pct): | 23.5 | 79.9 | 10.7 |
| – Strength Index Reading (3 Year Range): | Bearish | Bullish | Bearish-Extreme |
| NET POSITION MOVEMENT INDEX: | |||
| – 6-Week Change in Strength Index: | 3.1 | -3.3 | 2.8 |
Australian Dollar Futures:
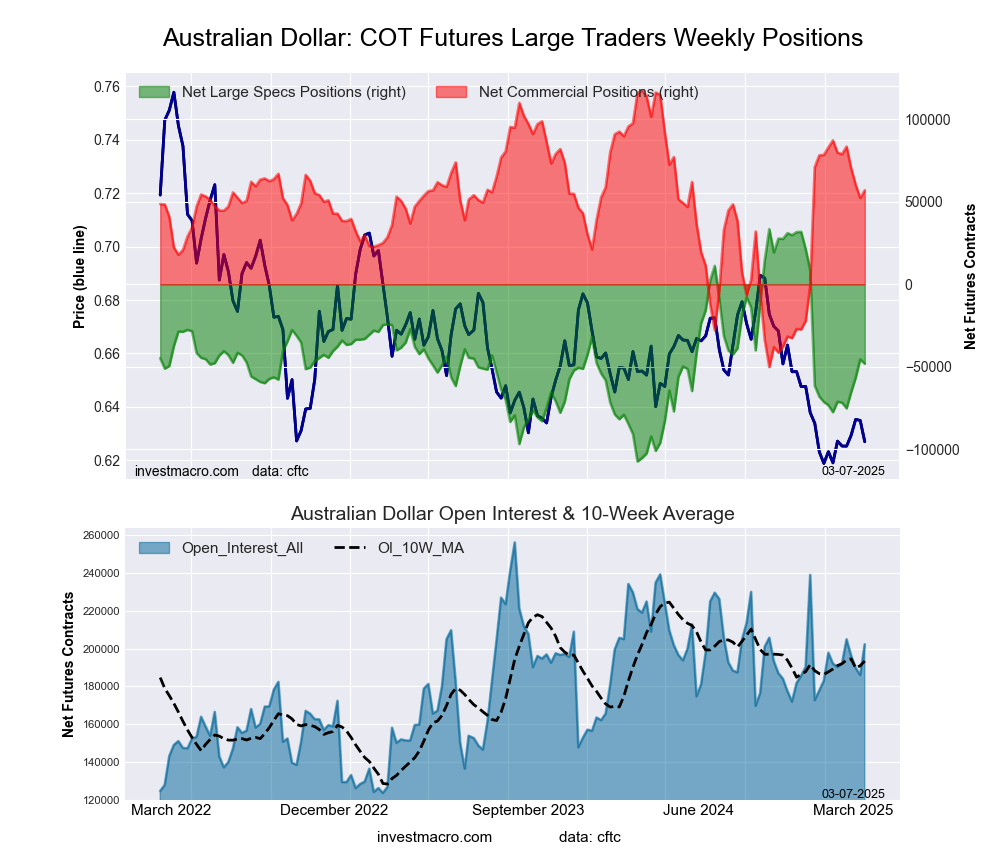 The Australian Dollar large speculator standing this week resulted in a net position of -48,233 contracts in the data reported through Tuesday. This was a weekly decline of -2,653 contracts from the previous week which had a total of -45,580 net contracts.
This week’s current strength score (the trader positioning range over the past three years, measured from 0 to 100) shows the speculators are currently Bearish with a score of 42.1 percent. The commercials are Bullish with a score of 63.9 percent and the small traders (not shown in chart) are Bearish with a score of 25.9 percent.
Price Trend-Following Model: Downtrend
Our weekly trend-following model classifies the current market price position as: Downtrend.
| AUSTRALIAN DOLLAR Statistics | SPECULATORS | COMMERCIALS | SMALL TRADERS |
| – Percent of Open Interest Longs: | 27.3 | 55.2 | 12.2 |
| – Percent of Open Interest Shorts: | 51.1 | 27.0 | 16.5 |
| – Net Position: | -48,233 | 57,029 | -8,796 |
| – Gross Longs: | 55,151 | 111,644 | 24,680 |
| – Gross Shorts: | 103,384 | 54,615 | 33,476 |
| – Long to Short Ratio: | 0.5 to 1 | 2.0 to 1 | 0.7 to 1 |
| NET POSITION TREND: | |||
| – Strength Index Score (3 Year Range Pct): | 42.1 | 63.9 | 25.9 |
| – Strength Index Reading (3 Year Range): | Bearish | Bullish | Bearish |
| NET POSITION MOVEMENT INDEX: | |||
| – 6-Week Change in Strength Index: | 16.4 | -13.6 | -0.8 |
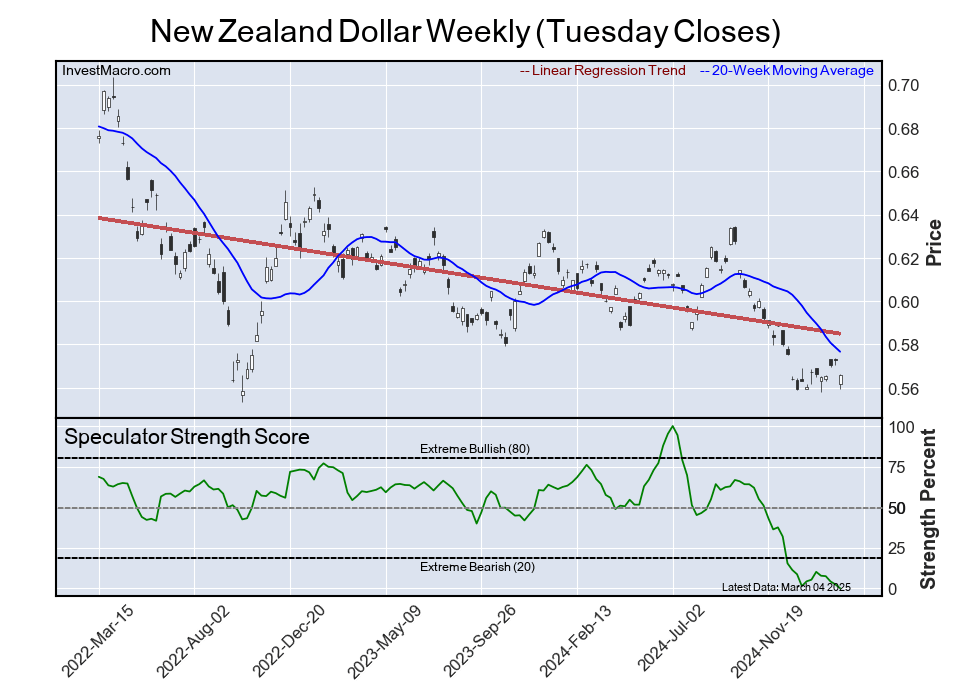
New Zealand Dollar Futures:
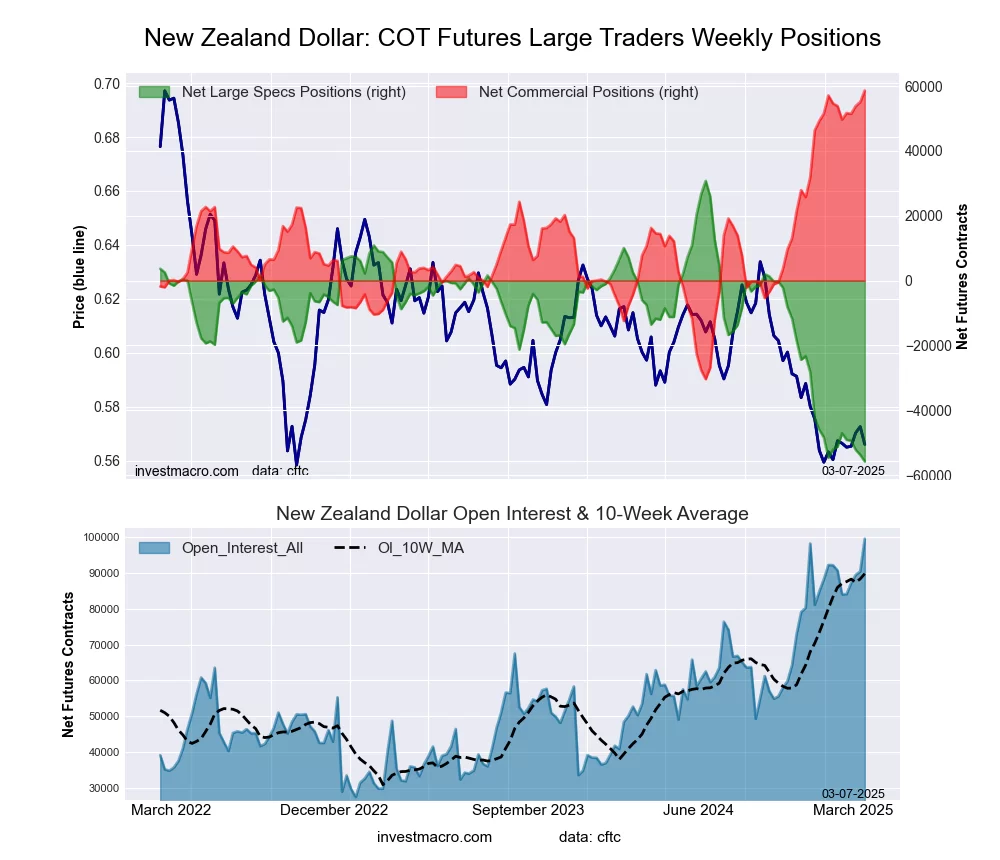 The New Zealand Dollar large speculator standing this week resulted in a net position of -55,765 contracts in the data reported through Tuesday. This was a weekly lowering of -2,056 contracts from the previous week which had a total of -53,709 net contracts.
This week’s current strength score (the trader positioning range over the past three years, measured from 0 to 100) shows the speculators are currently Bearish-Extreme with a score of 0.0 percent. The commercials are Bullish-Extreme with a score of 100.0 percent and the small traders (not shown in chart) are Bearish-Extreme with a score of 17.3 percent.
Price Trend-Following Model: Downtrend
Our weekly trend-following model classifies the current market price position as: Downtrend.
| NEW ZEALAND DOLLAR Statistics | SPECULATORS | COMMERCIALS | SMALL TRADERS |
| – Percent of Open Interest Longs: | 17.9 | 78.0 | 3.3 |
| – Percent of Open Interest Shorts: | 74.0 | 19.0 | 6.2 |
| – Net Position: | -55,765 | 58,610 | -2,845 |
| – Gross Longs: | 17,843 | 77,550 | 3,282 |
| – Gross Shorts: | 73,608 | 18,940 | 6,127 |
| – Long to Short Ratio: | 0.2 to 1 | 4.1 to 1 | 0.5 to 1 |
| NET POSITION TREND: | |||
| – Strength Index Score (3 Year Range Pct): | 0.0 | 100.0 | 17.3 |
| – Strength Index Reading (3 Year Range): | Bearish-Extreme | Bullish-Extreme | Bearish-Extreme |
| NET POSITION MOVEMENT INDEX: | |||
| – 6-Week Change in Strength Index: | -5.3 | 5.4 | -2.9 |
Mexican Peso Futures:
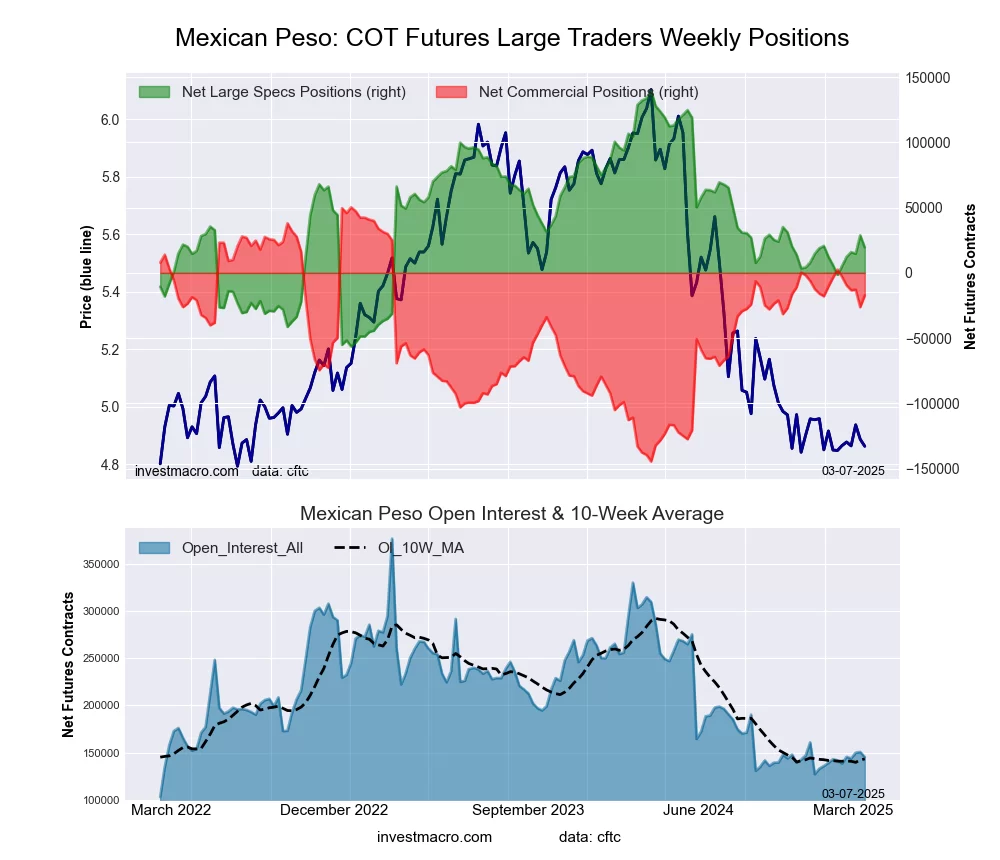 The Mexican Peso large speculator standing this week resulted in a net position of 19,456 contracts in the data reported through Tuesday. This was a weekly decrease of -9,274 contracts from the previous week which had a total of 28,730 net contracts.
This week’s current strength score (the trader positioning range over the past three years, measured from 0 to 100) shows the speculators are currently Bearish with a score of 38.7 percent. The commercials are Bullish with a score of 65.3 percent and the small traders (not shown in chart) are Bearish-Extreme with a score of 10.8 percent.
Price Trend-Following Model: Weak Downtrend
Our weekly trend-following model classifies the current market price position as: Weak Downtrend.
| MEXICAN PESO Statistics | SPECULATORS | COMMERCIALS | SMALL TRADERS |
| – Percent of Open Interest Longs: | 45.3 | 49.7 | 2.4 |
| – Percent of Open Interest Shorts: | 31.9 | 61.6 | 3.9 |
| – Net Position: | 19,456 | -17,305 | -2,151 |
| – Gross Longs: | 65,679 | 72,102 | 3,500 |
| – Gross Shorts: | 46,223 | 89,407 | 5,651 |
| – Long to Short Ratio: | 1.4 to 1 | 0.8 to 1 | 0.6 to 1 |
| NET POSITION TREND: | |||
| – Strength Index Score (3 Year Range Pct): | 38.7 | 65.3 | 10.8 |
| – Strength Index Reading (3 Year Range): | Bearish | Bullish | Bearish-Extreme |
| NET POSITION MOVEMENT INDEX: | |||
| – 6-Week Change in Strength Index: | 10.7 | -10.1 | -7.1 |
Brazilian Real Futures:
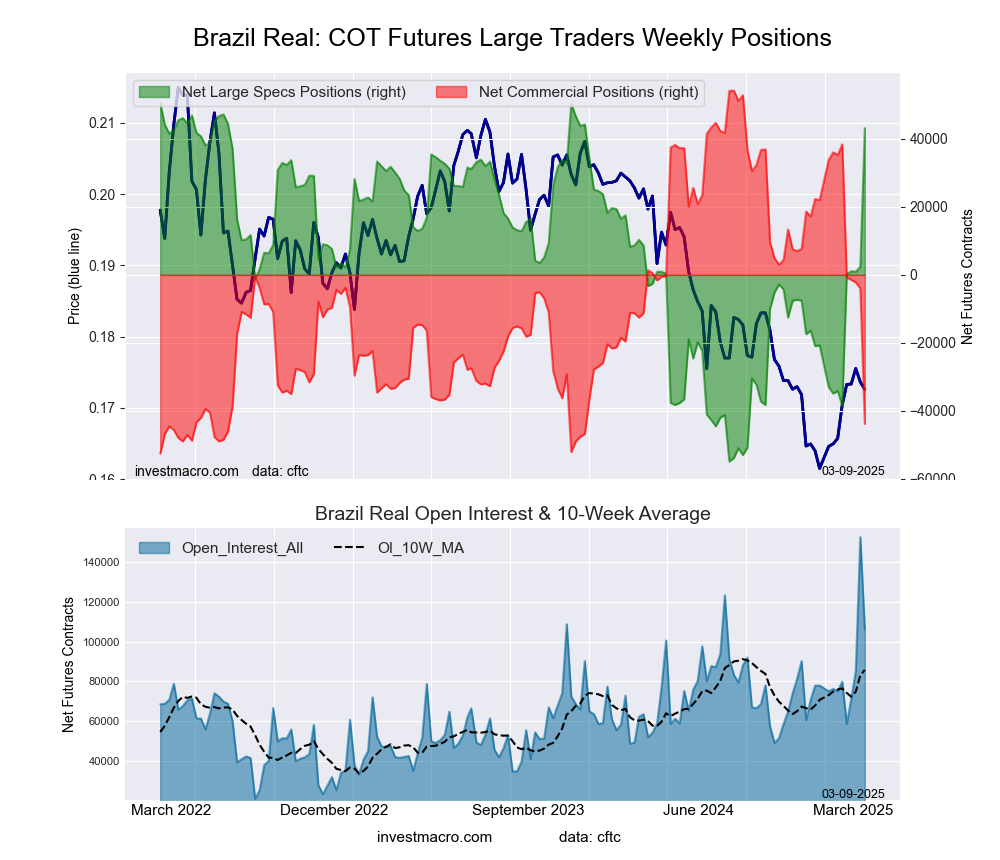
The Brazilian Real large speculator standing this week was a net position of 43,167 contracts in the data reported through Tuesday. This was a weekly gain of 40,789 contracts from the previous week which had a total of 2,378 net contracts.
This week’s current strength score (the trader positioning range over the past three years, measured from 0 to 100) shows the speculators are currently Bullish-Extreme with a score of 93.3 percent. The commercials are Bearish-Extreme with a score of 7.8 percent and the small traders (not shown in chart) are Bearish with a score of 24.5 percent.
Price Trend-Following Model: Weak Downtrend
Our weekly trend-following model classifies the current market price position as: Weak Downtrend.
| BRAZIL REAL Statistics | SPECULATORS | COMMERCIALS | SMALL TRADERS |
| – Percent of Open Interest Longs: | 69.8 | 27.2 | 2.7 |
| – Percent of Open Interest Shorts: | 29.0 | 68.6 | 2.1 |
| – Net Position: | 43,167 | -43,814 | 647 |
| – Gross Longs: | 73,933 | 28,866 | 2,899 |
| – Gross Shorts: | 30,766 | 72,680 | 2,252 |
| – Long to Short Ratio: | 2.4 to 1 | 0.4 to 1 | 1.3 to 1 |
| NET POSITION TREND: | |||
| – Strength Index Score (3 Year Range Pct): | 93.3 | 7.8 | 24.5 |
| – Strength Index Reading (3 Year Range): | Bullish-Extreme | Bearish-Extreme | Bearish |
| NET POSITION MOVEMENT INDEX: | |||
| – 6-Week Change in Strength Index: | 73.5 | -74.4 | 10.2 |
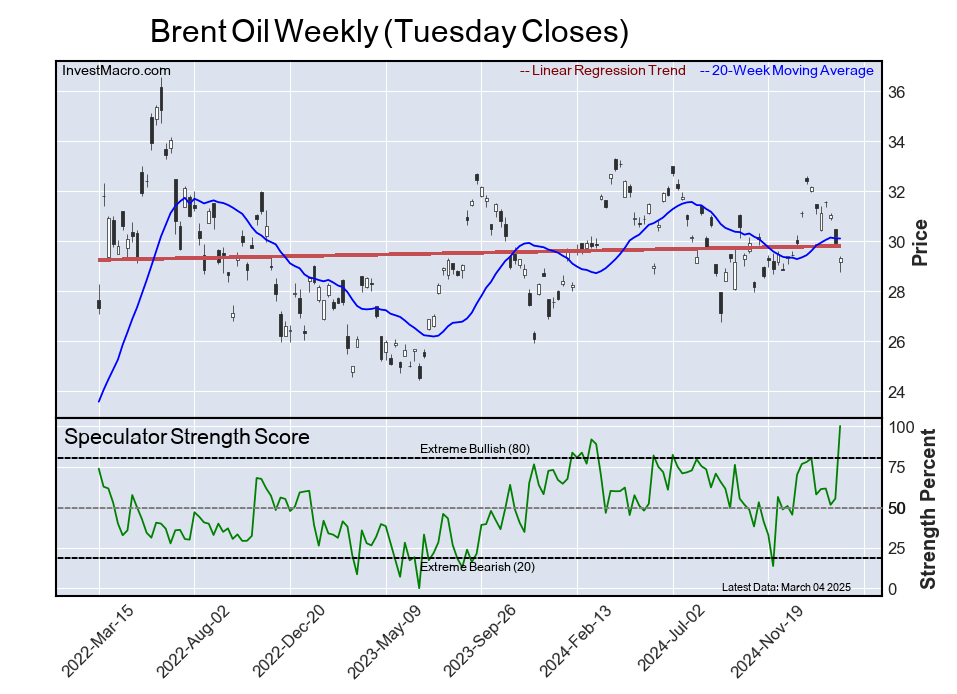
Bitcoin Futures:
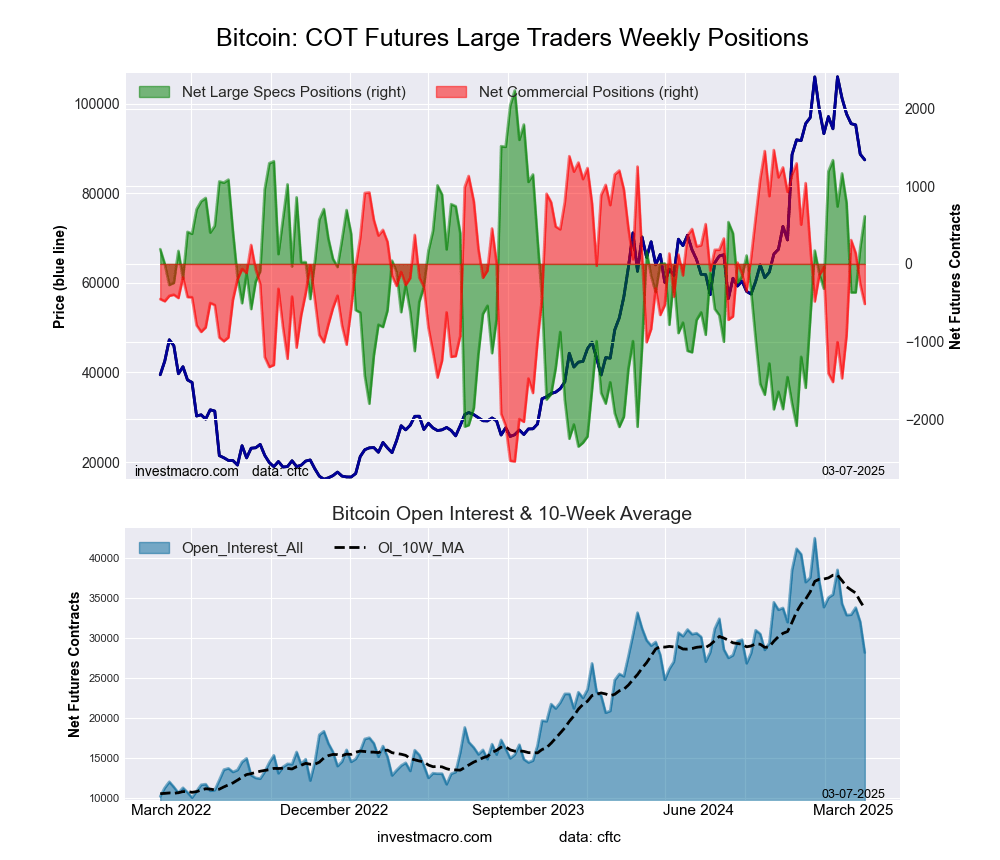 The Bitcoin large speculator standing this week resulted in a net position of 614 contracts in the data reported through Tuesday. This was a weekly boost of 410 contracts from the previous week which had a total of 204 net contracts.
This week’s current strength score (the trader positioning range over the past three years, measured from 0 to 100) shows the speculators are currently Bullish with a score of 64.7 percent. The commercials are Bullish with a score of 50.6 percent and the small traders (not shown in chart) are Bearish-Extreme with a score of 3.0 percent.
Price Trend-Following Model: Weak Uptrend
Our weekly trend-following model classifies the current market price position as: Weak Uptrend.
| BITCOIN Statistics | SPECULATORS | COMMERCIALS | SMALL TRADERS |
| – Percent of Open Interest Longs: | 86.7 | 3.3 | 4.2 |
| – Percent of Open Interest Shorts: | 84.6 | 5.2 | 4.6 |
| – Net Position: | 614 | -516 | -98 |
| – Gross Longs: | 24,469 | 937 | 1,186 |
| – Gross Shorts: | 23,855 | 1,453 | 1,284 |
| – Long to Short Ratio: | 1.0 to 1 | 0.6 to 1 | 0.9 to 1 |
| NET POSITION TREND: | |||
| – Strength Index Score (3 Year Range Pct): | 64.7 | 50.6 | 3.0 |
| – Strength Index Reading (3 Year Range): | Bullish | Bullish | Bearish-Extreme |
| NET POSITION MOVEMENT INDEX: | |||
| – 6-Week Change in Strength Index: | -2.7 | 12.2 | -27.2 |
Article By InvestMacro – Receive our weekly COT Newsletter
*COT Report: The COT data, released weekly to the public each Friday, is updated through the most recent Tuesday (data is 3 days old) and shows a quick view of how large speculators or non-commercials (for-profit traders) were positioned in the futures markets.
The CFTC categorizes trader positions according to commercial hedgers (traders who use futures contracts for hedging as part of the business), non-commercials (large traders who speculate to realize trading profits) and nonreportable traders (usually small traders/speculators) as well as their open interest (contracts open in the market at time of reporting). See CFTC criteria here.