By InvestMacro
The latest update for the weekly Commitment of Traders (COT) report was released by the Commodity Futures Trading Commission (CFTC) on Friday for data ending on Tuesday April 21st.
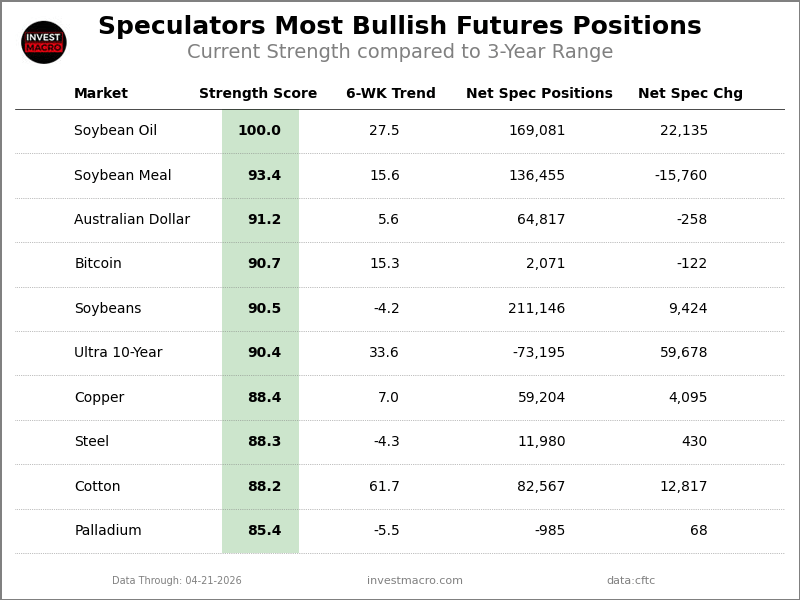
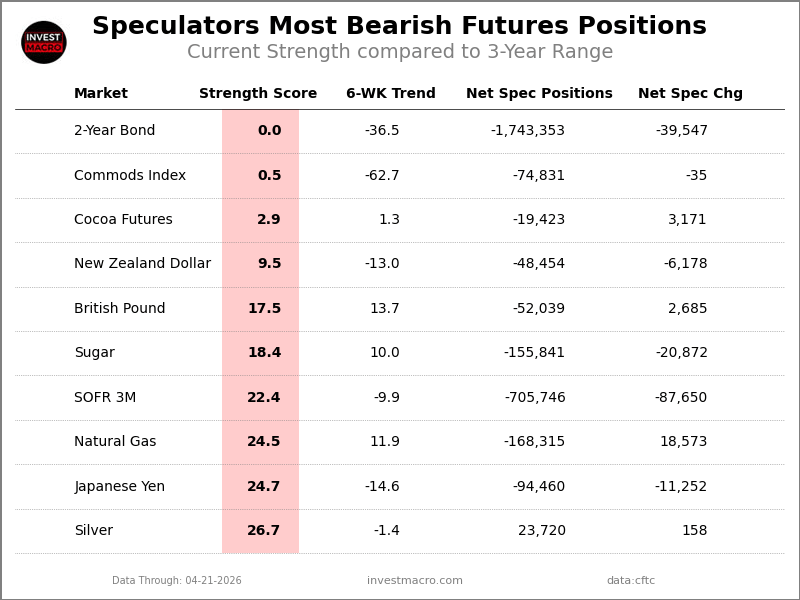
This weekly Extreme Positions report highlights the Most Bullish and Most Bearish Positions for the speculator category and is a current snapshot of how speculators were positioned as of Tuesday. Extreme positioning in these markets can foreshadow strong moves in the underlying market.
To signify an extreme position, we use the Strength Index (also known as the COT Index) of each instrument, a common method of measuring COT data. The Strength Index is simply a comparison of current trader positions against the range of positions over the previous 3 years. We use over 80 percent as extremely bullish and under 20 percent as extremely bearish (Compare Strength Index scores across all markets in the data table or cot leaders table). The 6-Week Trend score is the change in the Strength Index over the past 6 weeks and signals how strong and which way the Strength Index is going.
Free Reports:
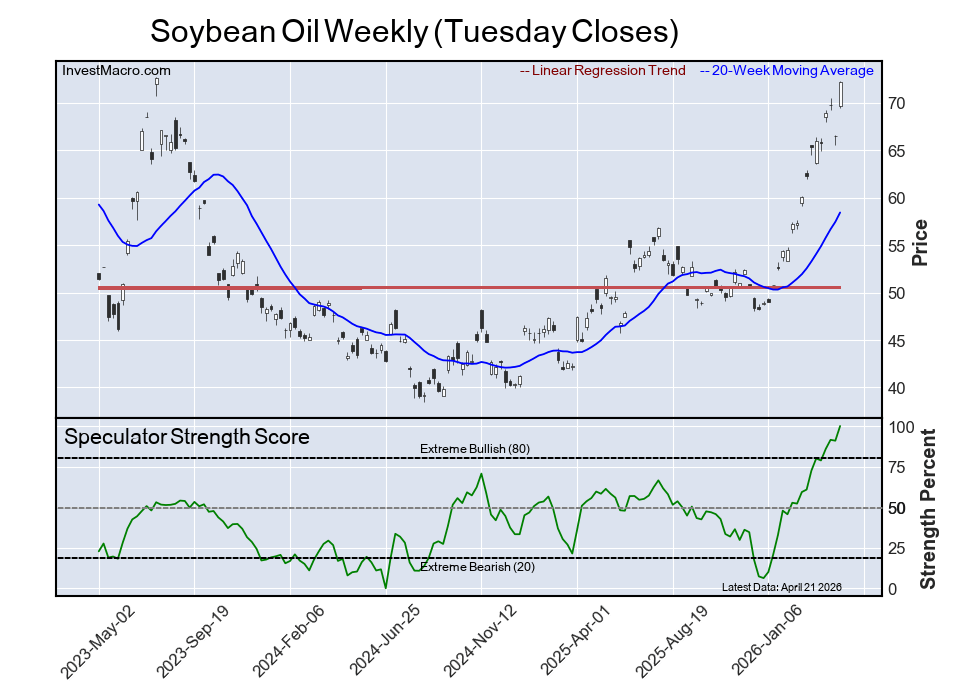
The Soybean Oil speculator position comes in as the most bullish extreme standing this week as the Soybean Oil speculator level is currently at a maximum 100 percent score of its 3-year range.
The six-week trend for the percent strength score totaled a gain of 28 percentage points this week. The overall net speculator position was a total of 169,081 net contracts this week with an advance of 22,135 contract in the weekly speculator bets.
Speculators or Non-Commercials Notes:
Speculators, classified as non-commercial traders by the CFTC, are made up of large commodity funds, hedge funds and other significant for-profit participants. The Specs are generally regarded as trend-followers in their behavior towards price action – net speculator bets and prices tend to go in the same directions. These traders often look to buy when prices are rising and sell when prices are falling. To illustrate this point, many times speculator contracts can be found at their most extremes (bullish or bearish) when prices are also close to their highest or lowest levels.
These extreme levels can be dangerous for the large speculators as the trade is most crowded, there is less trading ammunition still sitting on the sidelines to push the trend further and prices have moved a significant distance. When the trend becomes exhausted, some speculators take profits while others look to also exit positions when prices fail to continue in the same direction. This process usually plays out over many months to years and can ultimately create a reverse effect where prices start to fall and speculators start a process of selling when prices are falling.
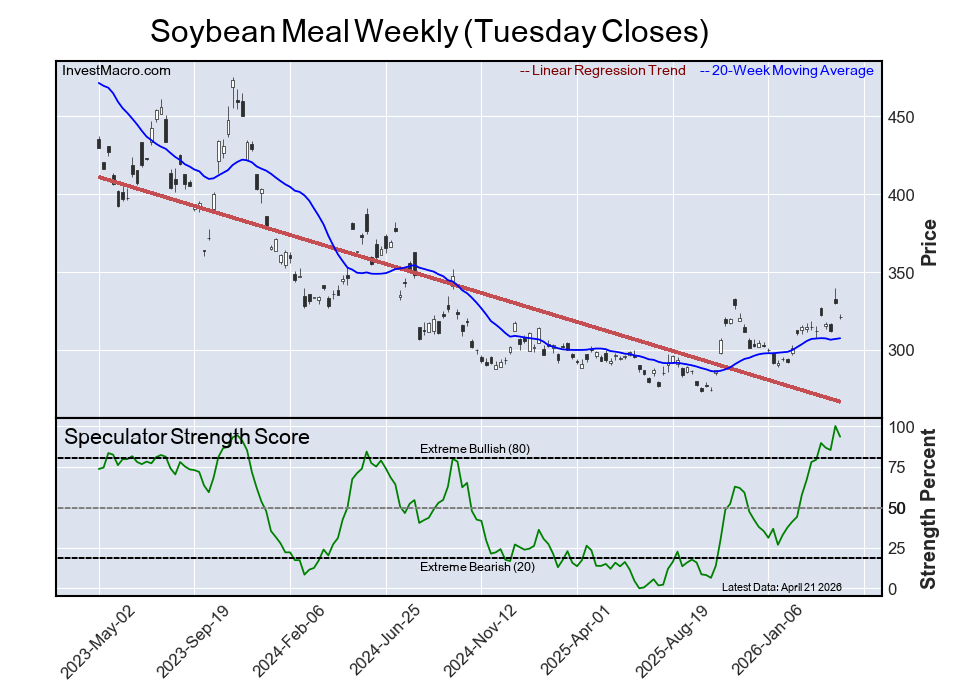
The Soybean Meal speculator position comes next in the extreme standings this week as the Soybean Meal speculator level is now at a 93 percent score of its 3-year range.
The six-week trend for the percent strength score was an advance of 16 percentage points this week while the speculator position registered 136,455 net contracts this week with a weekly fall of -15,760 contracts in speculator bets.
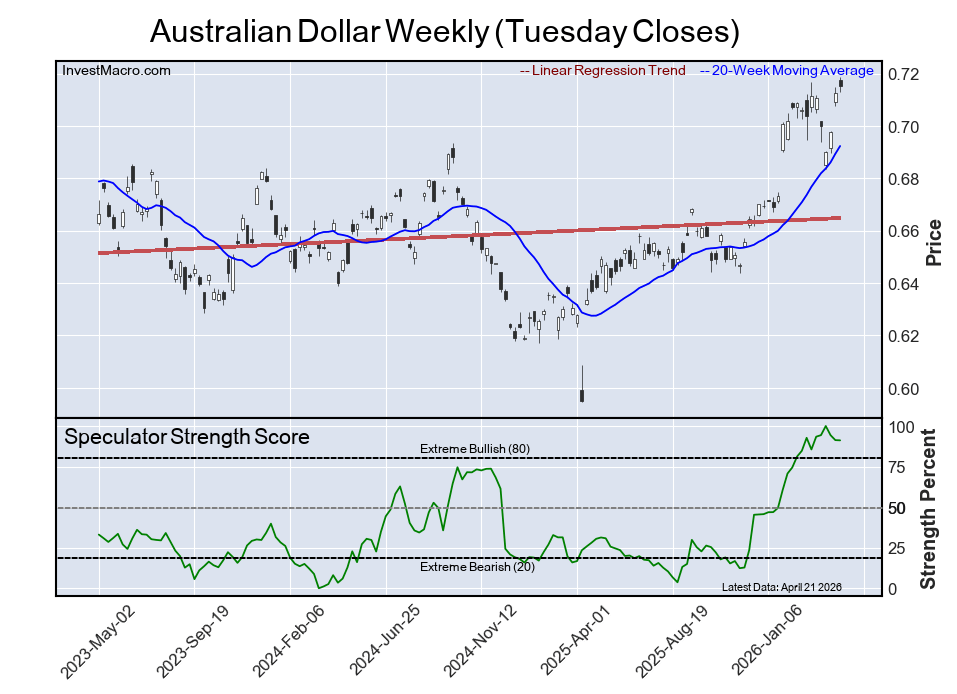
The Australian Dollar speculator position comes in third this week in the extreme standings. The AUD speculator level resides at a 91 percent score of its 3-year range.
The six-week trend for the speculator strength score came in at an increase by 6 percentage points this week and the overall speculator position was 64,817 net contracts this week with a small retreat of -258 contracts in the weekly speculator bets.
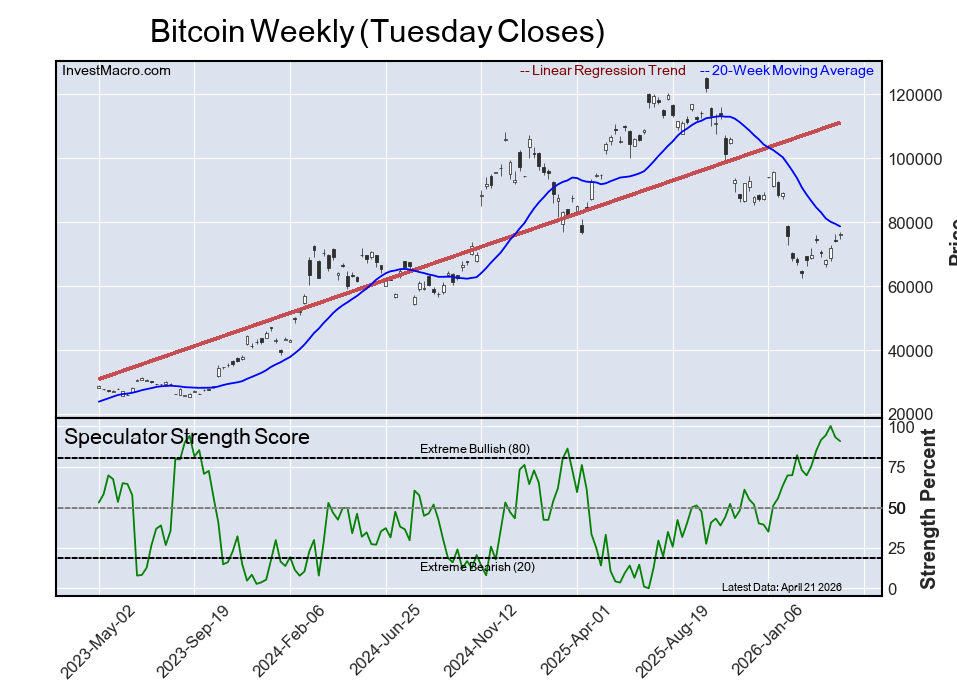
The Bitcoin speculator position comes up number four in the extreme standings this week. The Bitcoin speculator level is at a 91 percent score of its 3-year range.
The six-week trend for the speculator strength score totaled a gain of 15 percentage points this week while the overall speculator position was 2,071 net contracts this week with a decline of -122 contracts in the speculator bets.
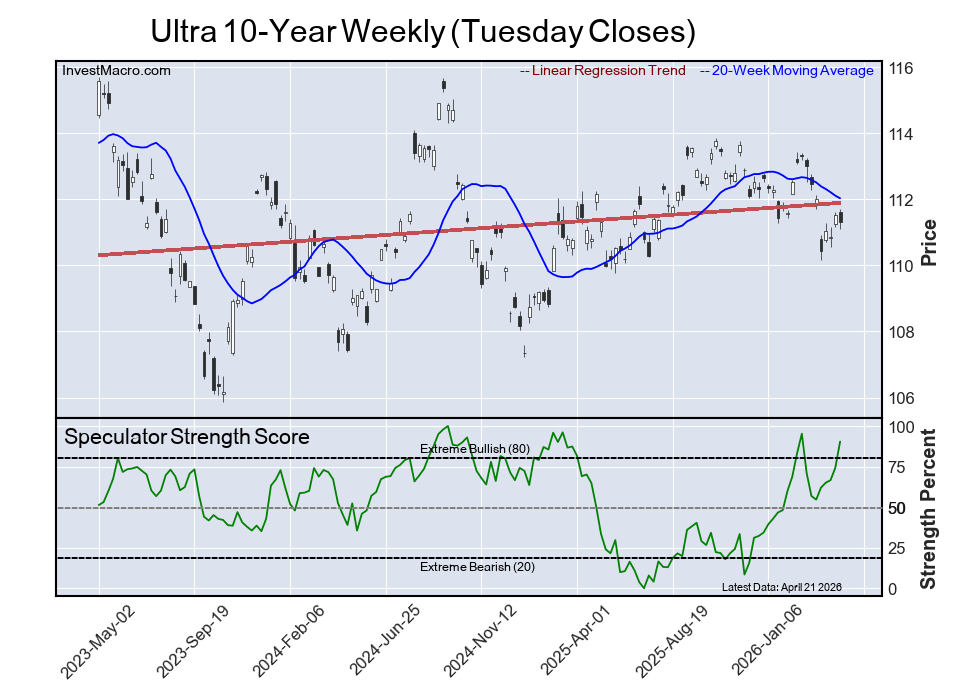
The Ultra 10-Year speculator position rounds out the top five in this week’s bullish extreme standings. The Ultra 10-Year speculator level sits at a 90 percent score of its 3-year range and the six-week trend for the speculator strength score was a rise higher by 34 percentage points this week.
The speculator position was -73,195 net contracts this week with an increase of 59,678 contracts in the weekly speculator bets.
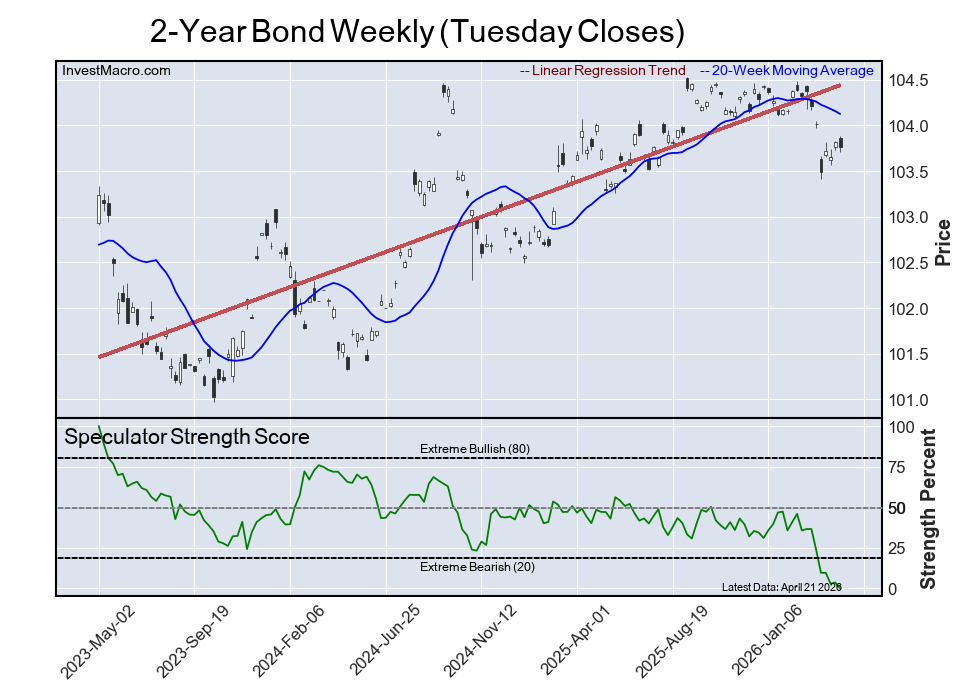
The 2-Year Bond speculator position comes in as the most bearish extreme standing this week with the 2-Year speculator level at a minimum 0 percent score of its 3-year range.
The six-week trend for the speculator strength score was a fall by -37 percentage points this week and the overall speculator position was -1,743,353 net contracts this week with a retreat of -39,547 contracts in the speculator bets.
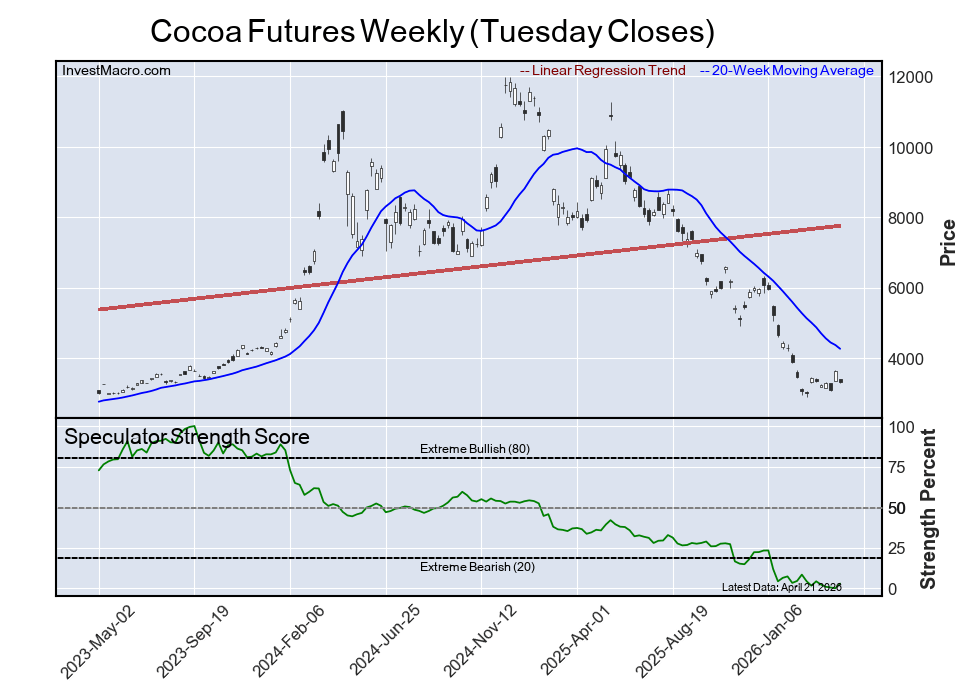
The Cocoa Futures speculator position comes in next for the most bearish extreme standing on the week as the Cocoa speculator level is at a 3 percent score of its 3-year range.
The six-week trend for the speculator strength score was a boost of 1 percentage points this week while the speculator position was -19,423 net contracts this week with a gain of 3,171 contracts in the weekly speculator bets.
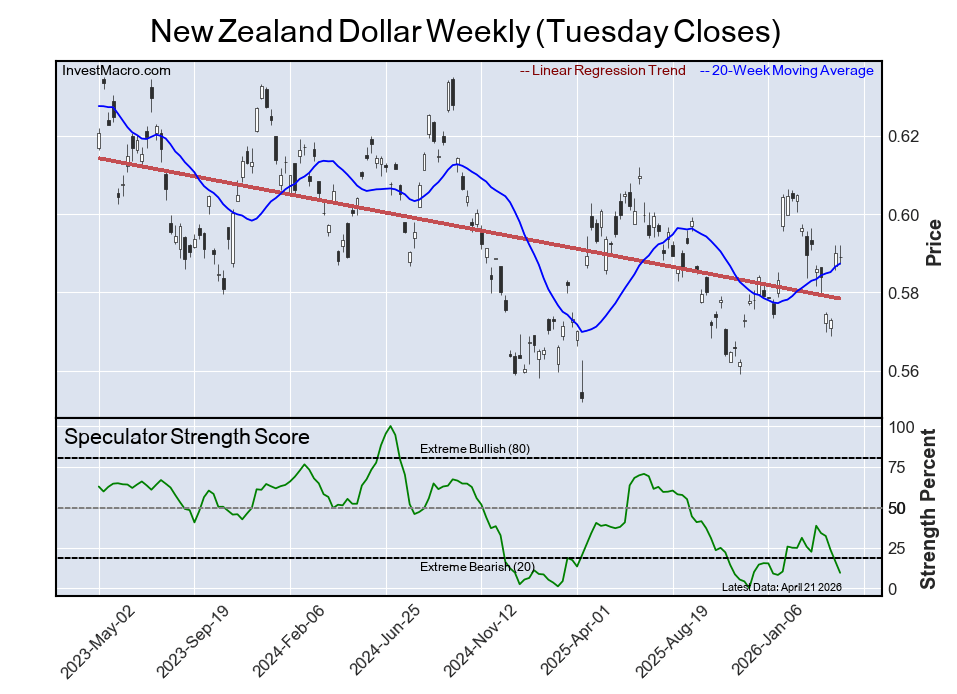
The New Zealand Dollar speculator position comes in as third most bearish standing of the week. The NZD speculator level resides at a 10 percent score of its 3-year range and the six-week trend for the speculator strength score was a decline of -13 percentage points this week.
The overall speculator position was -48,454 net contracts this week with a decline of -6,178 contracts in the speculator bets.
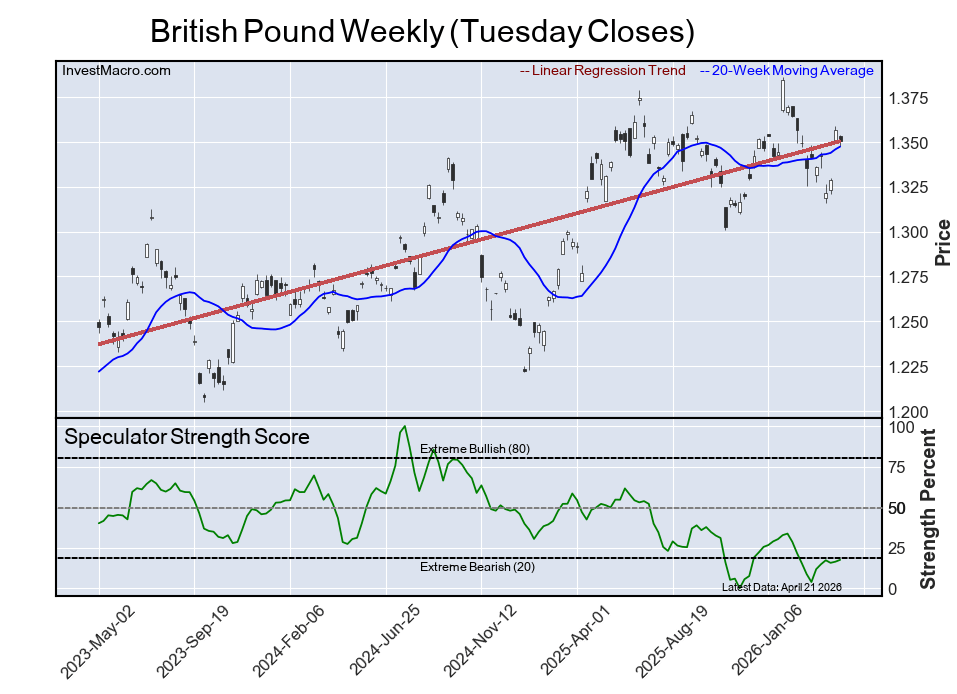
The British Pound speculator position comes in as this week’s fourth most bearish standing as the GBP speculator level sits at a 17 percent score of its 3-year range.
The six-week trend for the speculator strength score was an advance of 14 percentage points this week and the speculator position was -52,039 net contracts this week with an increase of 2,685 contracts in the weekly speculator bets.
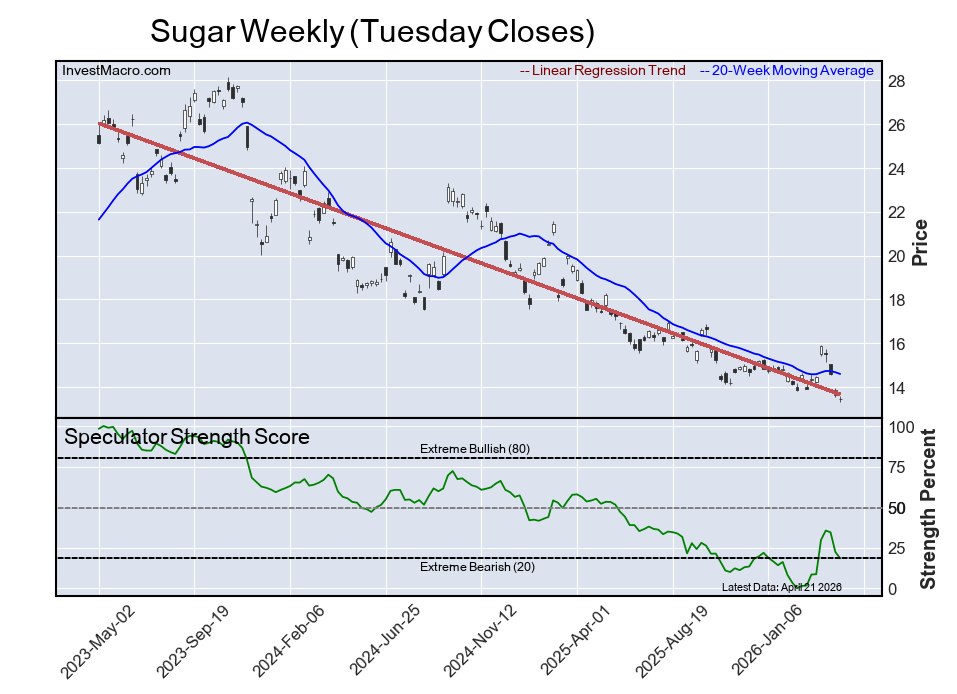
Next, the Sugar speculator position comes in as the fifth most bearish standing for this week. The Sugar speculator level is at a 18 percent score of its 3-year range.
The six-week trend for the speculator strength score was a boost of 10 percentage points this week while the speculator position was -155,841 net contracts this week with a drop of -20,872 contracts in the weekly speculator bets.
Article By InvestMacro – Receive our weekly COT Newsletter
*COT Report: The COT data, released weekly to the public each Friday, is updated through the most recent Tuesday (data is 3 days old) and shows a quick view of how large speculators or non-commercials (for-profit traders) were positioned in the futures markets.
The CFTC categorizes trader positions according to commercial hedgers (traders who use futures contracts for hedging as part of the business), non-commercials (large traders who speculate to realize trading profits) and nonreportable traders (usually small traders/speculators) as well as their open interest (contracts open in the market at time of reporting). See CFTC criteria here.
By JustMarkets The US stock indices ended Friday’s session in the red. By the end…
By Analytical Department RoboForex USD/JPY opens the week at 162.36 on Monday. The Japanese yen…
By InvestMacro Here are the latest charts and statistics for the Commitment of Traders (COT)…
By InvestMacro The latest update for the weekly Commitment of Traders (COT) report was released…
By InvestMacro Here are the latest charts and statistics for the Commitment of Traders (COT)…
By InvestMacro Here are the latest charts and statistics for the Commitment of Traders (COT)…
This website uses cookies.