By InvestMacro
Here are the latest charts and statistics for the Commitment of Traders (COT) reports data published by the Commodities Futures Trading Commission (CFTC).
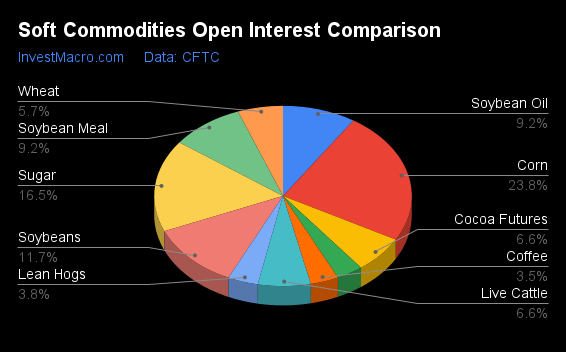
The latest COT data is updated through Tuesday July 3rd and shows a quick view of how large traders (for-profit speculators and commercial entities) were positioned in the futures markets.
The COT soft commodities markets speculator bets were lower this week as five out of the eleven softs markets we cover had higher positioning while the other six markets had lower speculator contracts.
Free Reports:
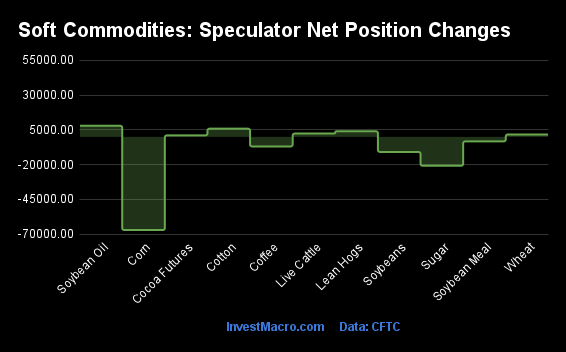
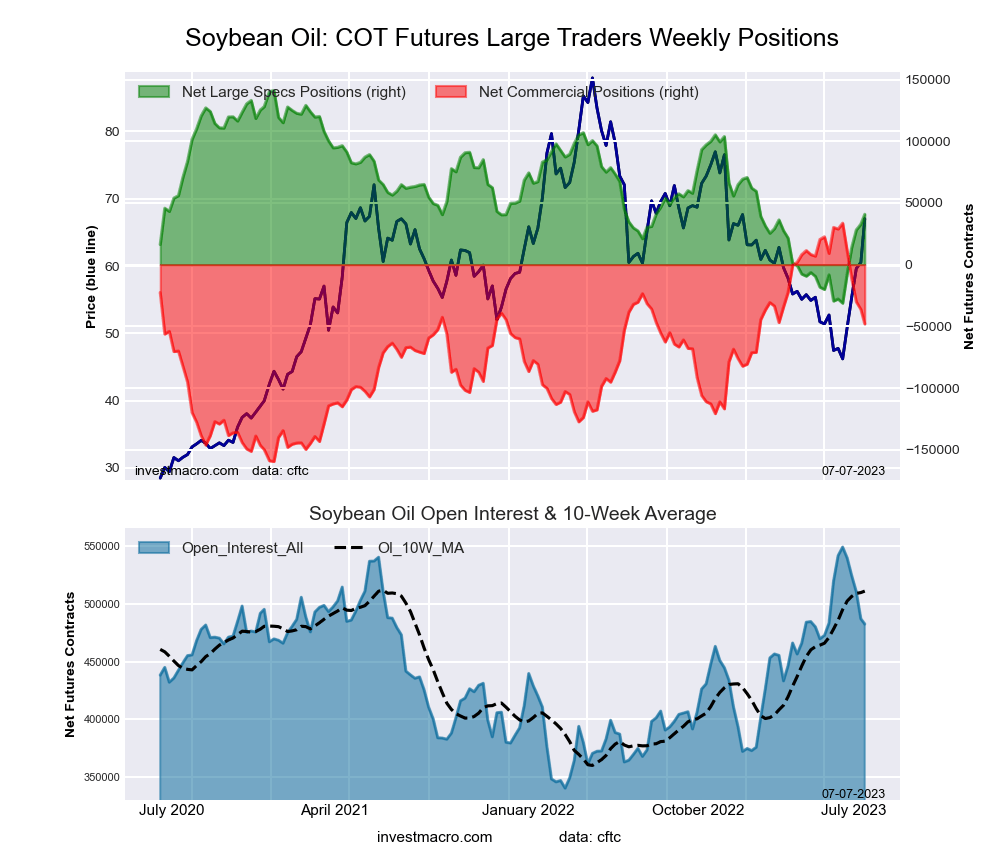
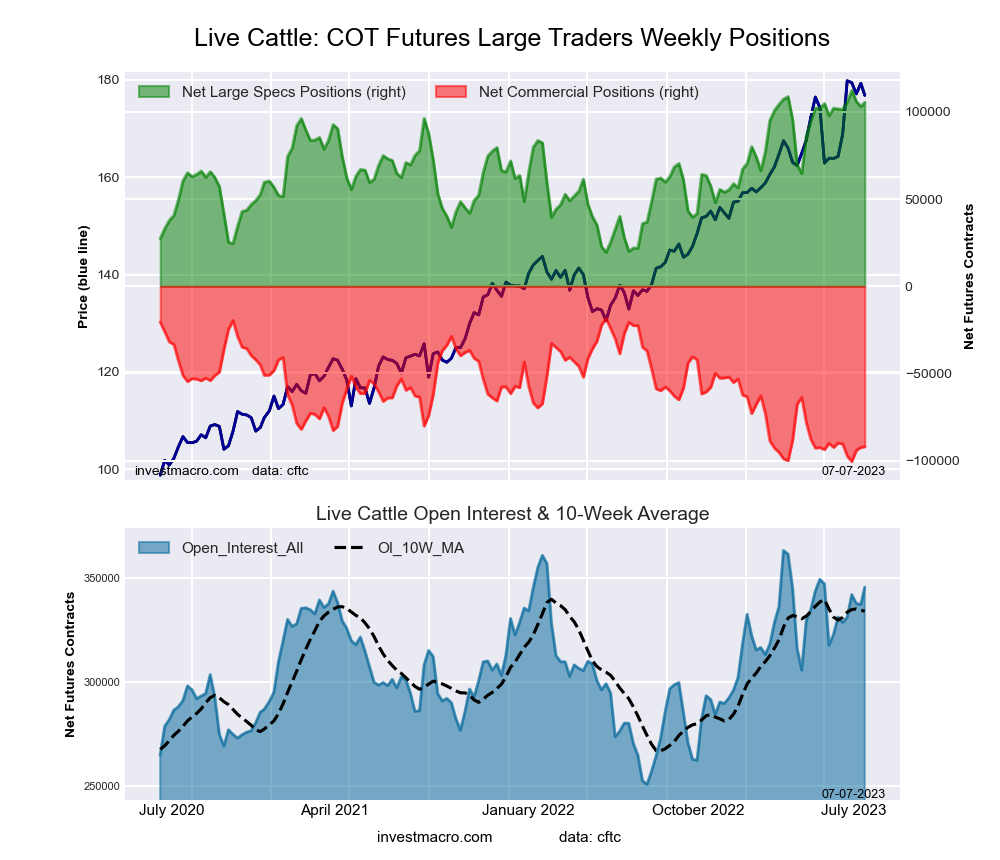
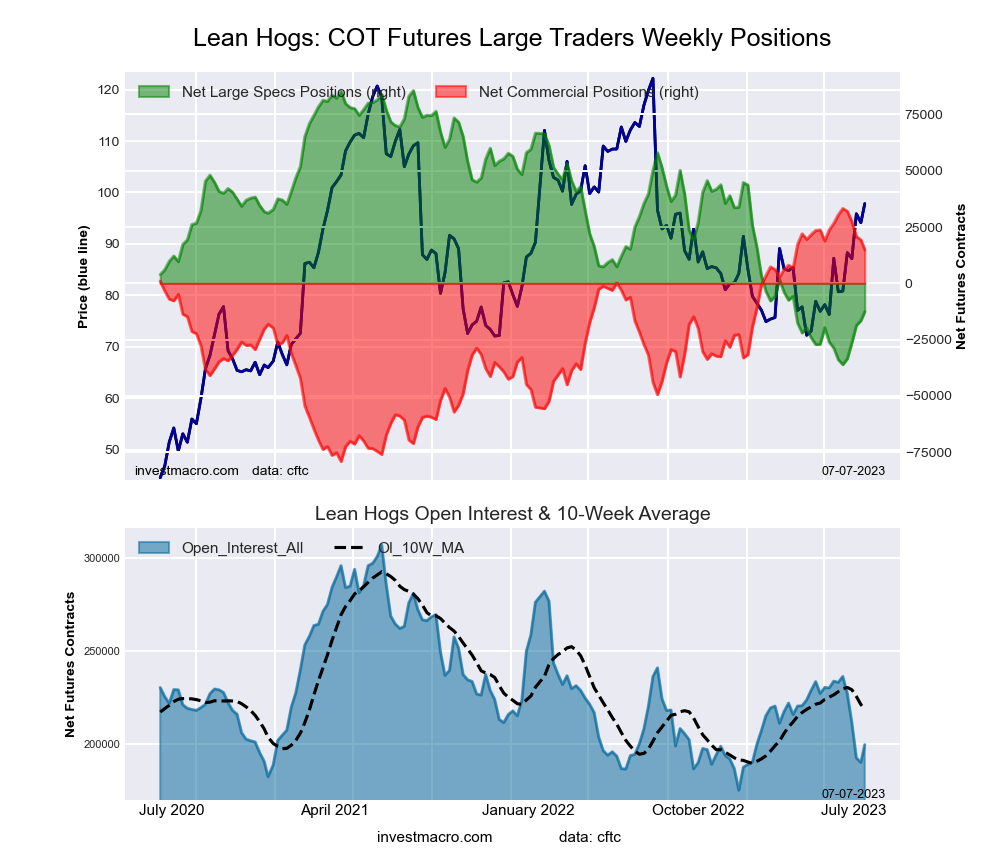
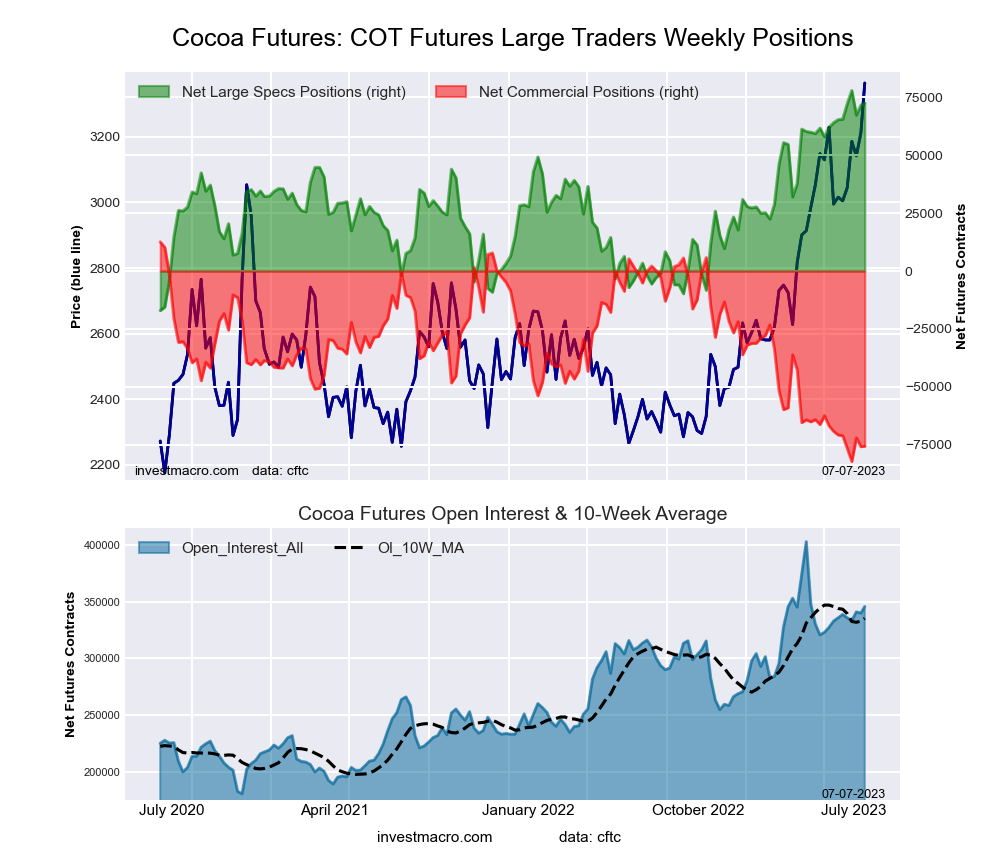
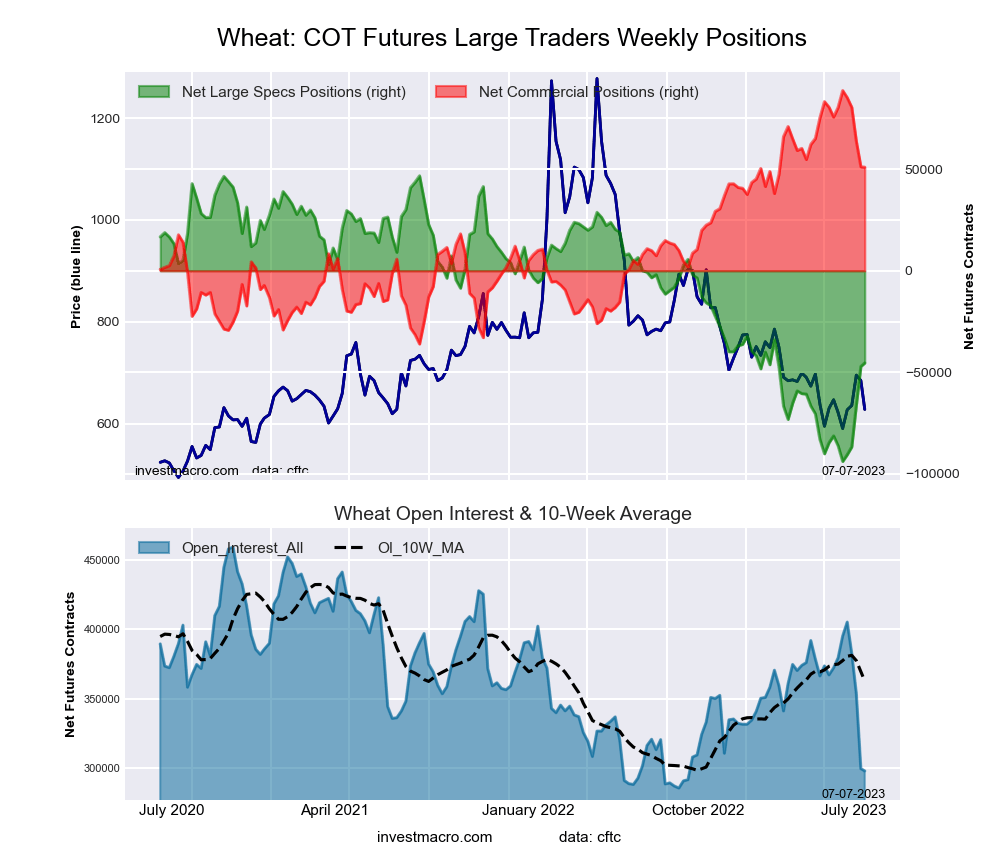
Leading the gains for the softs markets was Soybean Oil (7,992 contracts) with Lean Hogs (4,006 contracts), Live Cattle (2,354 contracts), Wheat (1,713 contracts) and Cocoa (1,032 contracts) also showing positive weeks.
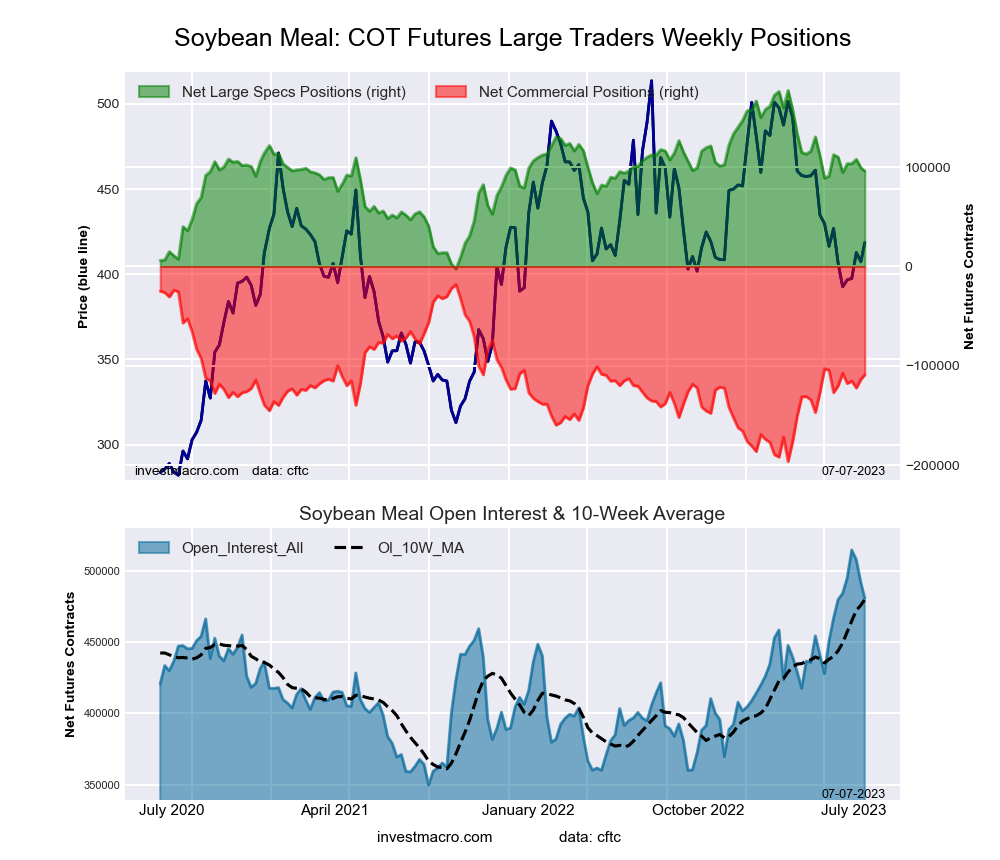
The markets with the declines in speculator bets this week were Corn (-67,035 contracts) with Sugar (-20,806 contracts), Coffee (-18,522 contracts), Soybeans (-10,876 contracts), Cotton (-8,336 contracts) and Soybean Meal (-3,275 contracts) also registering lower bets on the week.
| Jul-03-2023 | OI | OI-Index | Spec-Net | Spec-Index | Com-Net | COM-Index | Smalls-Net | Smalls-Index |
|---|---|---|---|---|---|---|---|---|
| WTI Crude | 1,816,043 | 37 | 141,429 | 1 | -170,148 | 99 | 28,719 | 37 |
| Gold | 448,063 | 12 | 163,097 | 49 | -184,717 | 53 | 21,620 | 34 |
| Silver | 114,421 | 0 | 17,990 | 44 | -29,569 | 58 | 11,579 | 31 |
| Copper | 204,399 | 46 | 1,888 | 32 | -4,003 | 68 | 2,115 | 32 |
| Palladium | 14,781 | 100 | -7,890 | 0 | 8,358 | 100 | -468 | 14 |
| Platinum | 69,383 | 70 | 8,067 | 34 | -13,570 | 65 | 5,503 | 42 |
| Natural Gas | 1,241,419 | 57 | -98,775 | 33 | 68,313 | 67 | 30,462 | 52 |
| Brent | 127,019 | 1 | -39,873 | 34 | 38,114 | 70 | 1,759 | 33 |
| Heating Oil | 305,681 | 38 | 27,699 | 78 | -41,810 | 40 | 14,111 | 47 |
| Soybeans | 610,352 | 8 | 90,973 | 25 | -71,924 | 72 | -19,049 | 55 |
| Corn | 1,246,983 | 8 | 46,403 | 28 | 524 | 76 | -46,927 | 46 |
| Coffee | 180,118 | 3 | 8,495 | 36 | -8,052 | 68 | -443 | 7 |
| Sugar | 863,843 | 40 | 199,368 | 61 | -229,713 | 39 | 30,345 | 42 |
| Wheat | 297,933 | 7 | -45,464 | 34 | 51,053 | 70 | -5,589 | 54 |
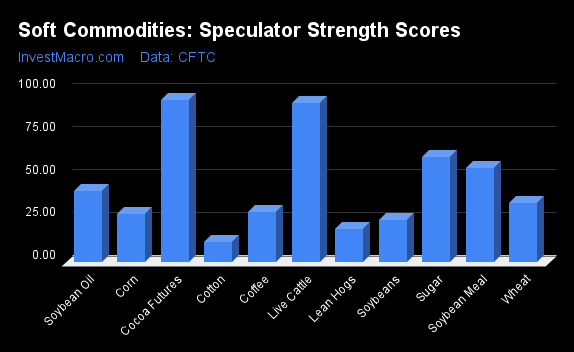
COT Strength Scores (a normalized measure of Speculator positions over a 3-Year range, from 0 to 100 where above 80 is Extreme-Bullish and below 20 is Extreme-Bearish) showed that Cocoa (94 percent) and Live Cattle (93 percent) lead the softs markets this week and are in Bullish-Extreme levels. Sugar (61 percent), Soybean Meal (55 percent) and Soybean Oil (42 percent) come in as the next highest in the weekly strength scores.
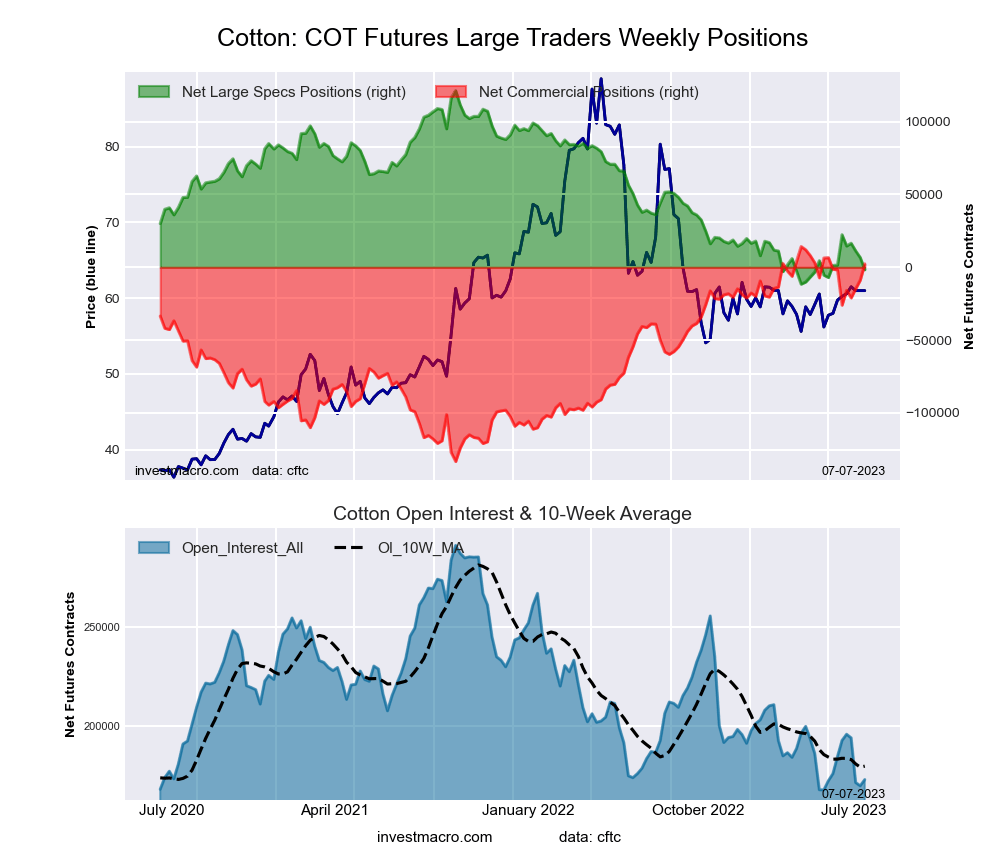
On the downside, Cotton (7 percent) and Lean Hogs (19 percent) come in at the lowest strength levels currently and are in Extreme-Bearish territory (below 20 percent).
Strength Statistics:
Corn (28.1 percent) vs Corn previous week (37.8 percent)
Sugar (61.4 percent) vs Sugar previous week (68.7 percent)
Coffee (36.1 percent) vs Coffee previous week (61.8 percent)
Soybeans (24.9 percent) vs Soybeans previous week (29.2 percent)
Soybean Oil (41.8 percent) vs Soybean Oil previous week (37.2 percent)
Soybean Meal (54.9 percent) vs Soybean Meal previous week (56.7 percent)
Live Cattle (92.7 percent) vs Live Cattle previous week (90.1 percent)
Lean Hogs (19.3 percent) vs Lean Hogs previous week (16.1 percent)
Cotton (7.5 percent) vs Cotton previous week (13.7 percent)
Cocoa (94.4 percent) vs Cocoa previous week (93.3 percent)
Wheat (34.5 percent) vs Wheat previous week (33.3 percent)
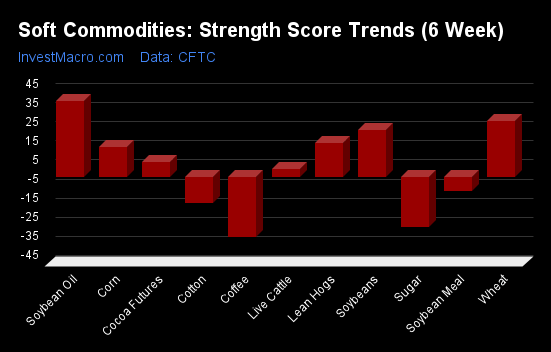
COT Strength Score Trends (or move index, calculates the 6-week changes in strength scores) showed that Soybean Oil (40 percent) and Wheat (29 percent) lead the past six weeks trends for soft commodities. Soybeans (24 percent), Lean Hogs (17 percent) and Corn (16 percent) are the next highest positive movers in the latest trends data.
Sugar (-26 percent) leads the downside trend scores currently with Coffee (-23 percent), Soybean Meal (-8 percent) and Cotton (-2 percent) following next with lower trend scores.
Strength Trend Statistics:
Corn (15.6 percent) vs Corn previous week (23.2 percent)
Sugar (-26.4 percent) vs Sugar previous week (-17.9 percent)
Coffee (-23.1 percent) vs Coffee previous week (-0.0 percent)
Soybeans (24.3 percent) vs Soybeans previous week (25.0 percent)
Soybean Oil (39.8 percent) vs Soybean Oil previous week (36.1 percent)
Soybean Meal (-7.8 percent) vs Soybean Meal previous week (-7.3 percent)
Live Cattle (4.1 percent) vs Live Cattle previous week (1.0 percent)
Lean Hogs (17.5 percent) vs Lean Hogs previous week (10.0 percent)
Cotton (-2.4 percent) vs Cotton previous week (4.1 percent)
Cocoa (7.6 percent) vs Cocoa previous week (7.9 percent)
Wheat (29.0 percent) vs Wheat previous week (24.3 percent)
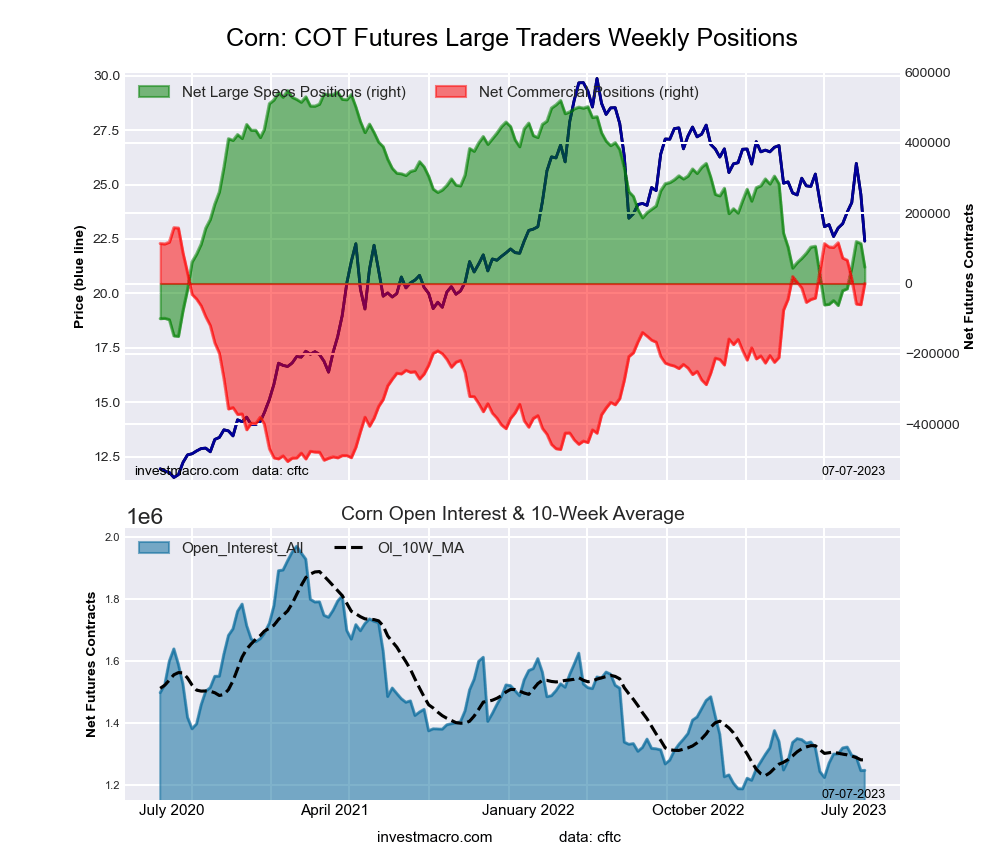
This week’s current strength score (the trader positioning range over the past three years, measured from 0 to 100) shows the speculators are currently Bearish with a score of 28.1 percent. The commercials are Bullish with a score of 76.2 percent and the small traders (not shown in chart) are Bearish with a score of 46.5 percent.
Our weekly trend-following model classifies the current market price position as: Strong Downtrend. The current action for the model is considered to be: Hold – Maintain Short Position.
| CORN Futures Statistics | SPECULATORS | COMMERCIALS | SMALL TRADERS |
| – Percent of Open Interest Longs: | 21.7 | 49.0 | 9.8 |
| – Percent of Open Interest Shorts: | 18.0 | 48.9 | 13.6 |
| – Net Position: | 46,403 | 524 | -46,927 |
| – Gross Longs: | 270,772 | 610,770 | 122,354 |
| – Gross Shorts: | 224,369 | 610,246 | 169,281 |
| – Long to Short Ratio: | 1.2 to 1 | 1.0 to 1 | 0.7 to 1 |
| NET POSITION TREND: | |||
| – Strength Index Score (3 Year Range Pct): | 28.1 | 76.2 | 46.5 |
| – Strength Index Reading (3 Year Range): | Bearish | Bullish | Bearish |
| NET POSITION MOVEMENT INDEX: | |||
| – 6-Week Change in Strength Index: | 15.6 | -17.4 | 9.0 |
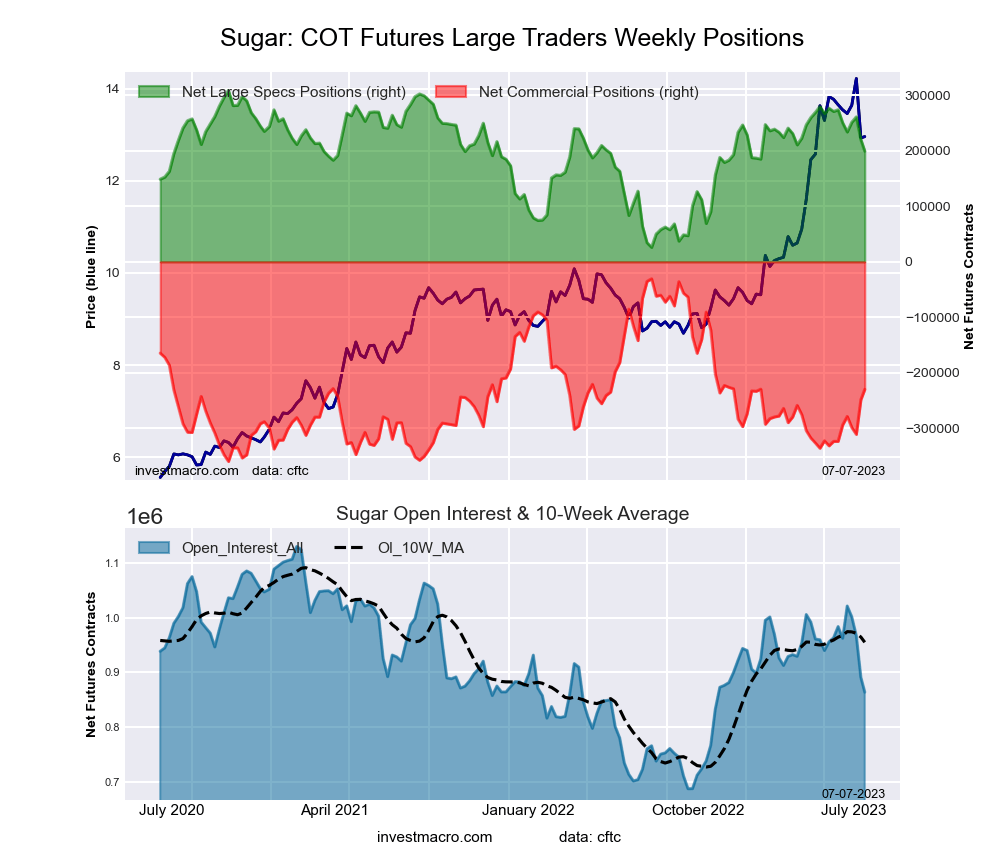
This week’s current strength score (the trader positioning range over the past three years, measured from 0 to 100) shows the speculators are currently Bullish with a score of 61.4 percent. The commercials are Bearish with a score of 39.5 percent and the small traders (not shown in chart) are Bearish with a score of 41.9 percent.
Our weekly trend-following model classifies the current market price position as: Uptrend. The current action for the model is considered to be: Hold – Maintain Long Position.
| SUGAR Futures Statistics | SPECULATORS | COMMERCIALS | SMALL TRADERS |
| – Percent of Open Interest Longs: | 32.5 | 43.3 | 8.6 |
| – Percent of Open Interest Shorts: | 9.4 | 69.9 | 5.1 |
| – Net Position: | 199,368 | -229,713 | 30,345 |
| – Gross Longs: | 280,634 | 374,262 | 74,497 |
| – Gross Shorts: | 81,266 | 603,975 | 44,152 |
| – Long to Short Ratio: | 3.5 to 1 | 0.6 to 1 | 1.7 to 1 |
| NET POSITION TREND: | |||
| – Strength Index Score (3 Year Range Pct): | 61.4 | 39.5 | 41.9 |
| – Strength Index Reading (3 Year Range): | Bullish | Bearish | Bearish |
| NET POSITION MOVEMENT INDEX: | |||
| – 6-Week Change in Strength Index: | -26.4 | 28.5 | -25.2 |
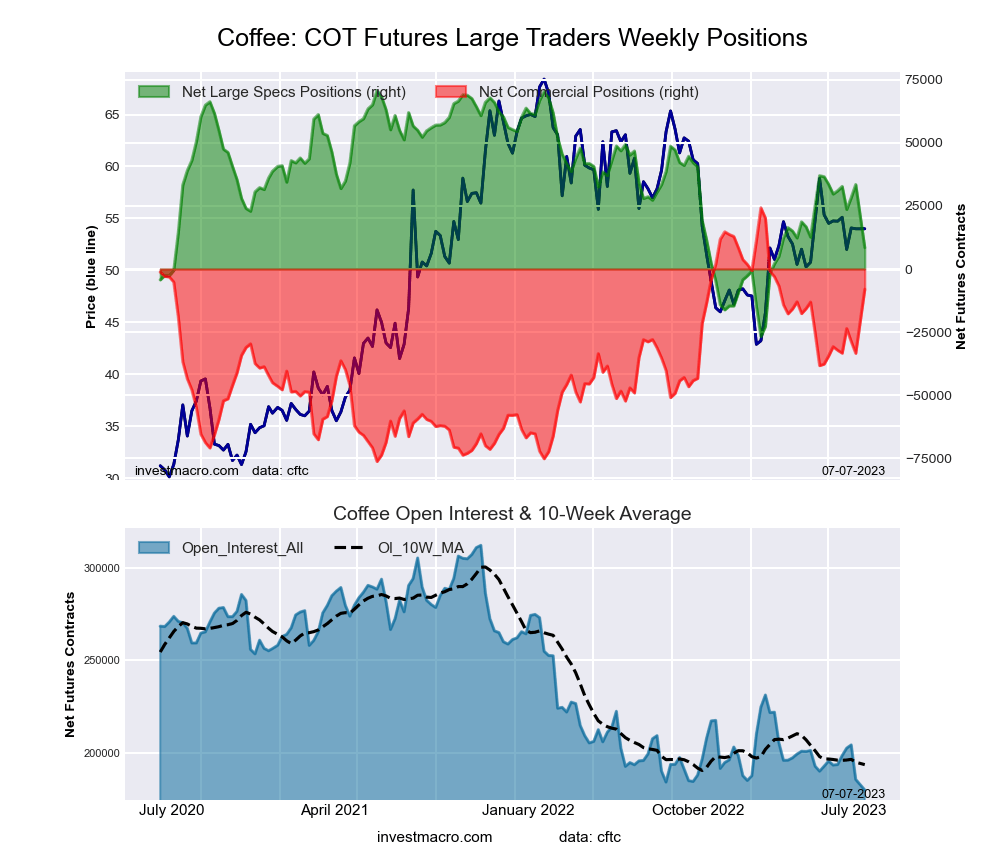
This week’s current strength score (the trader positioning range over the past three years, measured from 0 to 100) shows the speculators are currently Bearish with a score of 36.1 percent. The commercials are Bullish with a score of 67.9 percent and the small traders (not shown in chart) are Bearish-Extreme with a score of 7.3 percent.
Our weekly trend-following model classifies the current market price position as: Uptrend. The current action for the model is considered to be: Hold – Maintain Long Position.
| COFFEE Futures Statistics | SPECULATORS | COMMERCIALS | SMALL TRADERS |
| – Percent of Open Interest Longs: | 23.4 | 47.0 | 3.7 |
| – Percent of Open Interest Shorts: | 18.7 | 51.4 | 3.9 |
| – Net Position: | 8,495 | -8,052 | -443 |
| – Gross Longs: | 42,190 | 84,606 | 6,662 |
| – Gross Shorts: | 33,695 | 92,658 | 7,105 |
| – Long to Short Ratio: | 1.3 to 1 | 0.9 to 1 | 0.9 to 1 |
| NET POSITION TREND: | |||
| – Strength Index Score (3 Year Range Pct): | 36.1 | 67.9 | 7.3 |
| – Strength Index Reading (3 Year Range): | Bearish | Bullish | Bearish-Extreme |
| NET POSITION MOVEMENT INDEX: | |||
| – 6-Week Change in Strength Index: | -23.1 | 24.0 | -19.8 |
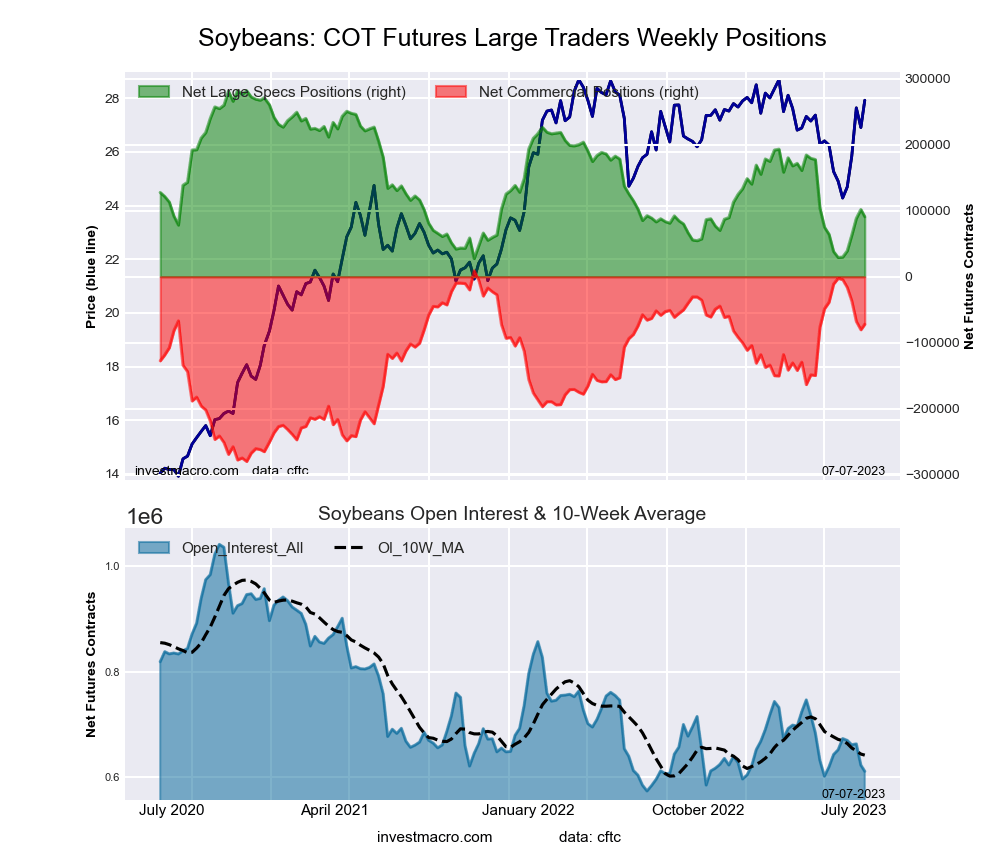
This week’s current strength score (the trader positioning range over the past three years, measured from 0 to 100) shows the speculators are currently Bearish with a score of 24.9 percent. The commercials are Bullish with a score of 72.0 percent and the small traders (not shown in chart) are Bullish with a score of 55.3 percent.
Our weekly trend-following model classifies the current market price position as: Weak Downtrend. The current action for the model is considered to be: Hold – Maintain Short Position.
| SOYBEANS Futures Statistics | SPECULATORS | COMMERCIALS | SMALL TRADERS |
| – Percent of Open Interest Longs: | 27.9 | 50.2 | 7.1 |
| – Percent of Open Interest Shorts: | 13.0 | 62.0 | 10.2 |
| – Net Position: | 90,973 | -71,924 | -19,049 |
| – Gross Longs: | 170,206 | 306,598 | 43,239 |
| – Gross Shorts: | 79,233 | 378,522 | 62,288 |
| – Long to Short Ratio: | 2.1 to 1 | 0.8 to 1 | 0.7 to 1 |
| NET POSITION TREND: | |||
| – Strength Index Score (3 Year Range Pct): | 24.9 | 72.0 | 55.3 |
| – Strength Index Reading (3 Year Range): | Bearish | Bullish | Bullish |
| NET POSITION MOVEMENT INDEX: | |||
| – 6-Week Change in Strength Index: | 24.3 | -24.1 | 17.8 |
This week’s current strength score (the trader positioning range over the past three years, measured from 0 to 100) shows the speculators are currently Bearish with a score of 41.8 percent. The commercials are Bullish with a score of 57.7 percent and the small traders (not shown in chart) are Bearish with a score of 40.5 percent.
Our weekly trend-following model classifies the current market price position as: Strong Uptrend. The current action for the model is considered to be: New Buy – Long Position.
| SOYBEAN OIL Futures Statistics | SPECULATORS | COMMERCIALS | SMALL TRADERS |
| – Percent of Open Interest Longs: | 17.6 | 56.9 | 6.6 |
| – Percent of Open Interest Shorts: | 9.2 | 66.8 | 5.1 |
| – Net Position: | 40,809 | -48,028 | 7,219 |
| – Gross Longs: | 85,067 | 274,385 | 32,017 |
| – Gross Shorts: | 44,258 | 322,413 | 24,798 |
| – Long to Short Ratio: | 1.9 to 1 | 0.9 to 1 | 1.3 to 1 |
| NET POSITION TREND: | |||
| – Strength Index Score (3 Year Range Pct): | 41.8 | 57.7 | 40.5 |
| – Strength Index Reading (3 Year Range): | Bearish | Bullish | Bearish |
| NET POSITION MOVEMENT INDEX: | |||
| – 6-Week Change in Strength Index: | 39.8 | -39.8 | 30.8 |
This week’s current strength score (the trader positioning range over the past three years, measured from 0 to 100) shows the speculators are currently Bullish with a score of 54.9 percent. The commercials are Bearish with a score of 48.9 percent and the small traders (not shown in chart) are Bearish-Extreme with a score of 14.0 percent.
Our weekly trend-following model classifies the current market price position as: Downtrend. The current action for the model is considered to be: Hold – Maintain Short Position.
| SOYBEAN MEAL Futures Statistics | SPECULATORS | COMMERCIALS | SMALL TRADERS |
| – Percent of Open Interest Longs: | 24.6 | 37.9 | 9.0 |
| – Percent of Open Interest Shorts: | 4.6 | 60.6 | 6.3 |
| – Net Position: | 95,998 | -109,012 | 13,014 |
| – Gross Longs: | 118,320 | 182,431 | 43,129 |
| – Gross Shorts: | 22,322 | 291,443 | 30,115 |
| – Long to Short Ratio: | 5.3 to 1 | 0.6 to 1 | 1.4 to 1 |
| NET POSITION TREND: | |||
| – Strength Index Score (3 Year Range Pct): | 54.9 | 48.9 | 14.0 |
| – Strength Index Reading (3 Year Range): | Bullish | Bearish | Bearish-Extreme |
| NET POSITION MOVEMENT INDEX: | |||
| – 6-Week Change in Strength Index: | -7.8 | 6.1 | 14.0 |
This week’s current strength score (the trader positioning range over the past three years, measured from 0 to 100) shows the speculators are currently Bullish-Extreme with a score of 92.7 percent. The commercials are Bearish-Extreme with a score of 10.3 percent and the small traders (not shown in chart) are Bearish-Extreme with a score of 14.7 percent.
Our weekly trend-following model classifies the current market price position as: Uptrend. The current action for the model is considered to be: Hold – Maintain Long Position.
| LIVE CATTLE Futures Statistics | SPECULATORS | COMMERCIALS | SMALL TRADERS |
| – Percent of Open Interest Longs: | 44.4 | 29.0 | 8.0 |
| – Percent of Open Interest Shorts: | 13.9 | 55.6 | 11.9 |
| – Net Position: | 105,443 | -92,019 | -13,424 |
| – Gross Longs: | 153,517 | 100,089 | 27,594 |
| – Gross Shorts: | 48,074 | 192,108 | 41,018 |
| – Long to Short Ratio: | 3.2 to 1 | 0.5 to 1 | 0.7 to 1 |
| NET POSITION TREND: | |||
| – Strength Index Score (3 Year Range Pct): | 92.7 | 10.3 | 14.7 |
| – Strength Index Reading (3 Year Range): | Bullish-Extreme | Bearish-Extreme | Bearish-Extreme |
| NET POSITION MOVEMENT INDEX: | |||
| – 6-Week Change in Strength Index: | 4.1 | -2.6 | -9.3 |
This week’s current strength score (the trader positioning range over the past three years, measured from 0 to 100) shows the speculators are currently Bearish-Extreme with a score of 19.3 percent. The commercials are Bullish-Extreme with a score of 83.6 percent and the small traders (not shown in chart) are Bullish with a score of 73.2 percent.
Our weekly trend-following model classifies the current market price position as: Strong Uptrend. The current action for the model is considered to be: Hold – Maintain Long Position.
| LEAN HOGS Futures Statistics | SPECULATORS | COMMERCIALS | SMALL TRADERS |
| – Percent of Open Interest Longs: | 29.2 | 39.4 | 9.3 |
| – Percent of Open Interest Shorts: | 35.5 | 32.0 | 10.4 |
| – Net Position: | -12,574 | 14,847 | -2,273 |
| – Gross Longs: | 58,151 | 78,658 | 18,525 |
| – Gross Shorts: | 70,725 | 63,811 | 20,798 |
| – Long to Short Ratio: | 0.8 to 1 | 1.2 to 1 | 0.9 to 1 |
| NET POSITION TREND: | |||
| – Strength Index Score (3 Year Range Pct): | 19.3 | 83.6 | 73.2 |
| – Strength Index Reading (3 Year Range): | Bearish-Extreme | Bullish-Extreme | Bullish |
| NET POSITION MOVEMENT INDEX: | |||
| – 6-Week Change in Strength Index: | 17.5 | -13.9 | -25.6 |
This week’s current strength score (the trader positioning range over the past three years, measured from 0 to 100) shows the speculators are currently Bearish-Extreme with a score of 7.5 percent. The commercials are Bullish-Extreme with a score of 91.9 percent and the small traders (not shown in chart) are Bearish-Extreme with a score of 12.1 percent.
Our weekly trend-following model classifies the current market price position as: Strong Uptrend. The current action for the model is considered to be: Hold – Maintain Long Position.
| COTTON Futures Statistics | SPECULATORS | COMMERCIALS | SMALL TRADERS |
| – Percent of Open Interest Longs: | 30.9 | 50.9 | 6.7 |
| – Percent of Open Interest Shorts: | 31.9 | 49.5 | 7.0 |
| – Net Position: | -1,678 | 2,320 | -642 |
| – Gross Longs: | 53,597 | 88,184 | 11,530 |
| – Gross Shorts: | 55,275 | 85,864 | 12,172 |
| – Long to Short Ratio: | 1.0 to 1 | 1.0 to 1 | 0.9 to 1 |
| NET POSITION TREND: | |||
| – Strength Index Score (3 Year Range Pct): | 7.5 | 91.9 | 12.1 |
| – Strength Index Reading (3 Year Range): | Bearish-Extreme | Bullish-Extreme | Bearish-Extreme |
| NET POSITION MOVEMENT INDEX: | |||
| – 6-Week Change in Strength Index: | -2.4 | 2.8 | -5.7 |
This week’s current strength score (the trader positioning range over the past three years, measured from 0 to 100) shows the speculators are currently Bullish-Extreme with a score of 94.4 percent. The commercials are Bearish-Extreme with a score of 7.0 percent and the small traders (not shown in chart) are Bearish with a score of 26.6 percent.
Our weekly trend-following model classifies the current market price position as: Uptrend. The current action for the model is considered to be: Hold – Maintain Long Position.
| COCOA Futures Statistics | SPECULATORS | COMMERCIALS | SMALL TRADERS |
| – Percent of Open Interest Longs: | 43.8 | 26.1 | 4.1 |
| – Percent of Open Interest Shorts: | 22.8 | 48.0 | 3.2 |
| – Net Position: | 72,584 | -75,594 | 3,010 |
| – Gross Longs: | 151,319 | 90,381 | 14,031 |
| – Gross Shorts: | 78,735 | 165,975 | 11,021 |
| – Long to Short Ratio: | 1.9 to 1 | 0.5 to 1 | 1.3 to 1 |
| NET POSITION TREND: | |||
| – Strength Index Score (3 Year Range Pct): | 94.4 | 7.0 | 26.6 |
| – Strength Index Reading (3 Year Range): | Bullish-Extreme | Bearish-Extreme | Bearish |
| NET POSITION MOVEMENT INDEX: | |||
| – 6-Week Change in Strength Index: | 7.6 | -5.1 | -23.7 |
This week’s current strength score (the trader positioning range over the past three years, measured from 0 to 100) shows the speculators are currently Bearish with a score of 34.5 percent. The commercials are Bullish with a score of 69.7 percent and the small traders (not shown in chart) are Bullish with a score of 53.9 percent.
Our weekly trend-following model classifies the current market price position as: Downtrend. The current action for the model is considered to be: Hold – Maintain Short Position.
| WHEAT Futures Statistics | SPECULATORS | COMMERCIALS | SMALL TRADERS |
| – Percent of Open Interest Longs: | 28.0 | 41.4 | 9.2 |
| – Percent of Open Interest Shorts: | 43.3 | 24.3 | 11.1 |
| – Net Position: | -45,464 | 51,053 | -5,589 |
| – Gross Longs: | 83,554 | 123,400 | 27,557 |
| – Gross Shorts: | 129,018 | 72,347 | 33,146 |
| – Long to Short Ratio: | 0.6 to 1 | 1.7 to 1 | 0.8 to 1 |
| NET POSITION TREND: | |||
| – Strength Index Score (3 Year Range Pct): | 34.5 | 69.7 | 53.9 |
| – Strength Index Reading (3 Year Range): | Bearish | Bullish | Bullish |
| NET POSITION MOVEMENT INDEX: | |||
| – 6-Week Change in Strength Index: | 29.0 | -23.6 | -38.9 |
Article By InvestMacro – Receive our weekly COT Newsletter
*COT Report: The COT data, released weekly to the public each Friday, is updated through the most recent Tuesday (data is 3 days old) and shows a quick view of how large speculators or non-commercials (for-profit traders) were positioned in the futures markets.
The CFTC categorizes trader positions according to commercial hedgers (traders who use futures contracts for hedging as part of the business), non-commercials (large traders who speculate to realize trading profits) and nonreportable traders (usually small traders/speculators) as well as their open interest (contracts open in the market at time of reporting). See CFTC criteria here.
By JustMarkets The US stock indices started the week on a downbeat note. By the…
By Analytical Department RoboForex GBP/USD fell to 1.3437 on Tuesday as investors assessed the appointment…
By JustMarkets The US stock indices ended Friday’s session in the red. By the end…
By Analytical Department RoboForex USD/JPY opens the week at 162.36 on Monday. The Japanese yen…
By InvestMacro Here are the latest charts and statistics for the Commitment of Traders (COT)…
By InvestMacro The latest update for the weekly Commitment of Traders (COT) report was released…
This website uses cookies.