By InvestMacro
Here are the latest charts and statistics for the Commitment of Traders (COT) reports data published by the Commodities Futures Trading Commission (CFTC).
The latest COT data is updated through Tuesday February 21st and shows a quick view of how large traders (for-profit speculators and commercial entities) were positioned in the futures markets.
*** This data is still a few weeks behind the current data because the CFTC up-to-date data has been delayed due to a cybersecurity event that happened in early February to ION Cleared Derivatives (a subsidiary of ION Markets). This hack of ION has created a problem for the large trader positions to be reported and reconciled. The CFTC has back-filled some data over the past few weeks and will get the data back up to date in the coming weeks.
Free Reports:
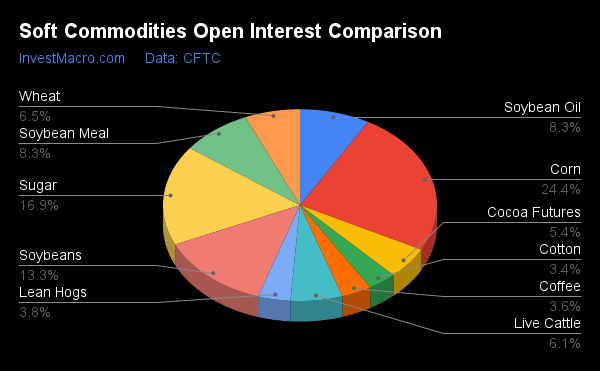
The COT soft commodities markets speculator bets were higher that week as seven out of the eleven softs markets we cover had higher positioning while the other four markets had lower speculator contracts.
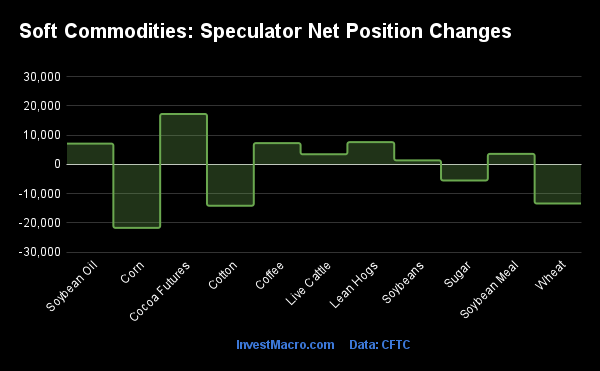
Leading the gains for the softs markets was Cocoa (17,227 contracts), Lean Hogs (7,584 contracts) with Coffee (7,266 contracts), Soybean Oil (7,105 contracts), Soybean Meal (3,600 contracts), Live Cattle (3,446 contracts) and Soybeans (1,374 contracts) also showing positive weeks.
The markets with the declines in speculator bets were Corn (-21,689 contracts) with Wheat (-13,364 contracts), Cotton (-14,119 contracts) and Sugar (-5,488 contracts) also registering lower bets on the week.
| Feb-21-2023 | OI | OI-Index | Spec-Net | Spec-Index | Com-Net | COM-Index | Smalls-Net | Smalls-Index |
|---|---|---|---|---|---|---|---|---|
| WTI Crude | 1,756,029 | 32 | 219,671 | 4 | -241,297 | 96 | 21,626 | 35 |
| Gold | 422,648 | 0 | 107,101 | 21 | -129,355 | 77 | 22,254 | 36 |
| Silver | 123,906 | 3 | 9,902 | 32 | -23,050 | 66 | 13,148 | 39 |
| Copper | 219,205 | 58 | 2,049 | 35 | -8,510 | 62 | 6,461 | 63 |
| Palladium | 11,943 | 84 | -5,188 | 0 | 5,552 | 100 | -364 | 20 |
| Platinum | 67,499 | 58 | 2,905 | 22 | -8,394 | 76 | 5,489 | 42 |
| Natural Gas | 1,270,686 | 63 | -179,264 | 17 | 141,515 | 82 | 37,749 | 69 |
| Brent | 150,907 | 12 | -39,900 | 33 | 36,847 | 65 | 3,053 | 51 |
| Heating Oil | 259,558 | 20 | 17,565 | 67 | -26,091 | 45 | 8,526 | 28 |
| Soybeans | 731,529 | 34 | 193,260 | 67 | -150,141 | 45 | -43,119 | 0 |
| Corn | 1,340,322 | 20 | 283,023 | 66 | -209,635 | 42 | -73,388 | 6 |
| Coffee | 196,128 | 9 | 12,316 | 40 | -14,198 | 62 | 1,882 | 26 |
| Sugar | 926,553 | 53 | 233,338 | 74 | -277,742 | 23 | 44,404 | 63 |
| Wheat | 359,360 | 42 | -47,488 | 1 | 47,552 | 97 | -64 | 100 |
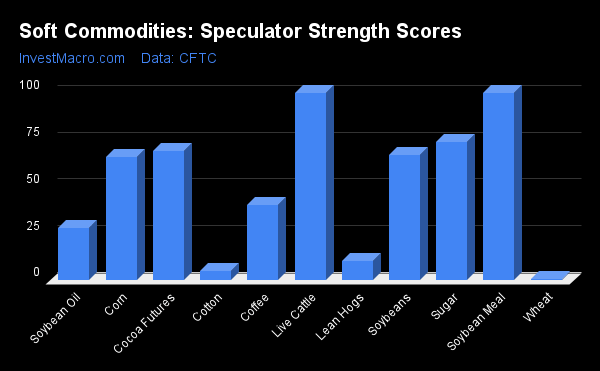
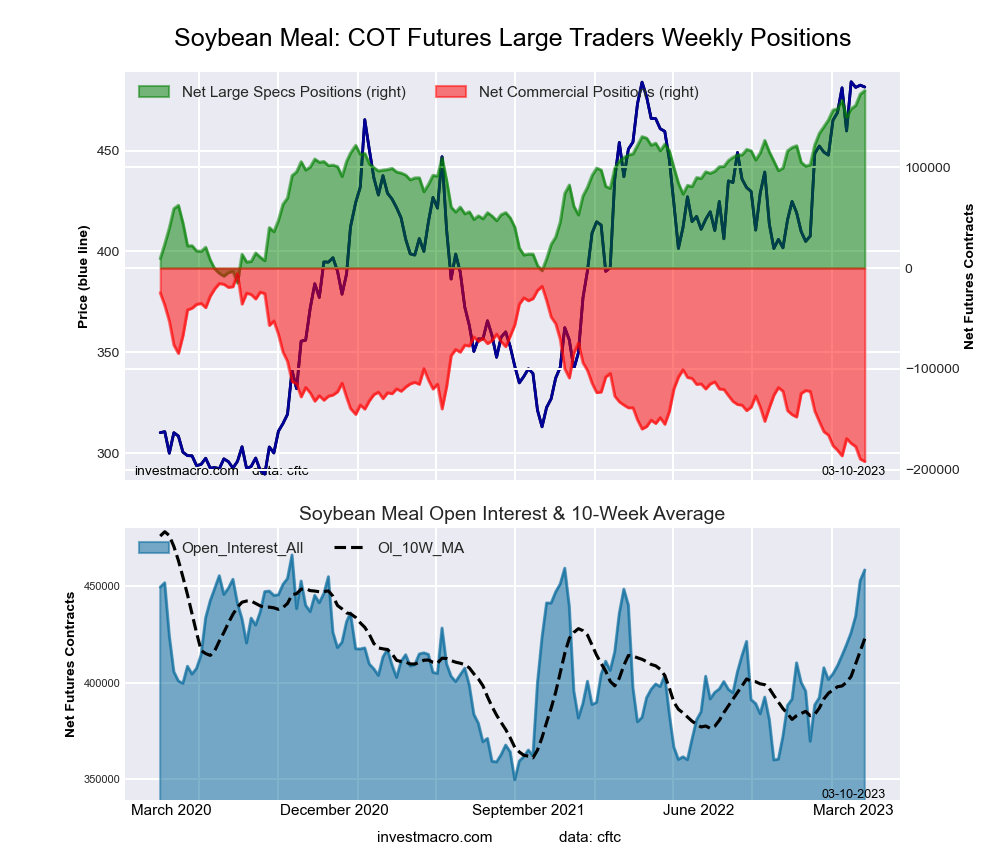
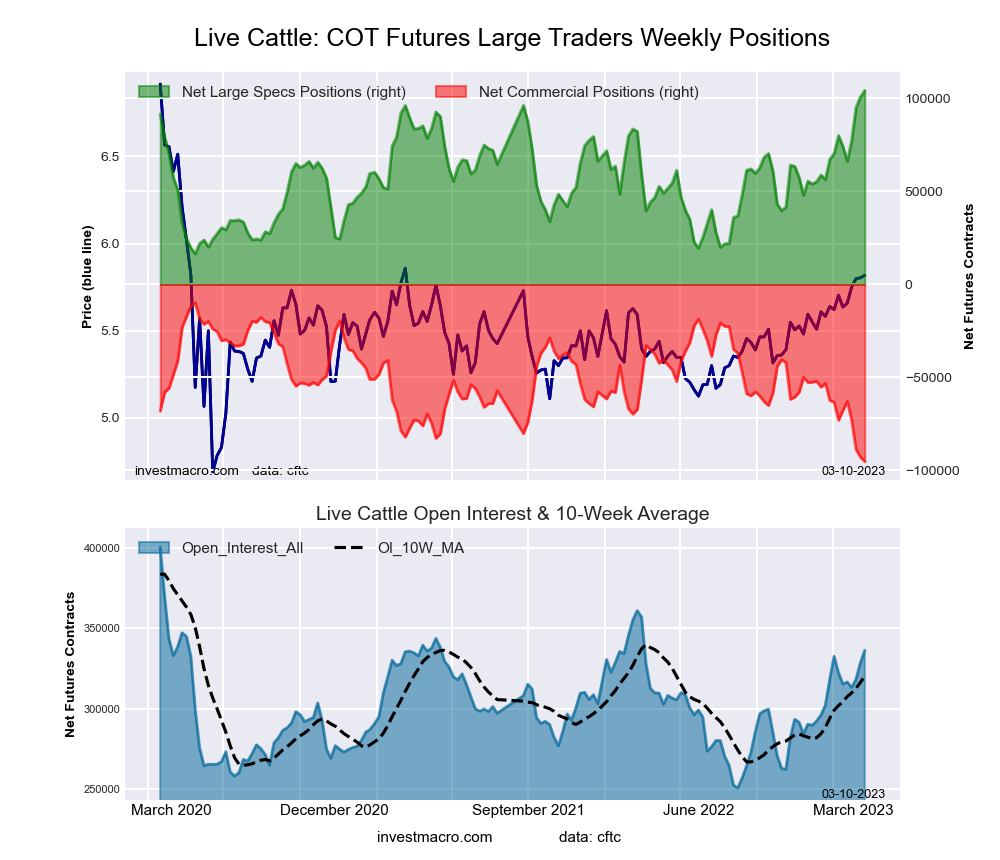
COT Strength Scores (a normalized measure of Speculator positions over a 3-Year range, from 0 to 100 where above 80 is Extreme-Bullish and below 20 is Extreme-Bearish) showed that Soybean Meal (100 percent) and Live Cattle (100 percent) led the softs markets on February 21st. Sugar (74 percent), Cocoa (69 percent) and Soybeans (67 percent) come in as the next highest in the weekly strength scores.
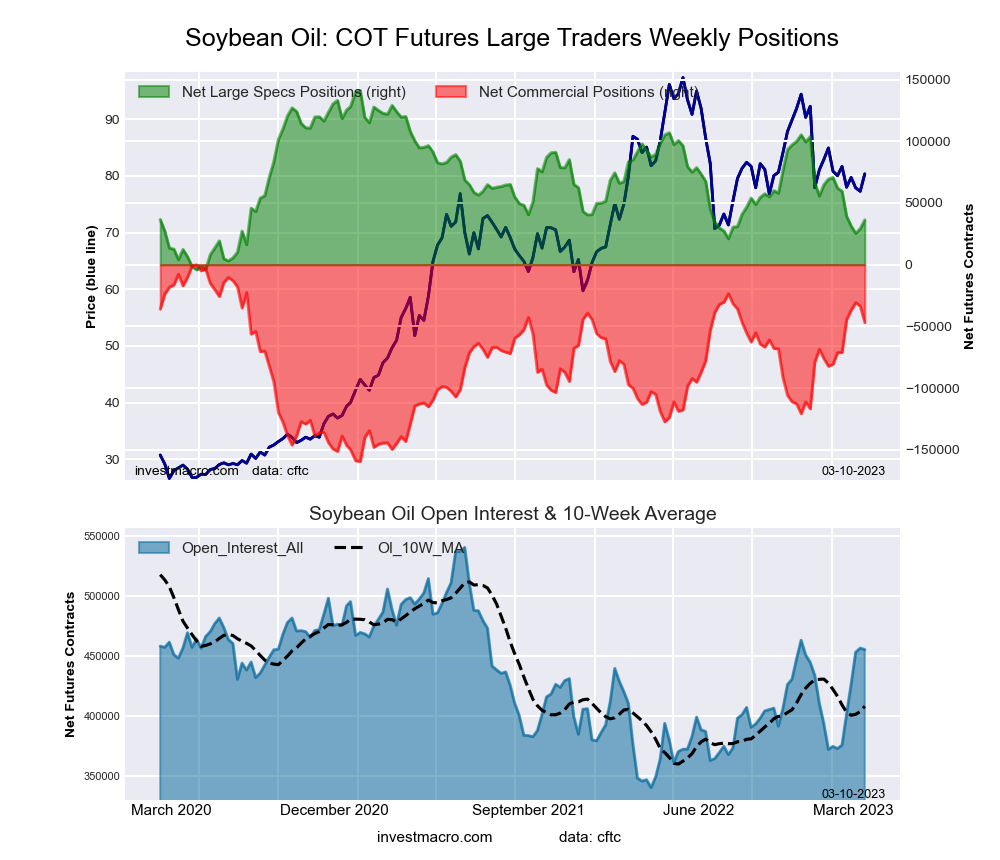
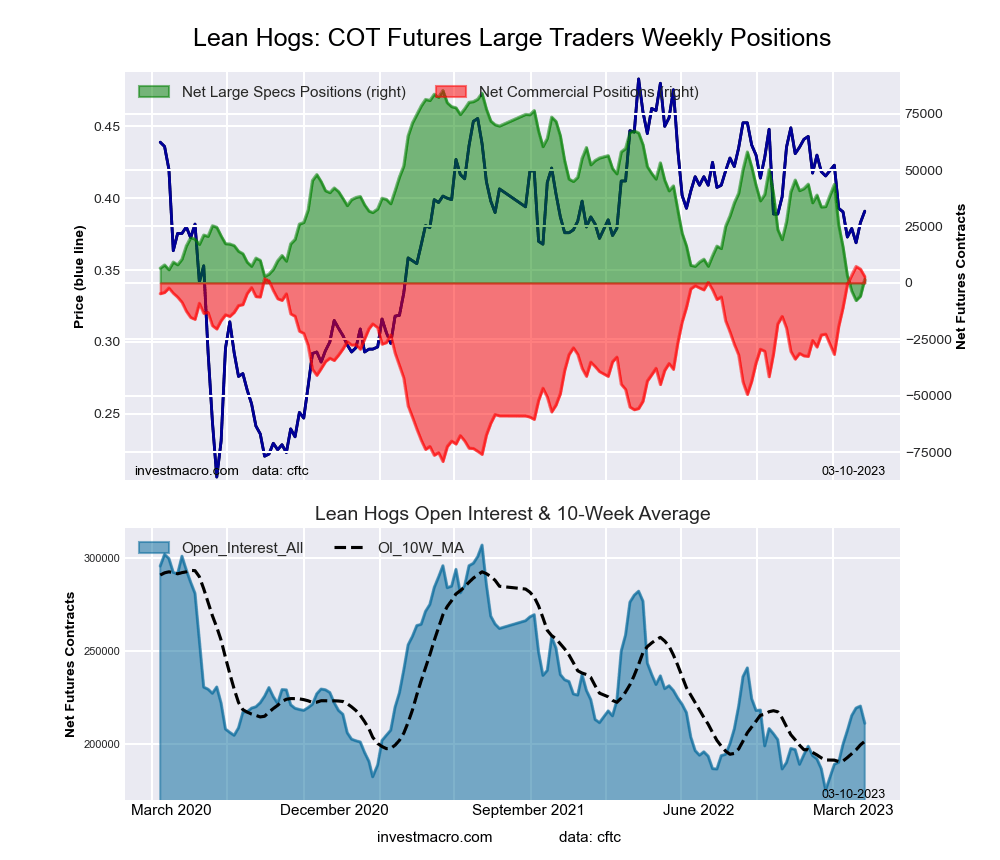
On the downside, Wheat (1 percent), Cotton (5 percent) and Lean Hogs (10 percent) came in at the lowest strength levels and are in Extreme-Bearish territory (below 20 percent). The next lowest strength score was Soybean Oil (28 percent).
Strength Statistics:
Corn (66.2 percent) vs Corn previous week (69.0 percent)
Sugar (74.2 percent) vs Sugar previous week (76.0 percent)
Coffee (40.1 percent) vs Coffee previous week (32.6 percent)
Soybeans (67.2 percent) vs Soybeans previous week (66.7 percent)
Soybean Oil (27.8 percent) vs Soybean Oil previous week (23.0 percent)
Soybean Meal (100.0 percent) vs Soybean Meal previous week (98.1 percent)
Live Cattle (100.0 percent) vs Live Cattle previous week (96.1 percent)
Lean Hogs (10.2 percent) vs Lean Hogs previous week (2.0 percent)
Cotton (5.0 percent) vs Cotton previous week (15.8 percent)
Cocoa (69.4 percent) vs Cocoa previous week (50.4 percent)
Wheat (0.9 percent) vs Wheat previous week (14.9 percent)
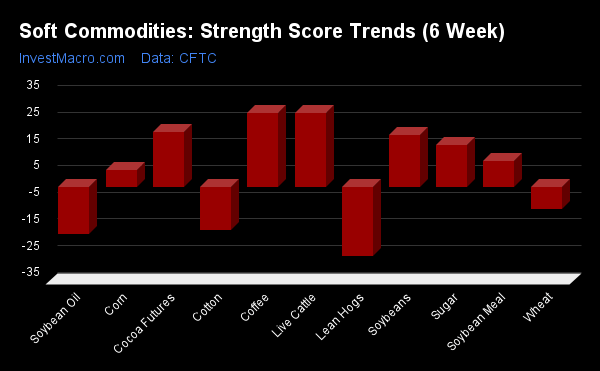
COT Strength Score Trends (or move index, calculates the 6-week changes in strength scores) showed that Coffee (28 percent) and Live Cattle (28 percent) led the past six weeks trends for soft commodities. Cocoa (21 percent), Soybeans (20 percent) and Sugar (16 percent) were the next highest positive movers in the latest trends data.
Lean Hogs (-26 percent) led the downside trend scores that week with Soybean Oil (-18 percent), Cotton (-16 percent) and Wheat (-8 percent) following next with lower trend scores.
Strength Trend Statistics:
Corn (6.3 percent) vs Corn previous week (4.8 percent)
Sugar (15.7 percent) vs Sugar previous week (3.6 percent)
Coffee (27.7 percent) vs Coffee previous week (6.0 percent)
Soybeans (19.6 percent) vs Soybeans previous week (16.0 percent)
Soybean Oil (-17.8 percent) vs Soybean Oil previous week (-28.6 percent)
Soybean Meal (9.6 percent) vs Soybean Meal previous week (8.3 percent)
Live Cattle (27.6 percent) vs Live Cattle previous week (34.5 percent)
Lean Hogs (-25.8 percent) vs Lean Hogs previous week (-53.0 percent)
Cotton (-16.0 percent) vs Cotton previous week (-4.1 percent)
Cocoa (20.7 percent) vs Cocoa previous week (1.1 percent)
Wheat (-8.2 percent) vs Wheat previous week (-1.9 percent)
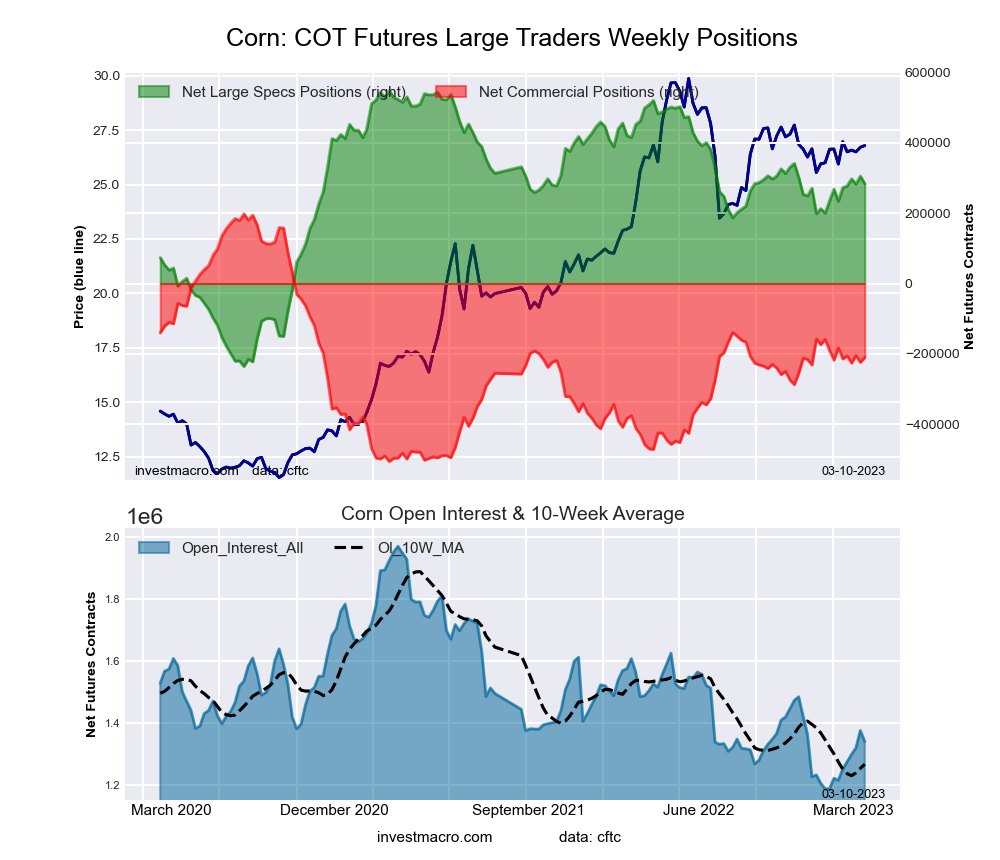
The week’s current strength score (the trader positioning range over the past three years, measured from 0 to 100) shows the speculators are currently Bullish with a score of 66.2 percent. The commercials are Bearish with a score of 42.0 percent and the small traders (not shown in chart) are Bearish-Extreme with a score of 5.6 percent.
| CORN Futures Statistics | SPECULATORS | COMMERCIALS | SMALL TRADERS |
| – Percent of Open Interest Longs: | 30.9 | 41.9 | 8.5 |
| – Percent of Open Interest Shorts: | 9.8 | 57.5 | 14.0 |
| – Net Position: | 283,023 | -209,635 | -73,388 |
| – Gross Longs: | 414,502 | 561,129 | 114,376 |
| – Gross Shorts: | 131,479 | 770,764 | 187,764 |
| – Long to Short Ratio: | 3.2 to 1 | 0.7 to 1 | 0.6 to 1 |
| NET POSITION TREND: | |||
| – Strength Index Score (3 Year Range Pct): | 66.2 | 42.0 | 5.6 |
| – Strength Index Reading (3 Year Range): | Bullish | Bearish | Bearish-Extreme |
| NET POSITION MOVEMENT INDEX: | |||
| – 6-Week Change in Strength Index: | 6.3 | -3.8 | -16.1 |
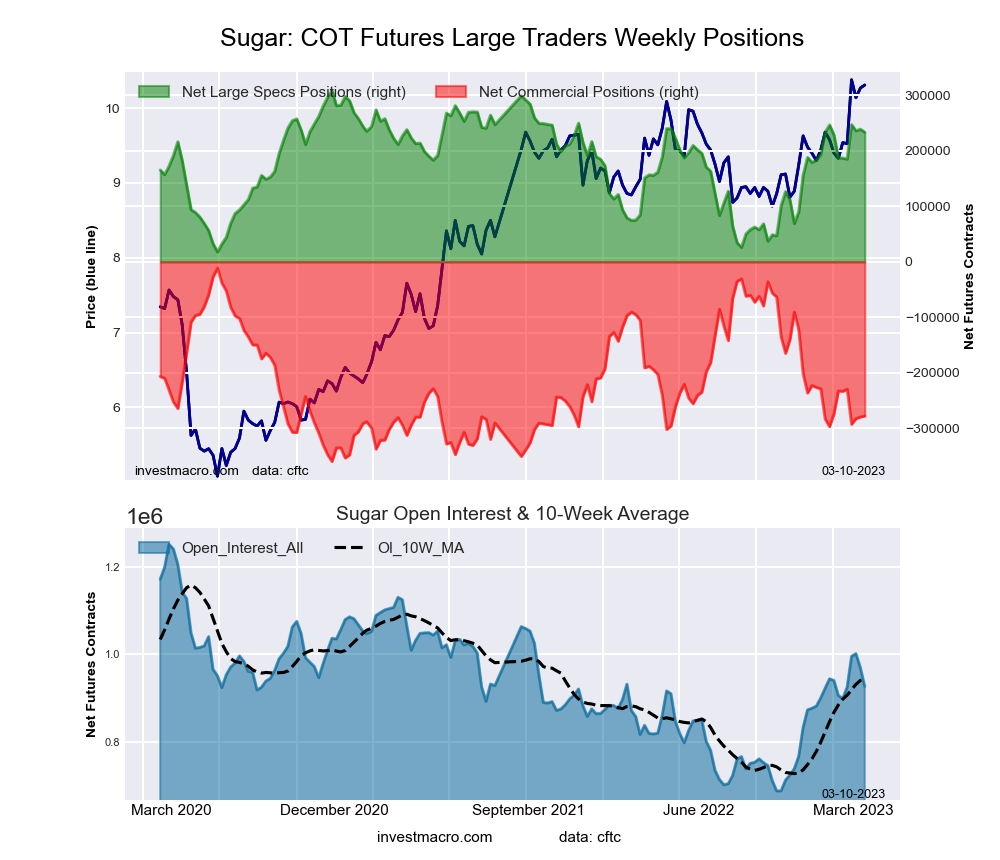
The week’s current strength score (the trader positioning range over the past three years, measured from 0 to 100) shows the speculators are currently Bullish with a score of 74.2 percent. The commercials are Bearish with a score of 23.5 percent and the small traders (not shown in chart) are Bullish with a score of 62.8 percent.
| SUGAR Futures Statistics | SPECULATORS | COMMERCIALS | SMALL TRADERS |
| – Percent of Open Interest Longs: | 34.3 | 39.5 | 10.3 |
| – Percent of Open Interest Shorts: | 9.1 | 69.5 | 5.6 |
| – Net Position: | 233,338 | -277,742 | 44,404 |
| – Gross Longs: | 317,876 | 366,001 | 95,884 |
| – Gross Shorts: | 84,538 | 643,743 | 51,480 |
| – Long to Short Ratio: | 3.8 to 1 | 0.6 to 1 | 1.9 to 1 |
| NET POSITION TREND: | |||
| – Strength Index Score (3 Year Range Pct): | 74.2 | 23.5 | 62.8 |
| – Strength Index Reading (3 Year Range): | Bullish | Bearish | Bullish |
| NET POSITION MOVEMENT INDEX: | |||
| – 6-Week Change in Strength Index: | 15.7 | -13.0 | -0.5 |
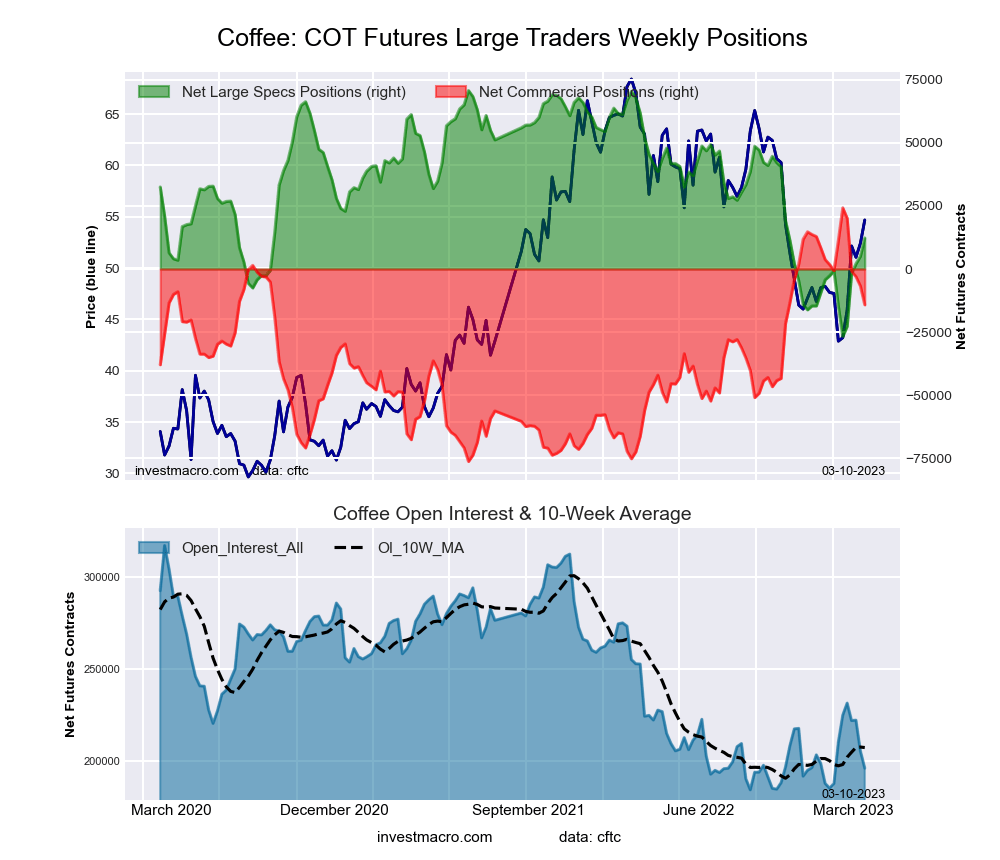
The week’s current strength score (the trader positioning range over the past three years, measured from 0 to 100) shows the speculators are currently Bearish with a score of 40.1 percent. The commercials are Bullish with a score of 61.8 percent and the small traders (not shown in chart) are Bearish with a score of 25.6 percent.
| COFFEE Futures Statistics | SPECULATORS | COMMERCIALS | SMALL TRADERS |
| – Percent of Open Interest Longs: | 22.5 | 46.2 | 5.1 |
| – Percent of Open Interest Shorts: | 16.2 | 53.5 | 4.1 |
| – Net Position: | 12,316 | -14,198 | 1,882 |
| – Gross Longs: | 44,122 | 90,640 | 10,018 |
| – Gross Shorts: | 31,806 | 104,838 | 8,136 |
| – Long to Short Ratio: | 1.4 to 1 | 0.9 to 1 | 1.2 to 1 |
| NET POSITION TREND: | |||
| – Strength Index Score (3 Year Range Pct): | 40.1 | 61.8 | 25.6 |
| – Strength Index Reading (3 Year Range): | Bearish | Bullish | Bearish |
| NET POSITION MOVEMENT INDEX: | |||
| – 6-Week Change in Strength Index: | 27.7 | -25.4 | -21.6 |
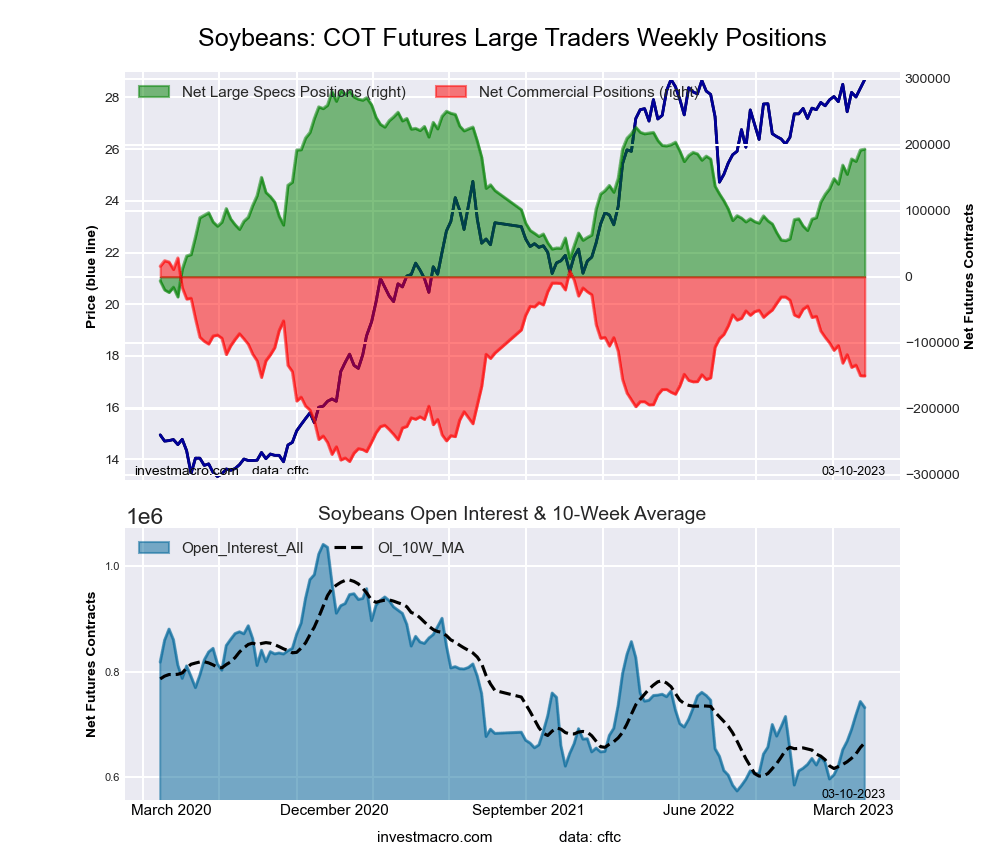
The week’s current strength score (the trader positioning range over the past three years, measured from 0 to 100) shows the speculators are currently Bullish with a score of 67.2 percent. The commercials are Bearish with a score of 44.9 percent and the small traders (not shown in chart) are Bearish-Extreme with a score of 0.0 percent.
| SOYBEANS Futures Statistics | SPECULATORS | COMMERCIALS | SMALL TRADERS |
| – Percent of Open Interest Longs: | 32.8 | 45.2 | 6.5 |
| – Percent of Open Interest Shorts: | 6.3 | 65.7 | 12.4 |
| – Net Position: | 193,260 | -150,141 | -43,119 |
| – Gross Longs: | 239,615 | 330,719 | 47,851 |
| – Gross Shorts: | 46,355 | 480,860 | 90,970 |
| – Long to Short Ratio: | 5.2 to 1 | 0.7 to 1 | 0.5 to 1 |
| NET POSITION TREND: | |||
| – Strength Index Score (3 Year Range Pct): | 67.2 | 44.9 | 0.0 |
| – Strength Index Reading (3 Year Range): | Bullish | Bearish | Bearish-Extreme |
| NET POSITION MOVEMENT INDEX: | |||
| – 6-Week Change in Strength Index: | 19.6 | -15.9 | -11.6 |
The week’s current strength score (the trader positioning range over the past three years, measured from 0 to 100) shows the speculators are currently Bearish with a score of 27.8 percent. The commercials are Bullish with a score of 70.7 percent and the small traders (not shown in chart) are Bullish with a score of 53.0 percent.
| SOYBEAN OIL Futures Statistics | SPECULATORS | COMMERCIALS | SMALL TRADERS |
| – Percent of Open Interest Longs: | 18.9 | 52.8 | 7.5 |
| – Percent of Open Interest Shorts: | 10.9 | 63.1 | 5.2 |
| – Net Position: | 36,282 | -46,887 | 10,605 |
| – Gross Longs: | 86,110 | 240,461 | 34,271 |
| – Gross Shorts: | 49,828 | 287,348 | 23,666 |
| – Long to Short Ratio: | 1.7 to 1 | 0.8 to 1 | 1.4 to 1 |
| NET POSITION TREND: | |||
| – Strength Index Score (3 Year Range Pct): | 27.8 | 70.7 | 53.0 |
| – Strength Index Reading (3 Year Range): | Bearish | Bullish | Bullish |
| NET POSITION MOVEMENT INDEX: | |||
| – 6-Week Change in Strength Index: | -17.8 | 15.4 | 5.0 |
The week’s current strength score (the trader positioning range over the past three years, measured from 0 to 100) shows the speculators are currently Bullish-Extreme with a score of 100.0 percent. The commercials are Bearish-Extreme with a score of 0.0 percent and the small traders (not shown in chart) are Bearish-Extreme with a score of 14.7 percent.
| SOYBEAN MEAL Futures Statistics | SPECULATORS | COMMERCIALS | SMALL TRADERS |
| – Percent of Open Interest Longs: | 41.5 | 33.8 | 10.5 |
| – Percent of Open Interest Shorts: | 3.1 | 75.6 | 7.0 |
| – Net Position: | 175,951 | -191,708 | 15,757 |
| – Gross Longs: | 190,333 | 154,817 | 48,064 |
| – Gross Shorts: | 14,382 | 346,525 | 32,307 |
| – Long to Short Ratio: | 13.2 to 1 | 0.4 to 1 | 1.5 to 1 |
| NET POSITION TREND: | |||
| – Strength Index Score (3 Year Range Pct): | 100.0 | 0.0 | 14.7 |
| – Strength Index Reading (3 Year Range): | Bullish-Extreme | Bearish-Extreme | Bearish-Extreme |
| NET POSITION MOVEMENT INDEX: | |||
| – 6-Week Change in Strength Index: | 9.6 | -6.0 | -36.7 |
The week’s current strength score (the trader positioning range over the past three years, measured from 0 to 100) shows the speculators are currently Bullish-Extreme with a score of 100.0 percent. The commercials are Bearish-Extreme with a score of 0.0 percent and the small traders (not shown in chart) are Bearish with a score of 38.8 percent.
| LIVE CATTLE Futures Statistics | SPECULATORS | COMMERCIALS | SMALL TRADERS |
| – Percent of Open Interest Longs: | 45.0 | 23.3 | 10.4 |
| – Percent of Open Interest Shorts: | 14.0 | 51.6 | 13.1 |
| – Net Position: | 104,274 | -95,188 | -9,086 |
| – Gross Longs: | 151,310 | 78,368 | 35,012 |
| – Gross Shorts: | 47,036 | 173,556 | 44,098 |
| – Long to Short Ratio: | 3.2 to 1 | 0.5 to 1 | 0.8 to 1 |
| NET POSITION TREND: | |||
| – Strength Index Score (3 Year Range Pct): | 100.0 | 0.0 | 38.8 |
| – Strength Index Reading (3 Year Range): | Bullish-Extreme | Bearish-Extreme | Bearish |
| NET POSITION MOVEMENT INDEX: | |||
| – 6-Week Change in Strength Index: | 27.6 | -26.0 | -11.4 |
The week’s current strength score (the trader positioning range over the past three years, measured from 0 to 100) shows the speculators are currently Bearish-Extreme with a score of 10.2 percent. The commercials are Bullish-Extreme with a score of 94.8 percent and the small traders (not shown in chart) are Bullish with a score of 74.0 percent.
| LEAN HOGS Futures Statistics | SPECULATORS | COMMERCIALS | SMALL TRADERS |
| – Percent of Open Interest Longs: | 31.1 | 35.1 | 10.8 |
| – Percent of Open Interest Shorts: | 30.3 | 33.8 | 12.9 |
| – Net Position: | 1,704 | 2,763 | -4,467 |
| – Gross Longs: | 65,678 | 74,070 | 22,814 |
| – Gross Shorts: | 63,974 | 71,307 | 27,281 |
| – Long to Short Ratio: | 1.0 to 1 | 1.0 to 1 | 0.8 to 1 |
| NET POSITION TREND: | |||
| – Strength Index Score (3 Year Range Pct): | 10.2 | 94.8 | 74.0 |
| – Strength Index Reading (3 Year Range): | Bearish-Extreme | Bullish-Extreme | Bullish |
| NET POSITION MOVEMENT INDEX: | |||
| – 6-Week Change in Strength Index: | -25.8 | 25.6 | 10.2 |
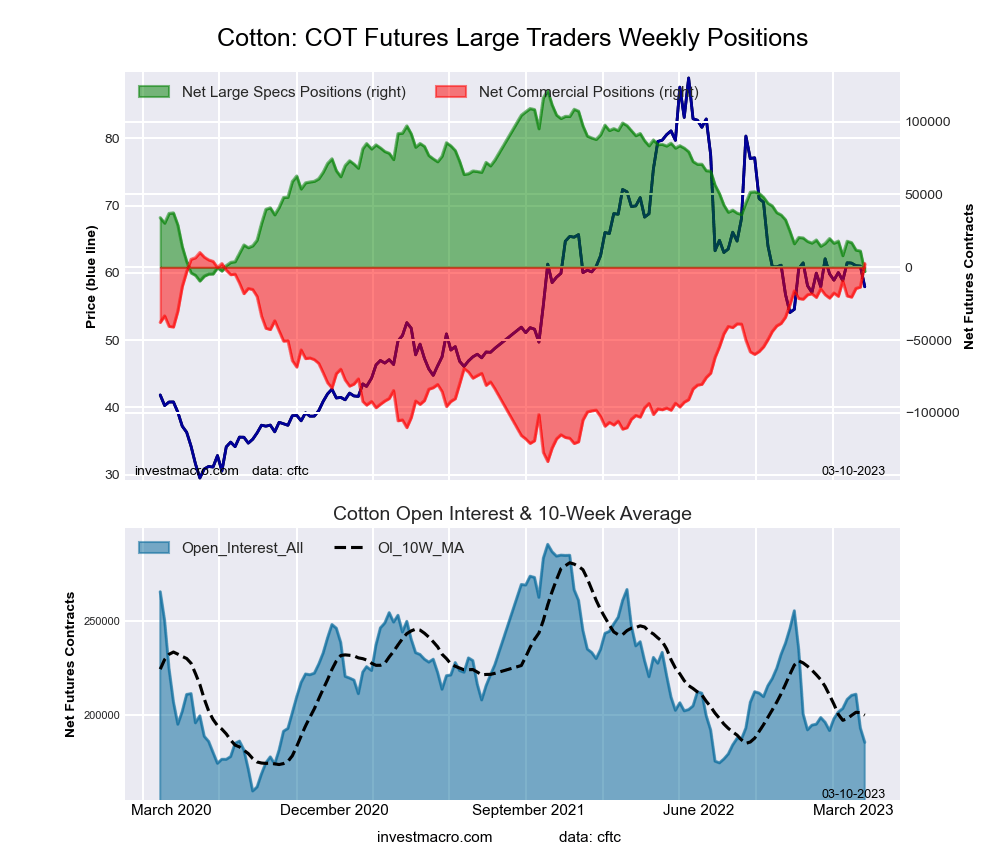
The week’s current strength score (the trader positioning range over the past three years, measured from 0 to 100) shows the speculators are currently Bearish-Extreme with a score of 5.0 percent. The commercials are Bullish-Extreme with a score of 94.7 percent and the small traders (not shown in chart) are Bearish-Extreme with a score of 13.0 percent.
| COTTON Futures Statistics | SPECULATORS | COMMERCIALS | SMALL TRADERS |
| – Percent of Open Interest Longs: | 27.8 | 51.2 | 6.6 |
| – Percent of Open Interest Shorts: | 29.4 | 49.9 | 6.4 |
| – Net Position: | -2,969 | 2,542 | 427 |
| – Gross Longs: | 51,460 | 94,938 | 12,306 |
| – Gross Shorts: | 54,429 | 92,396 | 11,879 |
| – Long to Short Ratio: | 0.9 to 1 | 1.0 to 1 | 1.0 to 1 |
| NET POSITION TREND: | |||
| – Strength Index Score (3 Year Range Pct): | 5.0 | 94.7 | 13.0 |
| – Strength Index Reading (3 Year Range): | Bearish-Extreme | Bullish-Extreme | Bearish-Extreme |
| NET POSITION MOVEMENT INDEX: | |||
| – 6-Week Change in Strength Index: | -16.0 | 15.7 | -10.1 |
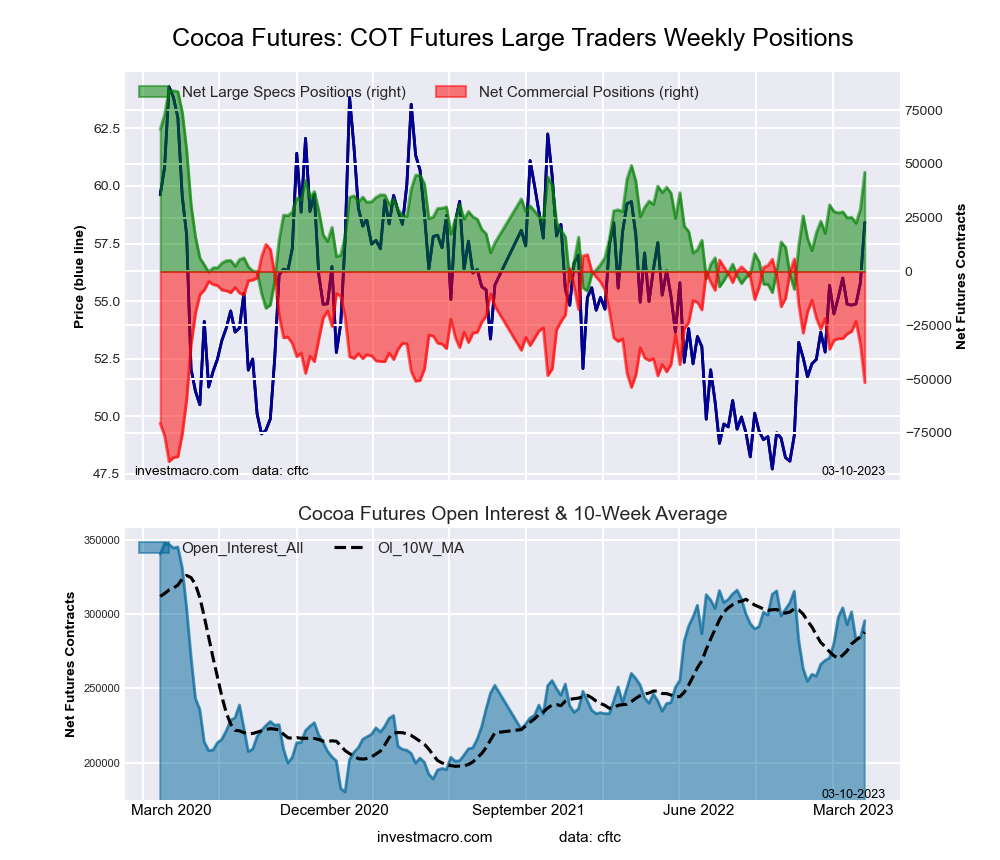
The week’s current strength score (the trader positioning range over the past three years, measured from 0 to 100) shows the speculators are currently Bullish with a score of 69.4 percent. The commercials are Bearish with a score of 27.1 percent and the small traders (not shown in chart) are Bullish with a score of 51.7 percent.
| COCOA Futures Statistics | SPECULATORS | COMMERCIALS | SMALL TRADERS |
| – Percent of Open Interest Longs: | 35.8 | 39.9 | 4.9 |
| – Percent of Open Interest Shorts: | 20.2 | 57.4 | 3.0 |
| – Net Position: | 46,085 | -51,594 | 5,509 |
| – Gross Longs: | 105,772 | 117,967 | 14,353 |
| – Gross Shorts: | 59,687 | 169,561 | 8,844 |
| – Long to Short Ratio: | 1.8 to 1 | 0.7 to 1 | 1.6 to 1 |
| NET POSITION TREND: | |||
| – Strength Index Score (3 Year Range Pct): | 69.4 | 27.1 | 51.7 |
| – Strength Index Reading (3 Year Range): | Bullish | Bearish | Bullish |
| NET POSITION MOVEMENT INDEX: | |||
| – 6-Week Change in Strength Index: | 20.7 | -23.2 | 15.4 |
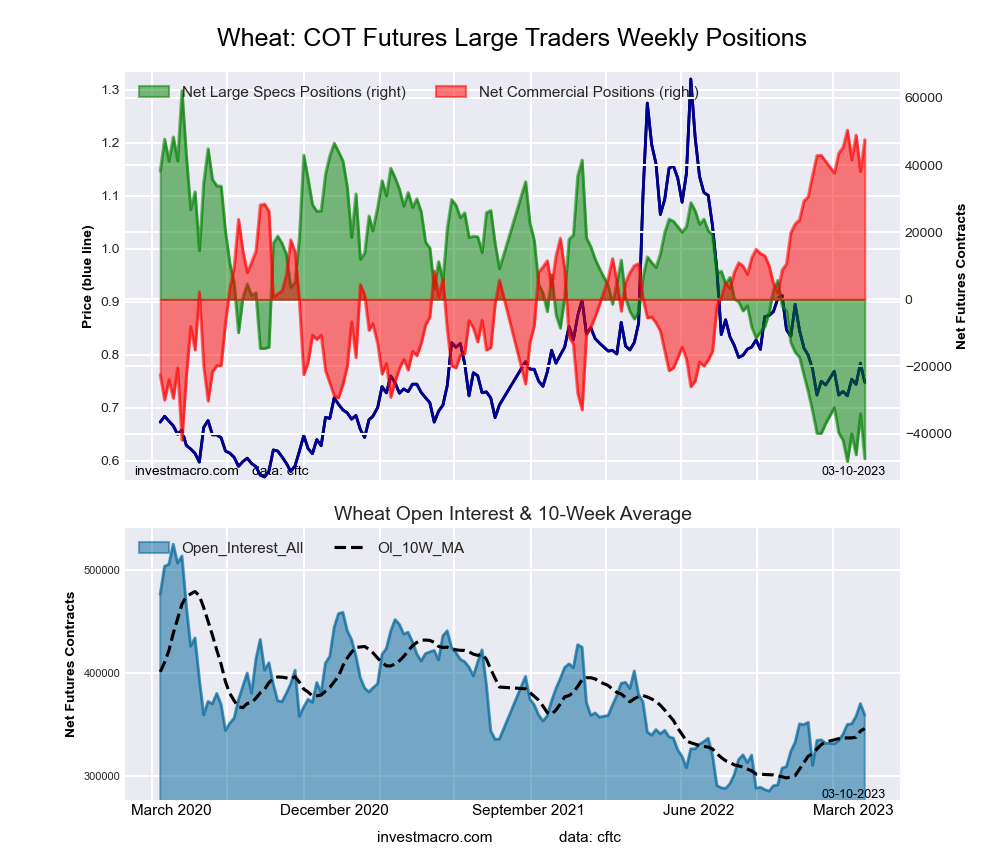
The week’s current strength score (the trader positioning range over the past three years, measured from 0 to 100) shows the speculators are currently Bearish-Extreme with a score of 0.9 percent. The commercials are Bullish-Extreme with a score of 96.7 percent and the small traders (not shown in chart) are Bullish-Extreme with a score of 100.0 percent.
| WHEAT Futures Statistics | SPECULATORS | COMMERCIALS | SMALL TRADERS |
| – Percent of Open Interest Longs: | 25.7 | 39.0 | 10.3 |
| – Percent of Open Interest Shorts: | 38.9 | 25.8 | 10.3 |
| – Net Position: | -47,488 | 47,552 | -64 |
| – Gross Longs: | 92,453 | 140,224 | 36,892 |
| – Gross Shorts: | 139,941 | 92,672 | 36,956 |
| – Long to Short Ratio: | 0.7 to 1 | 1.5 to 1 | 1.0 to 1 |
| NET POSITION TREND: | |||
| – Strength Index Score (3 Year Range Pct): | 0.9 | 96.7 | 100.0 |
| – Strength Index Reading (3 Year Range): | Bearish-Extreme | Bullish-Extreme | Bullish-Extreme |
| NET POSITION MOVEMENT INDEX: | |||
| – 6-Week Change in Strength Index: | -8.2 | 4.7 | 17.7 |
Article By InvestMacro – Receive our weekly COT Newsletter
*COT Report: The COT data, released weekly to the public each Friday, is updated through the most recent Tuesday (data is 3 days old) and shows a quick view of how large speculators or non-commercials (for-profit traders) were positioned in the futures markets.
The CFTC categorizes trader positions according to commercial hedgers (traders who use futures contracts for hedging as part of the business), non-commercials (large traders who speculate to realize trading profits) and nonreportable traders (usually small traders/speculators) as well as their open interest (contracts open in the market at time of reporting). See CFTC criteria here.
By JustMarkets The US stock indices ended Friday’s session in the red. By the end…
By Analytical Department RoboForex USD/JPY opens the week at 162.36 on Monday. The Japanese yen…
By InvestMacro Here are the latest charts and statistics for the Commitment of Traders (COT)…
By InvestMacro The latest update for the weekly Commitment of Traders (COT) report was released…
By InvestMacro Here are the latest charts and statistics for the Commitment of Traders (COT)…
By InvestMacro Here are the latest charts and statistics for the Commitment of Traders (COT)…
This website uses cookies.